How to Understand Planning Areas in APO
Executive Summary
- We cover the background on APO Planning Areas.
- This includes creating the Planning Areas, the aggregate Planning Area, and its activation.
- The Planning Area has important interactions with macros.
Introduction
Planning areas are the central data structures for Demand Planning and Supply Network Planning.
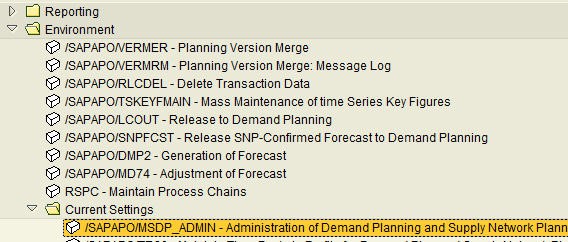
To go to planning areas or to create planning areas, go to the following: <p “>Both the planning object structure and the planning area can be set up from the same transaction.
The Path
Supply Network Planning – Environment – Current Settings – Administration of Demand Planning and Supply Network Planning
They hold key figures. To find out more about key figures, see this article. Here is an example of a planning object structure; it has several characteristics. They must be added to create the POS. When we create one, we both add characteristics
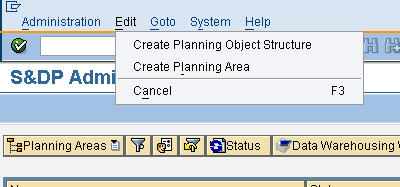
Creating the Planning Area
The next step is to create a Planning Area pointing to the Planning Object Structure.
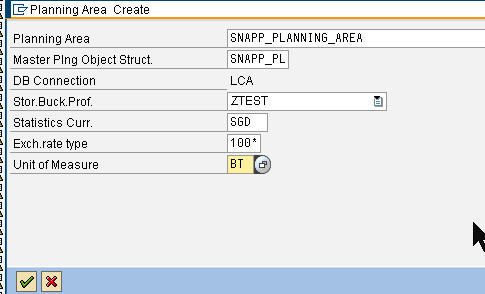 Further, it will ask for other details regarding this planning area.
Below is the first tab: 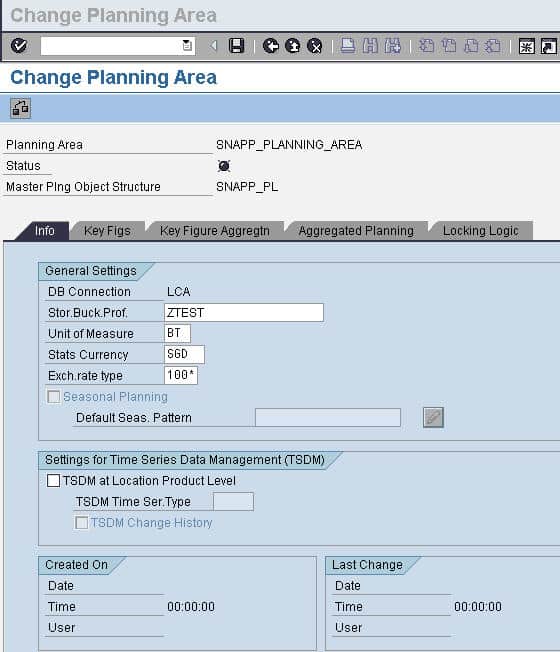 The next tab includes the Key Figures (“Key Figures” is just an overly fancy term which means the forecasted line item. Things that you plan that can hold numerical values are Key Figures.) Now it is easy to add Key Figures willy-nilly, however, of course, it is important to remember which need to be set up.
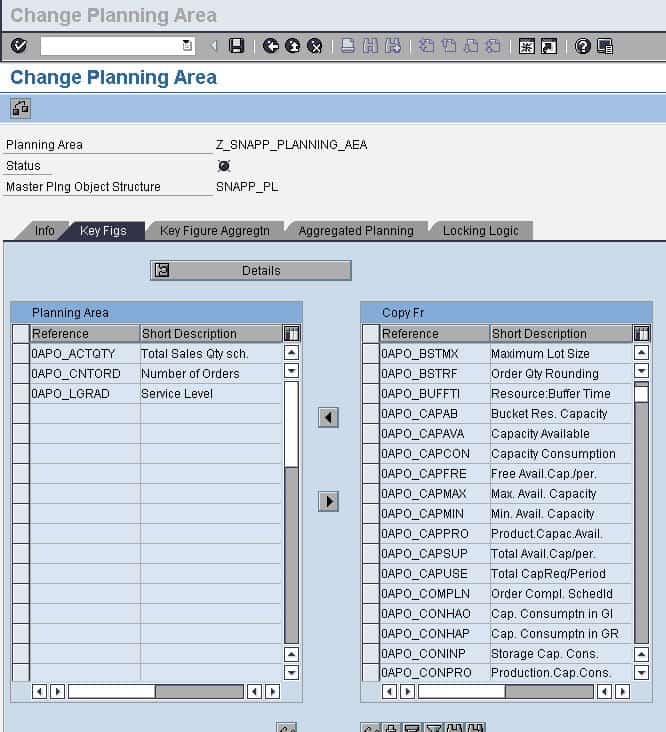
Aggregate Planning Tab
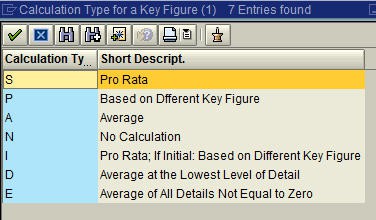
Next, it’s required to select the Aggregate Planning tab, which has the various hierarchies to select from. All of these selections need to be set up before arriving at this screen. These selections set the level of planning aggregation that you want to do in this particular planning area. After this is filled in its time to save the Planning Area — which creates it.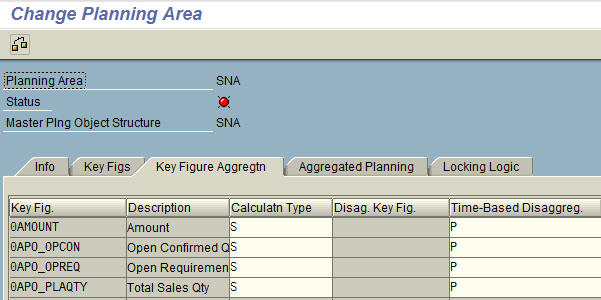 The key figure aggregates essentially decide how different key figures will be aggregated (the aggregation type – in this case, it is “Pro Rata,” which is “S.” Here is what we get when we select the dropdown.
The next field is how the key figure is disaggregated. The value currently selected is P, which stands for proportional allocation.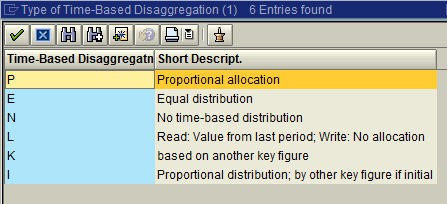 However, this is relatively simple decision-making compared to which key figures are actually to be selected. This deserves a great deal of attention. Once we back out of the S&DP Administration and then go back in, we can see that the Planning Area has been created, but it is not yet activated.
Planning Area Activation
Now, we need to perform the activation. This is not done in the object’s main area but requires you to go out to the listing level (why we don’t know). So you save in the item view but activate in the list view. Below we have a screenshot of the list view. We right mouse click and then select Create Time Series Object. 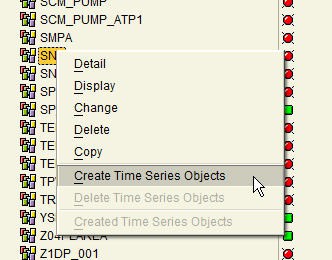 It’s important to fill in the dates. If not, it will activate the time series object for too long, which will tie up the system. This is particularly true since we are setting this up as a test. So we will choose a short time period.
 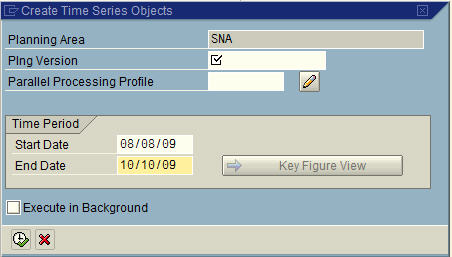 Next, we will include the Planning Version.Now we are ready to create the time series object. It’s important to remember, this creates the time series object but does not necessarily populate it with data.
  This shows it has been activated.
APO Characteristics
t’s important to recognize that DP and SNP use different characteristics, and thus different planning areas and planning object structures are created for DP and SNP.
What Are Planning Areas?
These are designed for creating an abstraction on top of materials so they can be managed in a planning process. Key figures are determined in the planning book
SNP comes with the following standard planning areas:
- “9ASNP01 (time series-based)
- 9ASNP02 (order-based)
- 9ASNP03 (for scheduling agreement processing)
- 9ASNP04 (for optimization-based planning with time-dependent restrictions)
- 9ASNP05 (for safety stock planning)
- 9AVMI03 (for deployment heuristic with consideration of demands in the source location)”
APO Planning Books
Planning books exist in both SNP and DP. They allow are ostensibly designed to allow the planner to see their material and quantities effectively. However, in practice, they are actually complicated to use and are substantially lower in functionality than Excel. This is, of course, not a problem limited to SAP and is described in this article.
This is why so many planners continue to use Excel even after APO or SCM is installed.
APO Macros
Planning books allow for the creation of macros, which are essentially formulas that calculate a specific cell or row in the planning book. Macros can be set up in the planning book for how key figures (what is to be measured) such as Total Demand and Stock on Hand, Safety Stock, Reorder Point, Target Stock Level, etc…Macros are used to perform calculations on the planning book key figures. They are created in the Macro Workbench.
Below is the planning book. The main control is under the Planning Book/Data view. To the right (unseen here) is a spreadsheet view.

Below is how to configure planning books. Planning book configuration is essential, and poorly fitting planning books for the task at hand is a major reason for SAP APO implementations can fail.


Next, the key figures are selected for the planning book…

And then the characteristics.

That is primarily what a planning book is..key figures and characteristics by a time dimension.