Good Guidelines for Optimization with Spreadsheets
Executive Summary
- Using spreadsheets to explain optimization is beneficial.
- We cover the advantages and disadvantages of using spreadsheet optimizers.

The Popularizing of Optimization Mathematics with Spreadsheets
In researching different optimization mathematics, I have observed how research papers do not include spreadsheet models and their documents. Spreadsheet models can be purchased with several books that focus on optimization. However, this article investigates the benefits of including spreadsheet models more broadly.
The Benefits of Placing Optimization Problems in Excel
The fact that optimization problems can be solved in Excel is a boon to understanding for many people, including me, who don’t like complex mathematical formulas but can understand the equation if placed into Excel. In my view, lengthy mathematical algebraic formulas shroud rather than illuminate, at least for the vast majority of non-mathematicians. Papers are designed to contribute to and extend knowledge. However, the best knowledge is the knowledge that can be used.
Kenneth R. Baker, who wrote the book “Optimization Modeling with Spreadsheets,” notes that optimization with solvers being applied to spreadsheets is becoming increasingly popular:
“Optimization tools have been available on computers for several decades, prior to the widespread use of electronic spreadsheets. Before spreadsheets became popular, optimization was available as stand-alone software; it relied on an algebraic approach, but it was often accessible only be technical experts.” – Kenneth Baker
He sees excellent advantages to spreadsheets for optimization. One he describes is how the spreadsheet has become “a common language for analysis,” and that software packages available for spreadsheet optimization now include some of the most powerful tools available.” He notes that the disadvantages of spreadsheets are…
A disadvantage of using spreadsheets is that they are not always transparent….the analyst has a lot of flexibility in the layout and organization of a spreadsheet, but this flexibility taken too far, may detract from effective communication. In this book, we try to promote better communication by suggesting standard forms for particular types of models. – Kenneth R. Baker
He also shows the following advantages to each approach:
Spreadsheet Approaches:
- Several algorithms available in one place
- Integration of raw data and model data
- Flexibility in layout and design
- Ease of communication with non-specialists
- Intrinsic credibility
Algebraic Approaches
- Large problem sizes accommodated
- Concise model specification
- Standardized model description
- Enhancements possible for non-special cases
There is no reason there can’t be both published in research papers. That is the algebraic formula included in the paper, along with a mathematical model placed into Excel. Excel will often need a Solver such as Oracle Crystal Ball and its Optimizer, MATLAB, spreadsheet reading module, or Frontline Solver, just to name some of the most prominent. Obtaining that solver is the responsibility of the person reading the research paper. However, all the mathematics should be in the spreadsheet and ready to use. It should also be recognized that the formulas in academic papers and mathematics are generally never used as they appear but must always be translated to work as part of a program or as part of Excel. After several decades of deciphering or attempting to solve mathematical formulas, I have begun to wonder if this is simply a way of encoding the information so that it is beyond specialists. This reminds me of a quote from the book by David Orrell:
“Priests of any religion like to have control over what is written, and one of the best ways to do this is to use a specialized language. A century before Galileo, the Englishman William Tyndale was so upset by the foolishness and corruption of the local clergy that he decided to circumvent them and publish a version of the Latin Vulgate Bible in plain English. The Church strongly disapproved, since this would mean that priests would lose their monopoly as interpreters of the word of God. The Archbishop of Canterbury had already declared translation of any part of the bible as heresy punishable by burning. Tyndale was trapped by an agent and arrested. He was charged as a heretic and burned at the stake.” – David Orrell
If we are still only including the formulas in research papers at this late date, I think there is good reason to believe that the authors are trying to keep the information encapsulated. There is also the commercial aspect to all of this. If the author includes the formula in a spreadsheet that he or she makes available, then in some ways, they lose control of the invention. They may not be able to charge for it if other people have it as well.
The Importance of Paying for Research Up Front
This is why it is so important to fully compensate researchers for their work so that the commercial benefits can be shared and that anyone has the opportunity to use it and even commercialize it. Without that, researchers are forced to see or otherwise attempt to commercialize their work, which prevents them from sharing it freely. When we continually cut state university funds, we force researchers to sell their work to the industry. For instance, roughly 2% of the US’s gross domestic product goes to paying the pharmaceutical industry not for drugs they invented but for drugs they took from universities (they may have paid some minor amount). They don’t do the primary research, but take control of the drug, market it, extend patent monopolies on it, and we all pay immensely for this. If we took just a small fraction of the money made by pharmaceutical companies (say 10% of the 2% of GDP figure), there would be no necessity for drug patents. We could do more research than we do now. Researchers could be better paid, and there would be far fewer dangerous drugs of dubious (in often cases zero or negative) value that is pushed through the (pharmaceutical companies use part of their 2% take of GDP to pay off and hire ex-FDA, high-ranking officials, to push through harmful drugs) FDA to meet pharmaceutical profit objectives. Under a plan where all research costs (primary and clinical trial) are covered up front by the government, all drugs in the US could be sold at generic prices (the price of manufacture and distribution with some profit for the generic manufacturer – which is meager costs as it costs very little to make and distribute pills.) The other 85% of the 2% of GDP could be returned to consumers. These drugs could also be sold worldwide without any patents, which would allow them to be used in countries which cannot presently afford them. These are the benefits of paying for research upfront rather than forcing researchers to commercialize their work.
This configuration is entirely possible and is described in the article by the CEPR.
Teaching Optimization from Excel
For those interested in teaching from Excel reading this article, I highly suggest adjusting the spreadsheets that come with many books. In my view, the spreadsheet should be able to stand on its own, without explanation from a book. The spreadsheet should declare each area and its role in the overall problem. I will publish an Excel sheet that I have adjusted in the future on this site to describe what I mean. I think that Excel is vastly underused as a teaching tool for optimization.
The Main Problems with Optimization Projects
One of the main issues that I see is that both vendors and consultants are not getting the business users at their client’s hands-on feel for what optimization is. I think this is significantly related to the limited number of tools used to explain optimization to clients. It seems there are just two educational tools.
- One is PowerPoint, which explains optimization with boxes and arrows. Most of the optimization PowerPoint decks just are not that useful. If I were managing an optimization vendor, I would contract with a company specializing in technical education to get people who know how to do this right. A few educational decks could repeatedly be used with different clients.
- The second education tool is the application itself. However, a few optimization tools are useful educational tools. Secondly, this is starting for a person new to optimization too quickly. Unless they are quantitative analysis, people need to be eased into a new topic by starting from the basics. Production-ready optimization tools are not the basics.
Luckily, there are tons of tools to select from to acclimate planners and even executives to how optimization works. As with anything else, we want to start at a basic level and gauge the group to make sure that everyone understands. If people begin leaving the room or start checking email, the moderator needs to take a few breaks and give some one-on-one tutoring to make sure the group can go through as a block.
Using Excel to Teach Optimization
Managing complex projects like optimization projects mean getting the users the right exposure to the tool in the right way. I have had success explaining optimization using a few optimization scenarios in Excel. Excel is a great learning tool because while the number of people who can read scientific notation is scarce in planners, everyone can read formulas in a spreadsheet. This makes me question the point of scientific notation, but I will save that tangent for a different post.
Suffice it to say, people are comfortable with Excel, Excel has solvers that can be installed as add-ins (some of them free), so it is a great learning tool. Secondly, since all users have Excel themselves, by only walking the class through the installation of a solver on their machines, they can use the optimization scenario themselves in the class and outside the classroom. Real learning takes place when the user changes constraints and goals and sees the output. This is why I highly recommend that each user has a working solver on their computer and work along with the moderator.
I have had success explaining optimization using a few optimization scenarios in Excel. Excel is a great learning tool because while the number of people who can read scientific notation is scarce in planners, everyone can read formulas in a spreadsheet.
This makes me question the point of scientific notation, but I will save that tangent for a different post. Suffice it to say, people are comfortable with Excel, Excel has solvers that can be installed as add-ins (some of them free), so it is a great learning tool.
Secondly, since all users have Excel themselves, by merely walking the class through the installation of a solver on their machines, they can use the optimization scenario themselves in the class and outside the classroom as well. Real learning takes place when the user changes constraints and goals and sees the output. This is why I highly recommend that each user has a working solver on their computer and work along with the moderator.
Choosing a Solver
For this example, I am using the Frontline Solver for Excel. There are many solver plug-ins for Excel, and I happen to like this one because it works with Mac and PC. When using it, I found this particular plug-in very easy to use to recommend it, plus the basic version is free. Frontline offers a basic solver at no charge and sells a more advanced solver or pro version that they do cost around $900 for.
This Pro version can handle up to 2000 variables and a production-type solver. I tip my hat to Frontline to offer a free basic version, which allows a person to cut their teeth on optimization without committing to buying a product. It also allows an unlimited number of users to download a basic solver for teaching without placing an optimizer in the budget for short-term use.
A Sample Optimization Problem
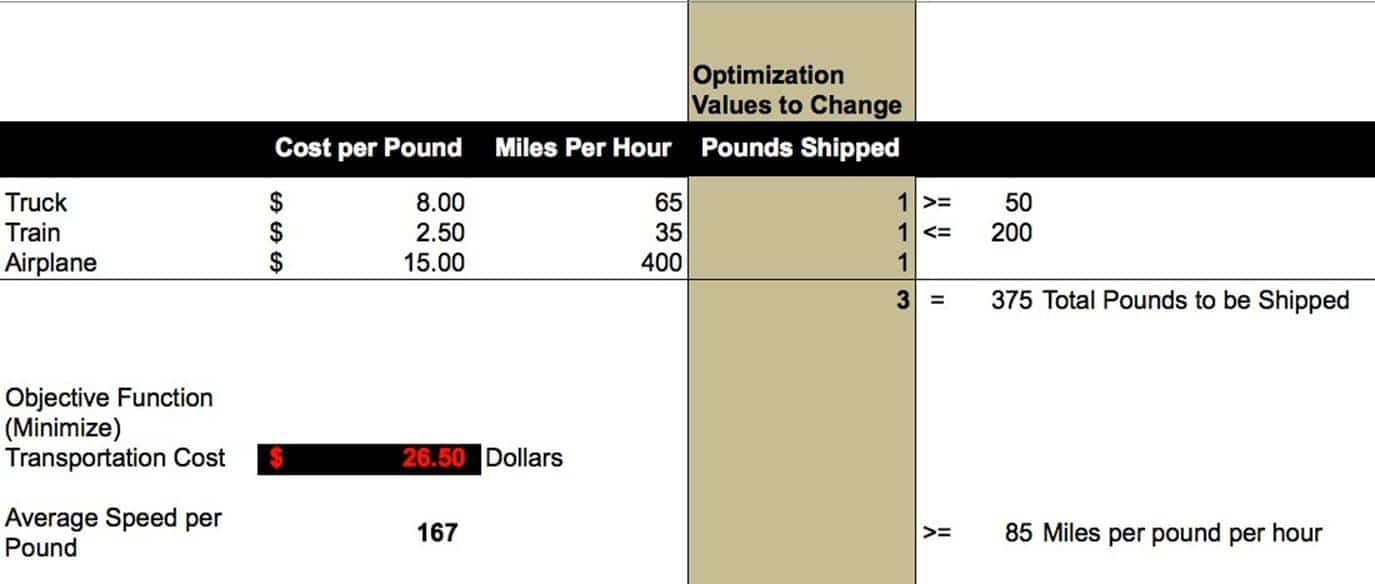
Below I have set up a simple optimization scenario. This scenario asks the solver to resolve the following problem.
- Minimize the transportation dollars spent on 375 pounds of material.
- Respect the constraints for the minimum number of pounds to be shipped by truck and the maximum number of pounds to be shipped by rail.
- Allocate material to the different modes (which move at different speeds) such that the average pound of material is moving at greater than or equal to 75 miles per hour.
Below is the initial view of the optimizer scenario. We start with the values that the optimizer will change. The pounds shipped are set to “1,” next, I will go through each of the values and describes how the optimizer will see each of them and use them to come to an optimal solution.
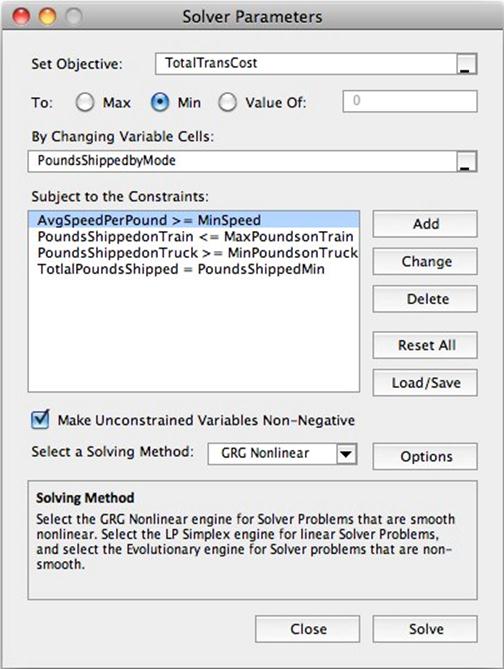
Next, we need to bring up the solver by selecting it from the Tools menu.

When the solver window comes up, we will set up the objective, the variables to be changed, and the constraints. I find it useful to name the cells so that the cell names show up in the Solver Parameters window. Having “TotalTransCost” in the window is far clearer than “C13.”
I want all of the screens to be as clear as possible to understand what is happening based on their business experience intuitively. Later, when we adjust parameters in the real model, I need complete clarity because, ultimately, the business user must provide the correct values for the parameters.
 Here is our result.
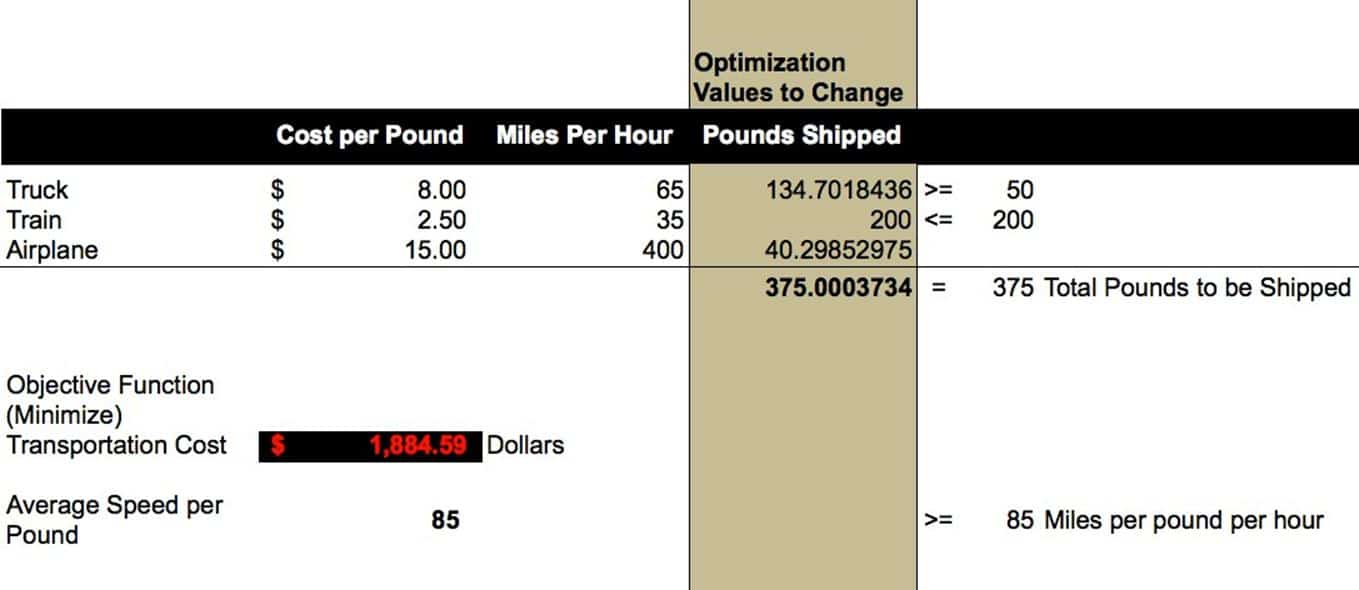
The users will quickly notice that the optimizer moved roughly 10 pounds from the truck mode to the plane mode to meet the constraint of a higher average speed per pound. The users will also note that this decision costs an extra 78 dollars (roughly).
Conclusion
Setting up optimization problems in spreadsheets for broad usage is a trend that I think is destined to increase in the future. A spreadsheet helps place the data and mathematics into a standard format that can be read broadly. It is then up to the individual to pick their solver. There are advantages to representing optimization problems in purely algebraic formulations and benefits to the representation of optimization problems in spreadsheet form. However, there is no reason research papers cannot have both, and this leaves the reader with a workable model by which to test the proposals in the paper more easily. However, if we do not correctly fund researchers and force them onto the market to obtain compensation, researchers will not be willing to share their inventions freely with the rest of us. That is why universities’ privatization, which promotes universities to patent rather than to share their research, is such a problem. The model not to follow is how pharmaceutical research is developed and shared. An encapsulated patent system provides monopoly control over inventions often paid for by the public into the hands of the large companies who then overcharge for access to the invention. Under the rubric, they somehow invented the intellectual property themselves.
Using Optimization
Whether using optimization with a spreadsheet for explaining how optimization works or doing so to validate solutions in enterprise optimizers, or even using optimization for things like dividing optimization runs into intelligent segments, using an optimizer with a spreadsheet is one of the simplest ways to access the power of optimization. However, to understand optimization spreadsheets and make effective and sustainable optimization spreadsheets, it makes sense to lay down some ground rules for the development. This is highlighted by the paper “Introduction to Optimization Using Excel Solver,”
One of the drawbacks of a spreadsheet is the lack of documentation….one of the formulas are used in the model are displayed. None of the constraints are visible..To aid in communicating the underlying ideas in a spreadsheet it is important to adopt good spreadsheet style.
The most thorough ground-rules I have seen laid down for this topic are in the excellent book “Optimization Modeling with Spreadsheets.” I have provided a brief synopsis of them below:
Modularity: We should try to reserve separate portions of the worksheet for decision variables, objective functions and constraints
Optimization has the same areas for each problem it solves. However, if we locate them in parts of the spreadsheet, it improves the spreadsheets’ following ability and makes them easier to understand and use.
In our basic model we should try to place all decision variables in adjacent cells of the spreadsheet. Most often we can display the variables in a single row, although in some cases the use of the rectangular array is more convenient.
The objective function should be a single cell (also highlighted), containing a SUMPRODUCT formula, although in some cases an alternative may be preferable. (The purposed of using the SUMPRODUCT function is that it adds pairwise products of corresponding number in two lists of the same length. The SUMPRODUCT function computes a quantity sometimes called an inner product or scalar product. First we pair elements from two arrays; then we sum their pairwise products.)
The repeated use of the SUMPRODUCT function makes Dr. Bakers’s optimization spreadsheets so easy to understand. SUMPRODUCT multiplies arranged values by each other between two arrays. The formula is given by SUMPRODUCT (Array1, Array2). However, SUMPRODUCT does not stop at two arrays but can calculate up many arrays. However, all arrays must have the same dimensions (that is, the number of rows and columns). SUMPRODUCT simplifies the many calculations that would be required to replace it. (SUMPRODUCT exists within Google Docs Spreadsheet as well)
The book explains why SUMPRODUCT is so important.
The reliance on the SUMPRODUCT function is a conscious design strategy. As mentioned earlier, the SUMPRODUCT function is intimately related to linearity. By using the function we can see structural similarities in many apparently different linear programs, and the recognition of this similarity is key to our understanding.
We should arrange our constraints so we can visually compare the LHS’s (Left Hand Side – a function of the decision variables) and RHS’s (Right Hand Side – the number the LHS must be larger, smaller or equal to) of each constraint, relying upon the SUMPRODUCT formula to express the LHS, or in some cases the SUM Formula.
Dr. Baker follows this convention throughout his book, and it’s beneficial. With each spreadsheet, you know what to expect and where things are. This is not to say that every sheet is identical. Because different problems require different setups, some sheets are quite big while others are small. However, the overall format remains consistent.
Ideas For Improvement
While Dr. Baker’s spreadsheets are easy to follow, I have found a few things that I think can be improved. The changes do not move any cells, so the overall structure remains the same. However, I have added two basic things:
- Color Coding: A white spreadsheet does not differentiate the areas, as well as colors, do
- Range Naming: Dr. Baker’s approach means using repeated SUMPRODUCT formulas. However, the formulas are difficult to read because they point to combinations of cell names. While the ranges light up when the formula is selected, it’s easier to understand if the ranges are named.
- Name the Objective Function Cell
- Centering: I am not sure why, but when numbers are centered, they are easier to read. This is a seemingly minor change, but it does help the readability of the sheet.
I am increasingly relying upon the Formula Builder in Excel rather than type changes into the formula bar. See below:

A screenshot sample of a spreadsheet adjusted in this is shown below.

As soon as I made these changes, I found the spreadsheet easier to follow. The colors are arbitrary. They can be changed to whatever colors are appealing to the user. However, the distinction between the different colors helps organize the sheet for the user.
The spreadsheet areas that represent the different portions of the problem must change depending upon the issue. However, colors help keep the areas straight even as the organization of the spreadsheet changes.
Now with clear to read SUMPRODUCT formulas due to naming, I can describe the optimizer above as the following in plain English terms:
Maximize the profits as defined by the earnings per each produced item (Chair, Desk, Table)
Subject to the following:
The Fabrication, Assembly, Machining, and Wood inputs being below each of their respective Right Hand Side variables.
The comment made by the paper “Introduction to Optimization Using Excel Solver” on the lack of documentation inherent in spreadsheets is partially true. However, there is nothing to stop the designer from adding a new tab in the spreadsheet called “Documentation,” where the optimizer logic can be written in plain English, as I have above.

I think this is another factor that can help improve the understandability of optimization spreadsheets. If multiple optimization tabs are in one workbook, the optimization tab and documentation tabs can be colored the same so that it is clear which documentation sheet goes to which optimization problem.
However, in addition to a Documentation sheet, I also found that adding full descriptions of each row to the row’s right can also be very helpful. I have zoomed into this section on a different spreadsheet from “Optimization Modeling with Spreadsheets” to show what I mean.

When I went through all the optimization spreadsheets and marked them this way, I found it easier to understand them immediately. In an earlier iteration, I had just the rows described. However, I realized that declaring the objective function with a bolded red “Subject to” was more explanatory. I got to several spreadsheets I had used in the past. When I attempted to do this, I found I could not immediately do so, which means that I had solved the spreadsheet without exactly knowing what everything in the spreadsheet represented, never a good thing, of course. Documenting a large number of spreadsheets in this way demonstrates a point made by Dr. Bakers that many optimization problems have similar underlying solving structures. One of the major steps in developing an optimization approach is categorizing the problem—major problem categories, including blending, segmentation, network flow, etc..
While optimization spreadsheets tend not to be documented, I don’t think that has to be the case. These two changes (more detailed descriptions of what each row is and a separate “Documentation” sheet in the workbook), combined with the naming of cells and ranges, can move the spreadsheet into a better category in terms of documentation.
SUMPRODUCT Formula / Function
As discussed earlier, the SUMPRODUCT formula is the most critical formula used in the method proposed by Dr. Baker. A simplified explanation of how the SUMPRODUCT formula is used is listed below. I wanted to list this because, as I worked with each of Dr. Baker’s spreadsheets, I began to notice similarities in the use of the SUMPRODUCT formula.
- The Objective Function SUMPRODUCT: Use SUMPRODUCT to multiply the activity array by the cost array. This is the objective function cell. This cell is then minimized or maximized in the optimizer. (SUMPRODUCT formulas are not always directly placed in the objective function cell. Sometimes the objective function is a sum of several other SUMPRODUCT formulas. However, the objective function is always pointing in one way or another to a SUMPRODUCT formula.)
- The Constraint SUMPRODUCT: Use SUMPRODUCT to multiply each array of constraints per selection for the activity, which is to be performed (which moves the problem towards the optimal objective function but also consumes the constrained capacity). These SUMPRODUCT formulas then keep the activity below each constraint.
While there can be many SUMPRODUCT formulas used, there are only two “categories” of SUMPRODUCT formulas (Constraint SUMPRODUCT and the Objective Function SUMPRODUCT). Within the constraint, SUMPRODUCT formulas can be a wide variety of constraints. The constraints themselves can be classified. The individual activities can be constrained, but this can also be combined with a constraint total for all the activities (so activity A + B + C must all be less than a certain amount). These constraints control the optimizer from a variety of “angles.” In most of the book’s spreadsheets, the most interesting things are happening with limitations rather than the objective function. (In fact, this is consistent with the fact that the objective function to set is typically straightforward, that is, one intuitively knows what they are attempting to minimize or maximize.)
In many cases, the constraints are listed as ones and zeros, but they are multiplied by the decision variables. This turns on or turns off the decision variable for that constraint. This is shown in the screenshot below:

The Problem with Cost Optimizers Historically
Cost optimization is a way of performing supply chain planning in commercial off-the-shelf software for supply and production planning to become popular back in roughly the mid-1990s. At the time, it was assumed that using a cost optimizer was simply a better way to perform planning. It was also generally believed that it would eventually take over the other methods. This did not happen, and clients ran into many issues, which prevented the broad-scale use of optimizers, not the least of the decision-making process for cost determination. (I have an extensive article on this topic here). Bear in mind; this is the short version of events. There is a much longer and involved story, part of which I have documented here.
Understanding the history of cost optimization is vital to keep from repeating the same mistakes made in the past, errors that continue to negatively impact optimization projects in all the supply chain planning domains. Understanding the decision-making process of those that have attempted optimization in the past improves the future decision-making process. Having to research this area for a book provided me with insight into this client’s concerns. It led me to consider how often cost optimization projects have run into problems because the business did not thoroughly explain how to develop costs. This is to some degree because they did not understand how the optimizer dealt with costs.
Replicating the Optimizer to Improve Project Understanding
This led to an interest to at least partially replicate the SAP SNP optimizer with a general optimization tool such as MatLab, Oracle Crystal Ball (with their respective optimization plug-ins). This approach would allow me to show people how the optimizer works with a small data set for basic cost estimation. And can even be used for other simulation purposes, such as supply network redesign (i.e., what happens if specific transportation lanes are allowed). This is important because all of SAP’s products are difficult to troubleshoot, and SAP has made them time-consuming to configure. In my view, SAP should be configured after a prototype has been run in a smaller and easier manipulate system.
The Work Effort and Costs Involved
A company would have to develop a decision-making process for how much they would want to invest in this work. External modeling can range from simple, for instance, just showing relative costs in a spreadsheet to the quiet involved, using a heavy-duty external optimization environment with many parts of the supply network modeled. However, any point a company picks along the continuum that I have laid out improves the likelihood of success of the optimization project. Every aspect somehow improves or holds the potential to enhance the socialization of the solution. I presented this idea at one session, and one concern voiced was how the optimizer could replicate what is inside SAP. Firstly, it should be remembered that SAP itself uses an off-the-shelf optimizer. The engine the SNP Optimizer uses is CPLEX, which is available to anyone to buy. CPLEX integrates with MatLab with a product called TomLab. CPLEX is quite flexible in this regard. ILOG, a niche player, created CPLEX, but when IBM purchased ILOG, they obtained CPLEX. No doubt this caused the price to go up and to have a deal with an arm twisting IBM salespeople to access the application. This, of course, makes the decision-making process for using CPLEX less of an easy decision myself. I don’t want to deal with the IBM salesman myself. However, if just the software can be purchased from IBM, and an independent consultant who understands CPLEX and has years of experience using it. Then one would not have to interact with IBM or have to deal with IBM’s Global Consulting Services.
However, MatLab has its optimizer plug-in, and the optimization mathematics for the various optimizations in different supply chain spheres is in the public domain. It added the optimizer mathematics, but this work was most likely taken from published papers with a few tweaks based upon some clients’ needs. I have reviewed many optimization papers, both in cost and inventory optimization, and there is a high similarity between the mathematics employed for each supply chain domain.
The Benefit of This Approach
I believe there are problematic cost optimization projects worldwide that could be improved by following this approach. The issue, of course, is that it would take time and cost more at the beginning of the project in particular, and many clients probably won’t have the patience for this approach. Few consultants tell them why such an approach would be necessary to seem an unnecessary expense for many. (More details on understanding the difference between enterprise optimizers and general solvers can be seen at the link.)
Conclusion
The guidelines proposed by Dr. Baker appear to be catching on as a PDF titled and “Introduction to Optimization Using Excel Solver” from the University of Lancaster follows the exact approach as outlined in the book “Optimization Modeling with Spreadsheets.” After going through many of Dr. Baker’s spreadsheets, I think there are a few ways to make the approach even more clear. All of this is excellent news for people trying to create understandable optimization models in spreadsheets.
References
“Optimization Modeling with Spreadsheets,” Kenneth Baker, Wiley, 2011
https://www.meiss.com/download/Spreadsheet-Optimization-Solver.pdf
https://www.stanford.edu/~ashishg/msande111/notes/excel_solver.pdf
“Spreadsheet Modeling & Decision Analysis: A Practical Introduction to Management Science, 6th Edition,” Cliff Ragsdale, South-Western, 2010
“Production and Inventory Control: Techniques and Principles 2nd Edition,” George Plossl, Prentice Hall, 1985
“The Future of Everything: The Science of Prediction,” Dr. David Orrell, Basic Books, 2006
https://en.wikipedia.org/wiki/Minimax
“Optimization Modeling and Spreadsheets,” Kenneth R. Baker, Wiley, 2011
https://www.excelhero.com/blog/2010/01/the-venerable-sumproduct.html
The next point is that this simple example had just three columns (arrays). The SUMPRODUCT function is just as happy with 1 array or up to 30 arrays, each separated by a comma. Thirty is the maximum number of arguments that Microsoft Excel functions can support.
One way that it shines is calculating sums, counts, averages, and other metrics of list data based on criteria. The result here is basically analogous to a SQL database query that produces a total with a WHERE clause.
SELECT SUM(OrderPrice) FROM Orders WHERE Customer=’Hansen’
could be emulated in Excel with any one of these SUMPRODUCT formulas:
=SUMPRODUCT((OrderPrice)*(Customer=”Hansen”))=SUMPRODUCT((OrderPrice),1*(Customer=”Hansen”))
=SUMPRODUCT((OrderPrice),(Customer=”Hansen”)*1)
=SUMPRODUCT((OrderPrice),(Customer=”Hansen”)+0)
Interestingly, these examples could have greatly benefited from being included in a spreadsheet. Without this, the reader has to recreate the spreadsheet or another spreadsheet to test it and, therefore, to learn how to use it. It is far more effective to show someone to do something than to tell them simply. This is the same problem with academic papers that discuss in great detail how the approach works. But then simply provide an algebraic formula at the end of the paper, which the vast majority of people reading the paper will never use, and never be able to verify, adjust, add to, etc. Here it is difficult to tell how the spreadsheet will select “Hansen” from the Customer array. The ability to show is one reason the video is such an effective teaching tool (Many videos on SUMPRODUCT are at https://www.youtube.com/results?search_query=sumproduct&aq=f).
https://www.keynotesupport.com/excel-functions.shtml
Up to 255 arrays may be included, and all arrays must have the same dimension (same number of rows and columns) or Excel will return a #VALUE! error. An array is a contiguous block of cells, referenced by its beginning (upper left) and ending (lower right) cell names.
https://www.google.com/support/forum/p/Google%20Docs/thread?tid=33320b9bdda0bc29&hl=en