
A Machine Learning Study of Gartner’s Magic Quadrant Bias
Executive Summary
- Gartner proposes it has no bias, and their massive revenues from vendors do not impact their Magic Quadrant ratings.
- We performed a machine learning study to see if Gartner is correct.
Video Introduction: A Machine Learning Study of Gartner’s Magic Quadrant Bias
Text Introduction (Skip if You Watched the Video)
In 2006, InformationWeek wrote an article titled The Credibility of Analysts. In this article, IW brought up a fascinating point about Gartner and the overall analyst community.
“Research firm executives are well aware of the questions being raised about their business models, but don’t expect changes to be fast or wide-sweeping. The financial stakes are too high — and the incentives for change aren’t compelling enough.”
This brings up a well-known idea about Gartner and how nearly all the IT analysts rate software and software vendors and the fact that all of them go to software companies for funding. You will learn about the reality of how IT analysts like Gartner work.
Our References for This Article
If you want to see our references for this article and other related Brightwork articles, see this link.
Notice of Lack of Financial Bias: You are reading one of the only independent sources on Gartner. If you look at the information software vendors or consulting firms provide about Gartner, it is exclusively about using Gartner to help them sell software or consulting services. None of these sources care that Gartner is a faux research entity that makes up its findings and has massive financial conflicts. The IT industry is generally petrified of Gartner and only publishes complementary information about them. The article below is very different.
- First, it is published by a research entity, not an unreliable software vendor or consulting firm that has no idea what research is.
- Second, no one paid for this article to be written, and it is not pretending to inform you while being rigged to sell you software or consulting services as a vendor or consulting firm that shares their ranking in some Gartner report. Unlike nearly every other article you will find from Google on this topic, it has had no input from any company's marketing or sales department.
A Study Based Upon Collaboration
This study has two authors. One is Markian Jaworsky, who performed the statistical analysis that you will read in this study and was the one to initially proposing performing such an investigation.
The second author is Shaun Snapp, who has been researching Gartner for several years and has previously published that Gartner’s Magic Quadrants are influenced by vendor income and the book Gartner and the Magic Quadrant: A Guide for Buyers, Vendors, and Investors.
The Machine Learning Methods Used in the Study
This study will repeatedly refer to two Machine Learning methods. One is called K-Means, and the second is called spectral clustering.
We will now show the clustering analysis examples of the Magic Quadrants.
And the Winner of the Gartner Magic Quadrant is… La La Land?
The Academy of Motion Picture Arts and Sciences annually presents awards for artistic and technical merit in a ceremony popularly referred to as the Oscars. This ceremony has run annually for the past 92 years. In 2017, the accounting firm in charge of counting votes and printing the award winners’ envelopes, PwC, was forced to issue an apology after the winner of the “Best Picture” was incorrectly announced as “La La Land” when the correct winner was supposed to have been announced as “Moonlight.”
The PwC investigation revealed that the Best Picture Award presenters Faye Dunaway and Warren Beatty were provided with the wrong award-winning envelope. They had received a duplicate of the Best Actress award, which was already announced for the movie “La La Land.” Not understanding this error, Faye and Warren did their best to interpret the results, but despite their best efforts, announced on live television the incorrect winner of the 2017 Best Picture award.
In another industry, “Information Technology, Finance, and Corporate functions,” operates research and advisory firm Gartner, Inc. Like the Oscars, Gartner, Inc. publishes the annual “Magic Quadrants” for different enterprise software categories. These awards classify vendors into four ordinal categories.
Gartner, Inc. (2019) explains their four class rankings of vendors in their methodology explanation titled “How does a Gartner Magic Quadrant Work?”
The order is illustrated in the following sequence.
- “Leaders”
- “Visionaries”
- “Niche Players”
- “Challengers”
Gartner, Inc. 2019, Gartner’s Magic Quadrant Methodology page provides its description.
In addition to the text descriptions, the Magic Quadrant scatter plot diagrams place vendors into X, and Y-axis coordinates based on their points scored for “Ability to Execute” on the Y-Axis and “Completeness of Vision” on the X-Axis. Arrows are pointing upward on the Y-Axis and to the right on the X-Axis.
How Charts Can Lie
Alberto Cairo Ph.D. (2019) published “How Charts Lie – Getting Smarter about Visual Information,” and in his prologue, Alberto professes, “A picture is worth a thousand words.
If you know how to read it”.
Digital imaging pixel coordinates to place the lowest X and Y-axis coordinate values in the top left of an image. If we are to Interpret the Magic Quadrants on this basis, the “Challengers” quadrant is correctly ordered as the lowest ranking quadrant on Gartner’s methodology explanation.
However, if we consistently use pixel coordinate values, that would imply that the “Leaders” quadrant would rank lower than “Challengers.” That doesn’t work.
Let us assume that the X and Y-axis run left to right and bottom to top respectively to score the metrics “Ability to Execute” and “Completeness of Vision” as per the direction of the arrows on Gartner’s methodology page. And as the magic quadrants have a square shape, let us assume that “Ability to Execute” and “Completeness of Vision” are weighted equally.
Take Me to La La Land
If there is no bias between a vendor‘s “Ability to Execute” and “Completeness of Vision,” the group of vendors with the highest sums of the X and Y axis placings should then be declared “Leaders.”
Wrong.
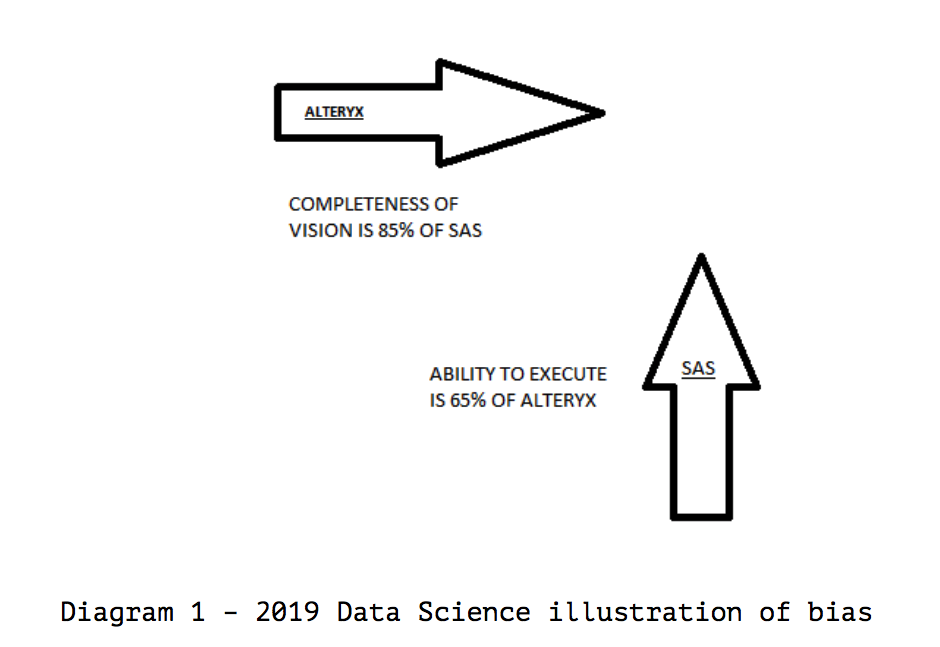
Examine the 2019 Magic Quadrant for Data Science to illustrate. In this example, we have the following unexplainable result.
- Vendor SAS’s “Ability to Execute” is only 65 percent of the vendor Alteryx.
- Conversely, vendor Alteryx’s “Completeness of Vision” is 85 percent of SAS. The result indicates that vendor SAS is a leader, but vendor Alteryx is a “Challenger.”
To explain this outcome, there has been an undeclared bias toward vendors who score higher in “Completeness of Vision” instead of “Ability to Execute,” or we all just experienced another Oscars La La Land moment. Let us examine further;
Clustering Analysis of the 2019 Gartner Data Science Magic Quadrant
We have taken the pixel values of the 2019 Gartner Data Science Magic Quadrant (as published in Nov 2018) and plotted them onto a new canvas.
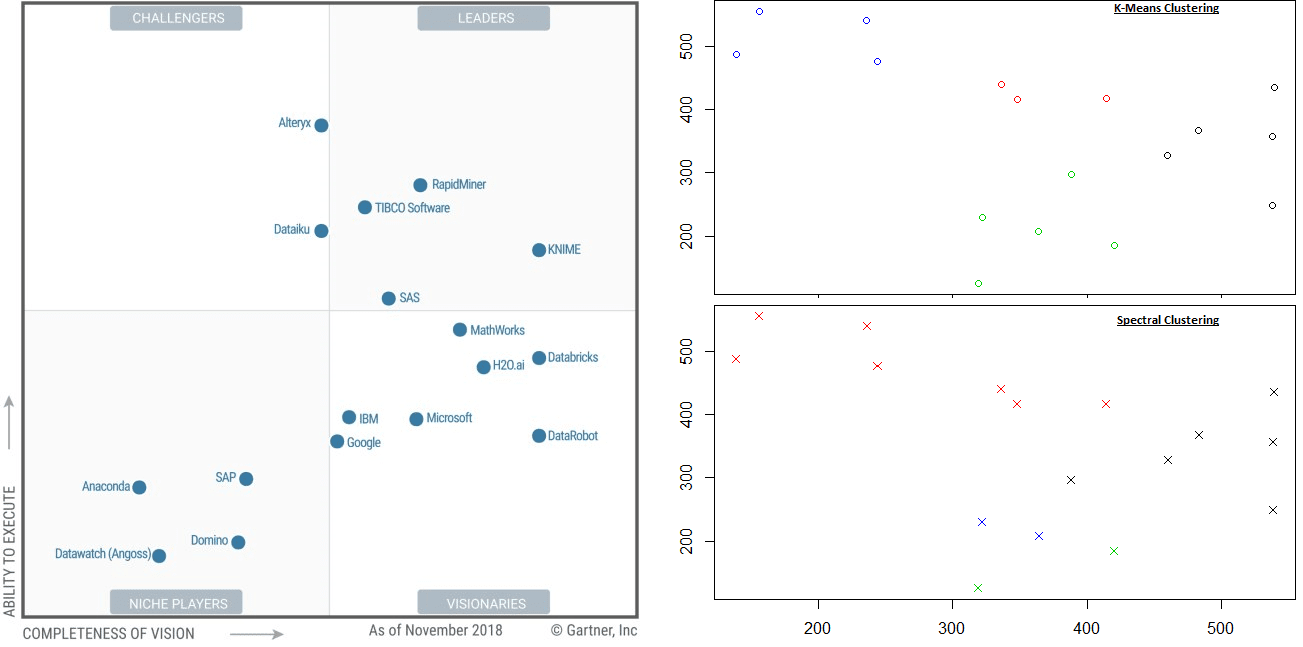
One could decide to focus on many areas, but we show graphically some of the essential features we focused on in this MQ.
We have then used 2 data science clustering algorithms to classify the results. Using the standard clustering algorithms of K-Means and Spectral clustering, the results show 4 clusters. However, neither result supports Gartner’s classification of “Leader” status.
Alteryx is a clear leader in both cases with clustering, but not according to the Magic Quadrant.
There is no table with the numerical values, and we have to “guess” what the underlying numbers are is ridiculous, and papers that are published as research aren’t allowed to leave out the numbers.
Graphics are supposed to be a guide for readers. They are not supposed to eliminate the need to provide the underlying data. However, most Gartner customers and readers don’t usually read the research and consider that there are standards that must be applied for something to be called research. Therefore, this does not bother them. And this is just the beginning of the problems with Gartner’s research output.
Not Matching Even the Bottom of the Barrel of Academic Research: Medical Research
For example, another problematic item is that any paper that rates items and is paid by the rated entities is considered a massive conflict of interest. This only is deemed standard in medical research, which is now so corrupted by industry sources that its results are unreliable. Pharmaceutical companies or medical device manufacturers may pay MDs working at universities $2 M per year and still get their “research” published in medical research journals without even a second glance by the editors as long as the conflicts are declared. This allows medical devices and pharmaceuticals that do not work as advertised to get accepted into the medical system.
In medical research, medical researchers routinely receive speaking fees, consulting fees, and so from the same entities on which they publish papers. As long as the fees are declared, the research is considered ethical.
However, Gartner does not even declare which vendors pay them and how much they are paid. This is true though they are required to report on their financial statements that around 1/3 of their income comes from vendors, which we cover in the article The Problem with How Gartner Makes its Money. This means that the only reason we know this is that a public company must publish this information. If Gartner were a private company, no one would even know this much.
It also means that Gartner does not rise to the most corrupt category of research in academics, which is medical research. We cover how Gartner compares to real research entities in the article How Gartner Research to Compares Real Research Entities.
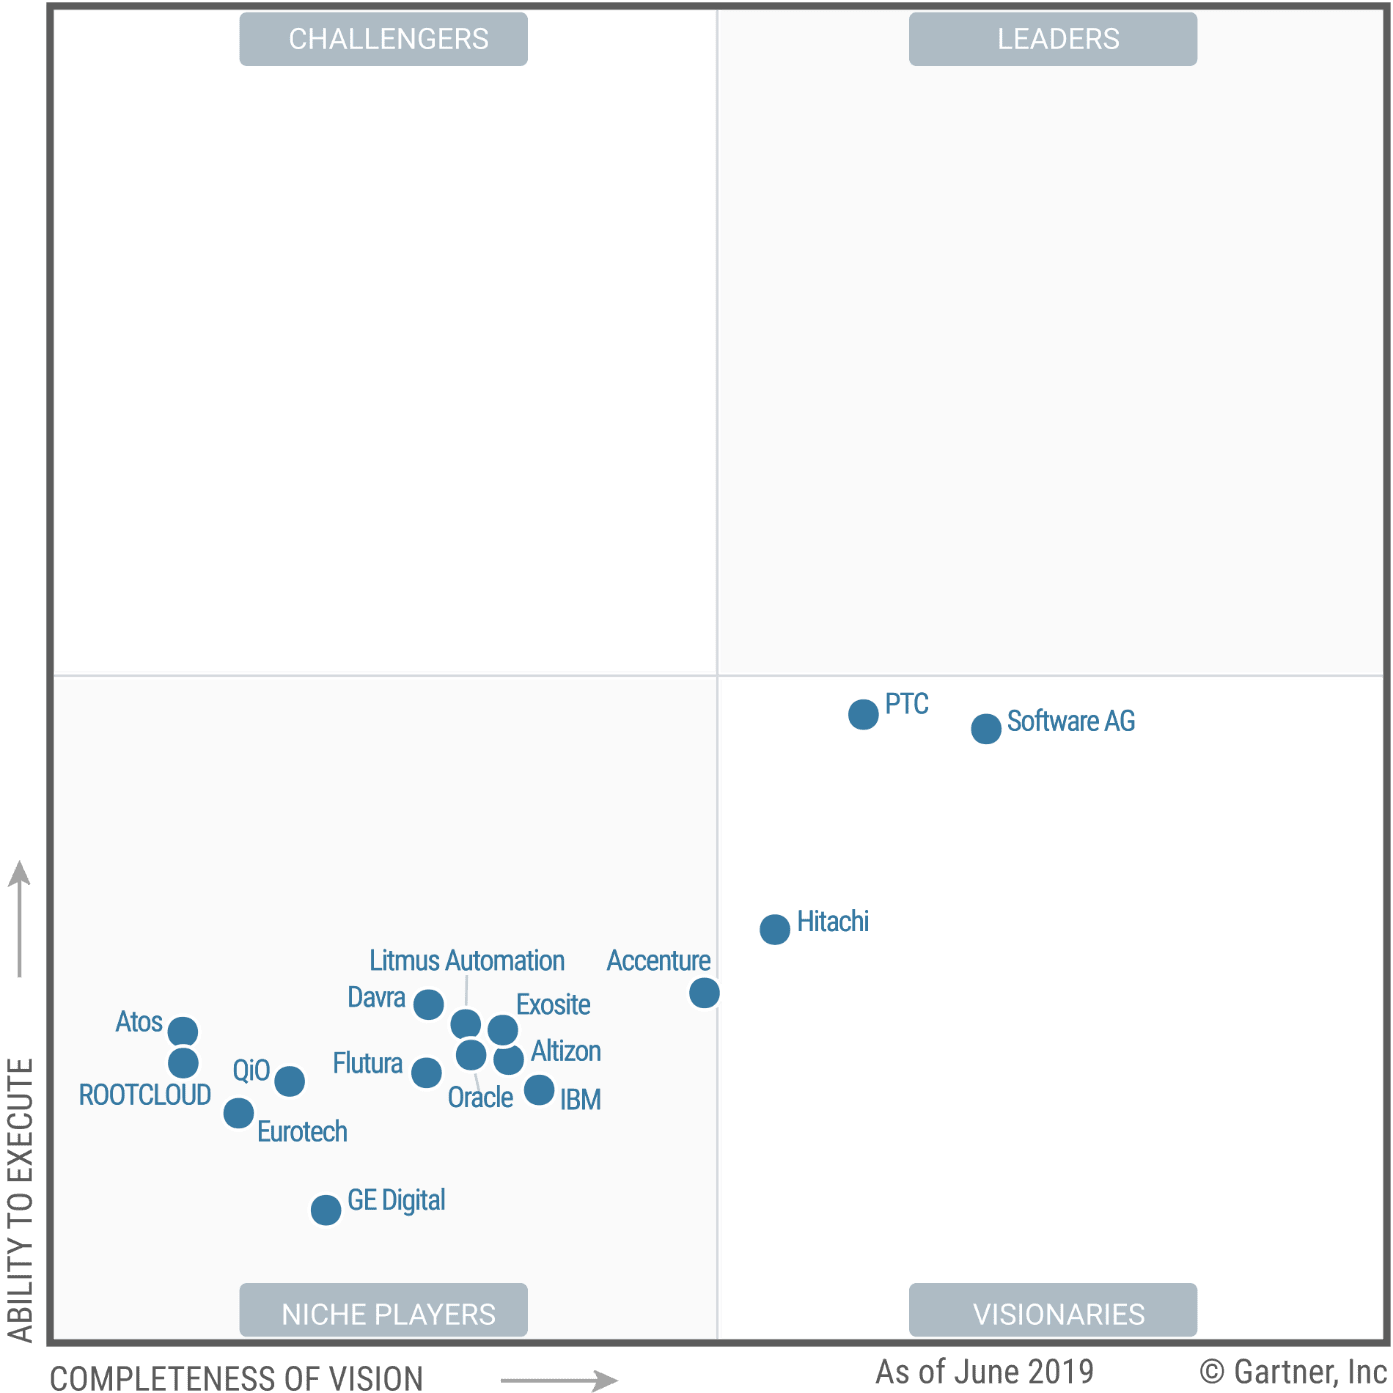
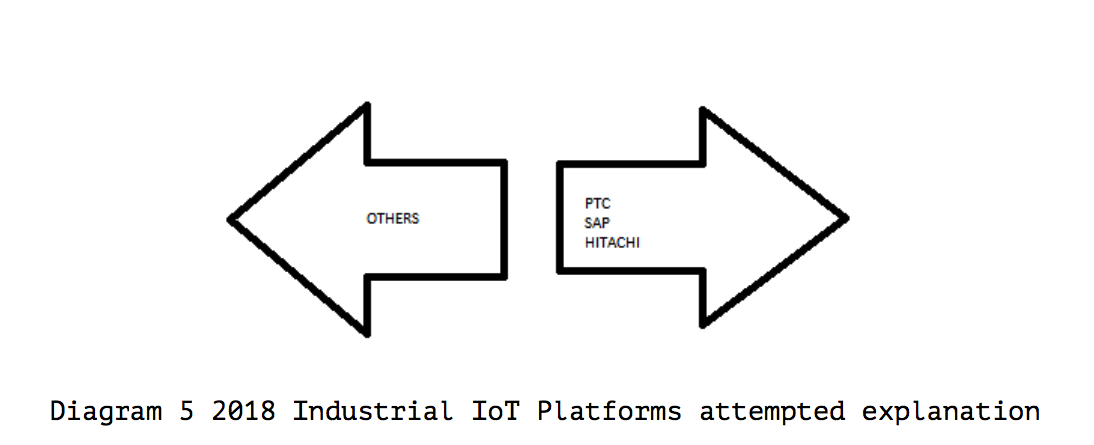
Clustering Analysis of the 2019 Gartner Industrial IoT Platform Magic Quadrant
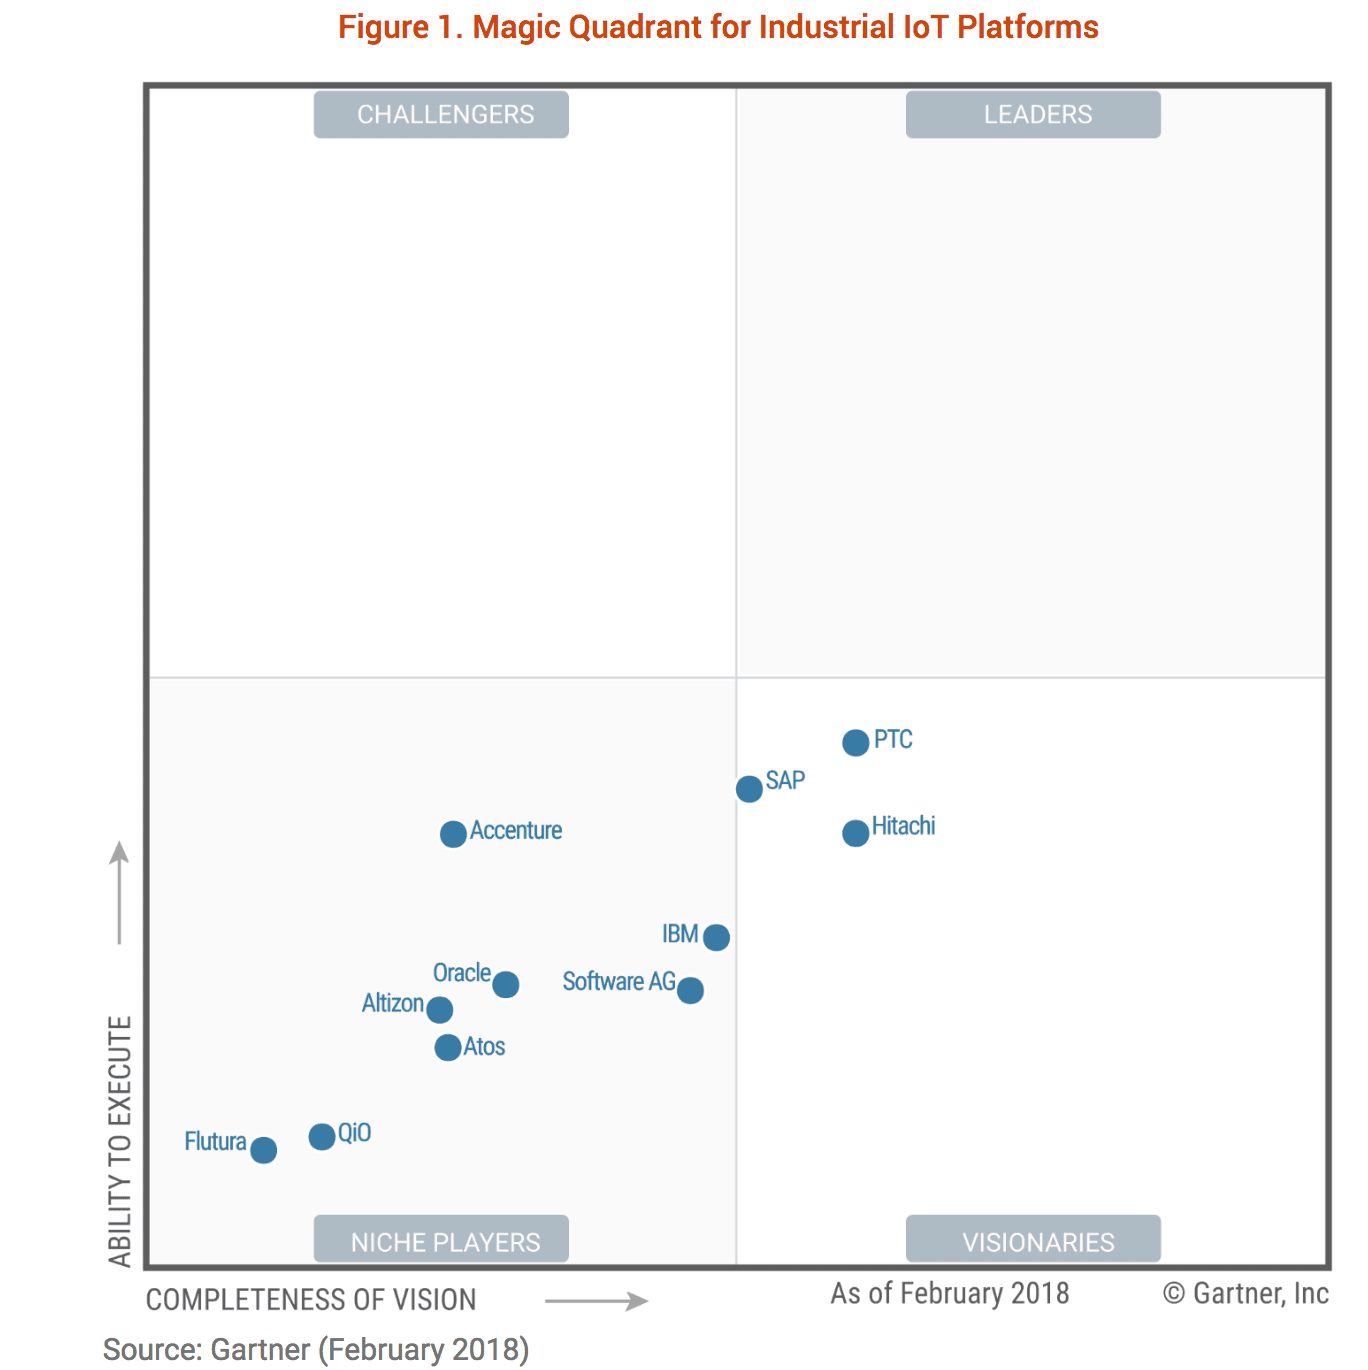
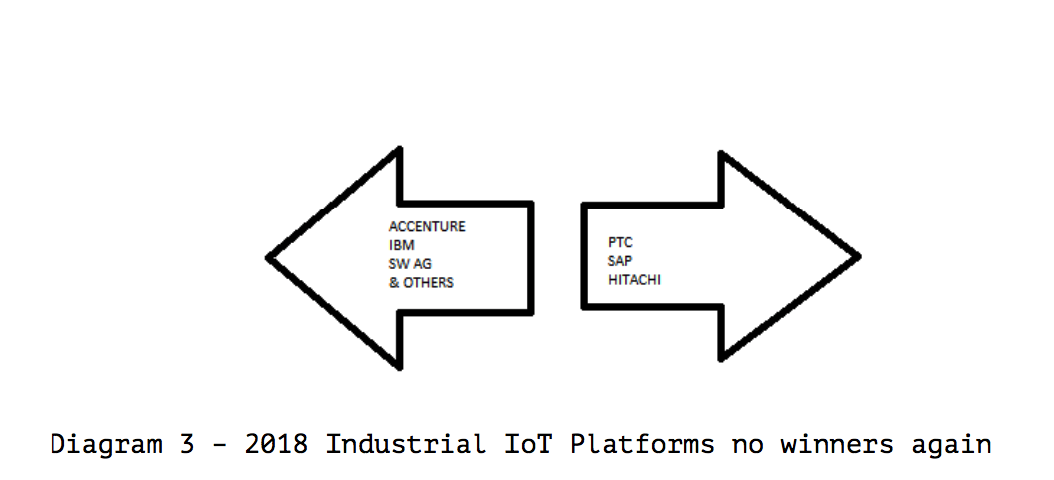
The 2019 Magic Quadrant for Industrial IoT Platforms places three vendors, Software AG, PTC, and Hitachi, in the “Visionaries” corner based on high “Completeness of Vision” results, but not in the “Leaders” corner, due to low “Ability to Execute” results.
No one was classified as a “Leader” for Industrial IoT Platforms.
The IoT Magic Quadrant points to different leaders than does clustering.
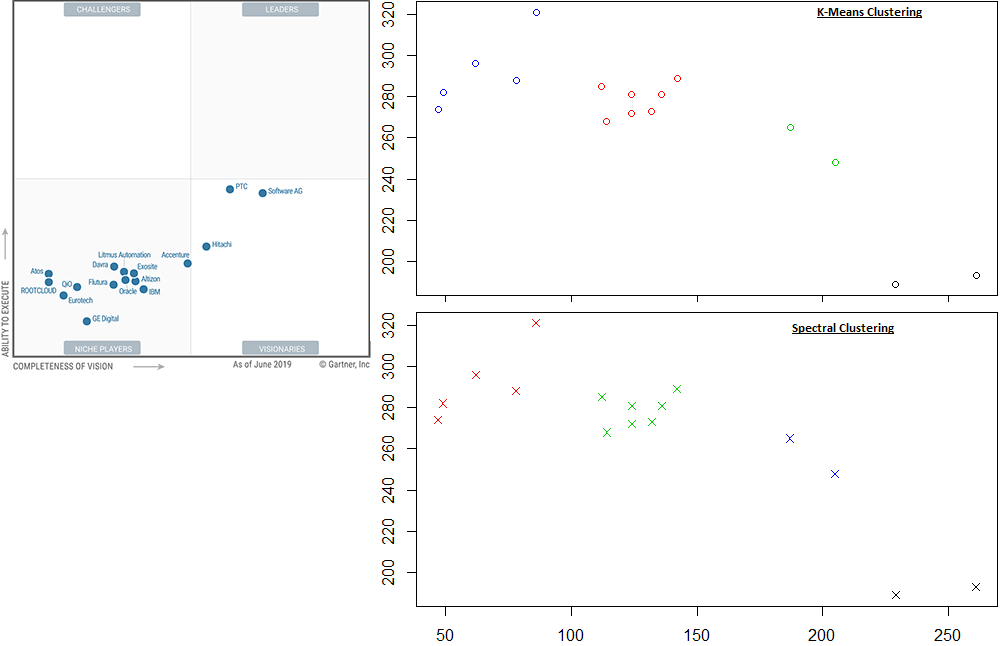
Again, let us review interesting aspects of this MQ graphically.
A simple explanation of Spectral Clustering with reference: (William Fleshman, 2019) explains the concept of Spectral Clustering (this is an excellent primer on clustering); https://towardsdatascience.com/spectral-clustering-aba2640c0d5b
“Spectral clustering is a flexible approach for finding clusters when your data doesn’t meet the requirements of other common algorithms.”
Using Spectral clustering, a more advanced Machine Learning algorithm than K-Means clustering, rather than searching for a predetermined number of clusters, the algorithm will tell us how many clusters should exist. Interestingly that even though Gartner has decided to draw a boundary over the top of all IoT vendors so that no vendor is classified as a “Leader” or “Challenger,” Spectral Clustering contradicts this outcome, illustrating there do exist 4 clusters.
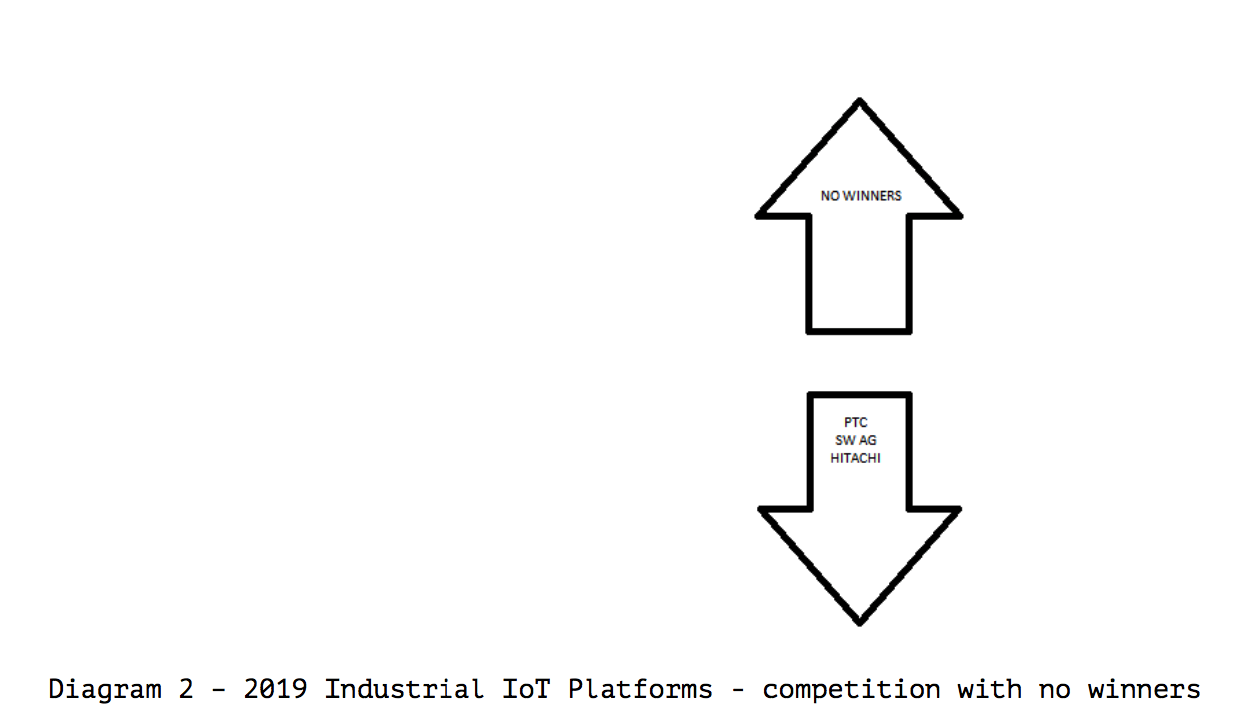
Diagram 2 illustrates the vendors are not entirely rated against one another, but an unstated standard applied by Gartner.
If Gartner is trying to propose that the IoT market is immature, which is undoubtedly true, this would seem to be better to declare that fact, but then order the vendors in a relative way such that some of the vendors do end up in the Leaders Quadrant.
Also, are all of the vendors that pay Gartner included?
Notice the curious observations from this MQ.
We dispute this research conclusion by Gartner.
Let us look at SAP’s positioning in this MQ.
In 2018, SAP had an excellent vision for IoT, however a zero ability to execute this vision. Yet, Gartner rates SAP (a significant funder of Gartner) as a bit below average in their ability to execute and only average in their vision. Let us move SAP to where we would have placed them on these two criteria.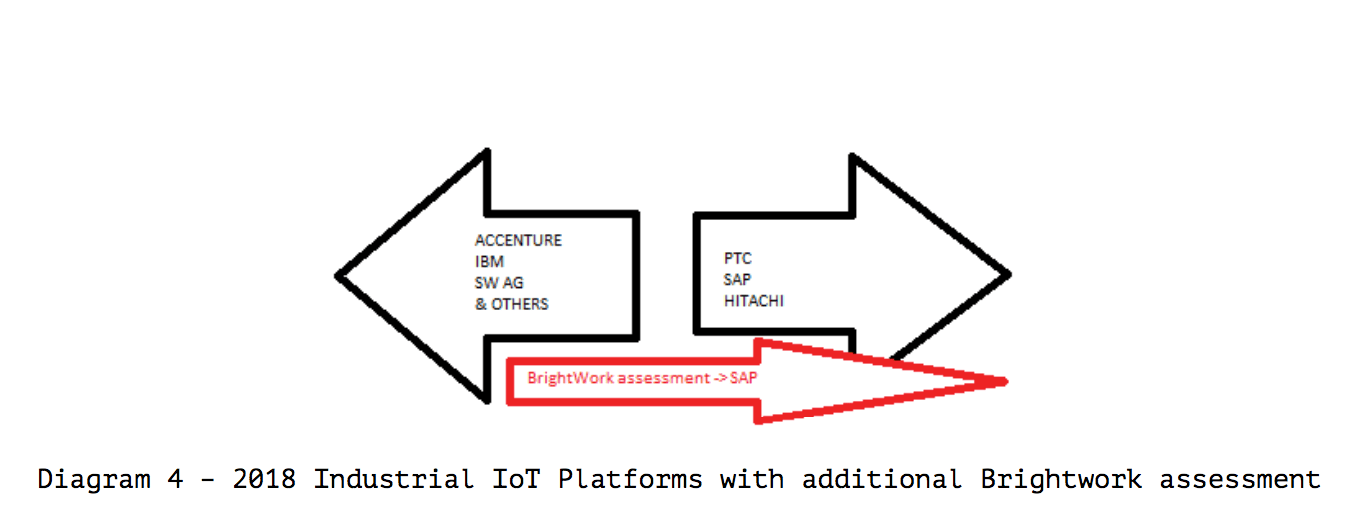 What happens if the software vendor can’t execute at all, primarily because they don’t have a functioning solution? (SAP’s Leonardo was mostly a few tools that would allow for a customer to worse off than choosing free open source tools to be a customization project)
Hypothetically even without being able to execute, a vendor should still score in the Visionary Quadrant because of one axis only about the completeness of their vision. This by itself is a peculiar metric as it does not discuss any or measure any specific functionality. It is as abstracted and subjective a metric as one could conceive of.
In Feb of 2019, Brightwork Research & Analysis officially declared that SAP’s IoT solution called Leonardo was dead, as is covered in the article Our 2019 Observation: SAP Leonardo is Now Dead. Once heralded as the technology that allowed SAP to keep ice cream from melting (see How Accurate Was SAP in Saying it is Leonardo that Ensures Frozen Ice Cream Delivery?). Still, in early 2019, SAP had pushed Leonardo into the background of their marketing efforts.
This brings up the following questions.
- Why did Gartner rate SAP as having a high ability to execute what was defunct, or should we say nothing more than an inflexible development environment rather than a packaged solution?
- Does Gartner think that because SAP is a large vendor that it has a high ability to execute?
- Is this true even if the solution is non-existent?
- Does Gartner rate vendors’ ability to execute an older solution, like SAP ECC (SAP’s decades-old and widely implemented ERP system), the same or similar to a new and non-existent solution simply because the same vendor offers them?
- What if a vendor is small (as most of the real IoT vendors are), and they have a bona fide solution but are small in scale. Well, according to the measurements put in place, Gartner would lower that vendors’ ability to execute because a significant component of the “ability to execute” according to Gartner is the size of the vendor – which of course, and not coincidentally, dovetails with the ability of the vendor to pay Gartner. This pushes up every large vendor in their ability to execute, even if their real ability to execute is, in fact, lower.
Let us review Gartner’s 2019 Iot MQ.
Notice the area of this MQ we are focusing on below.
Where is SAP in this 2019 IoT MQ?
How did SAP move from being above average in 2018 to not even being in the MQ in 2019? SAP still paid Gartner (we estimate) over $100 million in 2019, yet their IoT is dropped out of the rankings altogether. Did Gartner read our article in Feb of 2019, or did it merely conclude that it was damaging to its credibility to include SAP? We did not perform a mathematical analysis of MQs across years, but this is another problem, where Gartner declares the right to include and remove vendors from the MQ entirely. And this is even true for vendors that it ranks as having a solid solution one year, not in the MQ the next year. This happened to the vendor Software AG as well. Where did Software AG go in 2019?
Apparently, like Leonardo, their IoT solution evaporated. Or perhaps their check went through in 2018 but then bounced in 2019. When a vendor disappears from an MQ, there is no explanation provided. However, one cannot simply ignore the changes in the MQs between the years. If Gartner has a valid research-based approach to creating the MQs, there should not be such significant discrepancies in the MQs from year to year.
Imagine a comparison of drugs, and in one year, 11 drugs are included, and in the next year, 16 drugs are included. However, many of the previous year’s drugs are missing, even though they are still in the market and considered non-marginal products. What would we think of the entity putting itself forward as primarily a rating agency for these drugs?
Just this single question, before one delved into the drugs’ ratings in any one year, could be a significant cause for concern.
In one year, Gartner shows eleven vendors worth placing in their MQ, then in the next year, sixteen vendors are worth putting in the MQ, and several of the vendors in the 2018 MQ are not in the 2019 MQ.
Again, SAP has an excellent vision for IoT; they don’t have anything to do with IoT and don’t have any ability to execute. They never had a real packaged solution but should still be placed very high in Gartner’s Visionary quadrant. The issue is that while we called out SAP’s IoT (Leonardo) as fake in May of 2019 in the article Why Leonardo Seems so Fake.
It took Gartner several years to figure it out. Yet companies that followed Gartner’s 2018 rating would have been surprised to read the 2019 rating, where SAP no longer had an IoT solution.
Clustering Analysis of the 2019 Gartner BI and Analytics Magic Quadrant
K-Means clustering finds the leader cluster to be just Tableau and Microsoft, and Spectral clustering says Tableau, Microsoft, Qlik, Sisense, ThoughtSpot, and SalesForce.
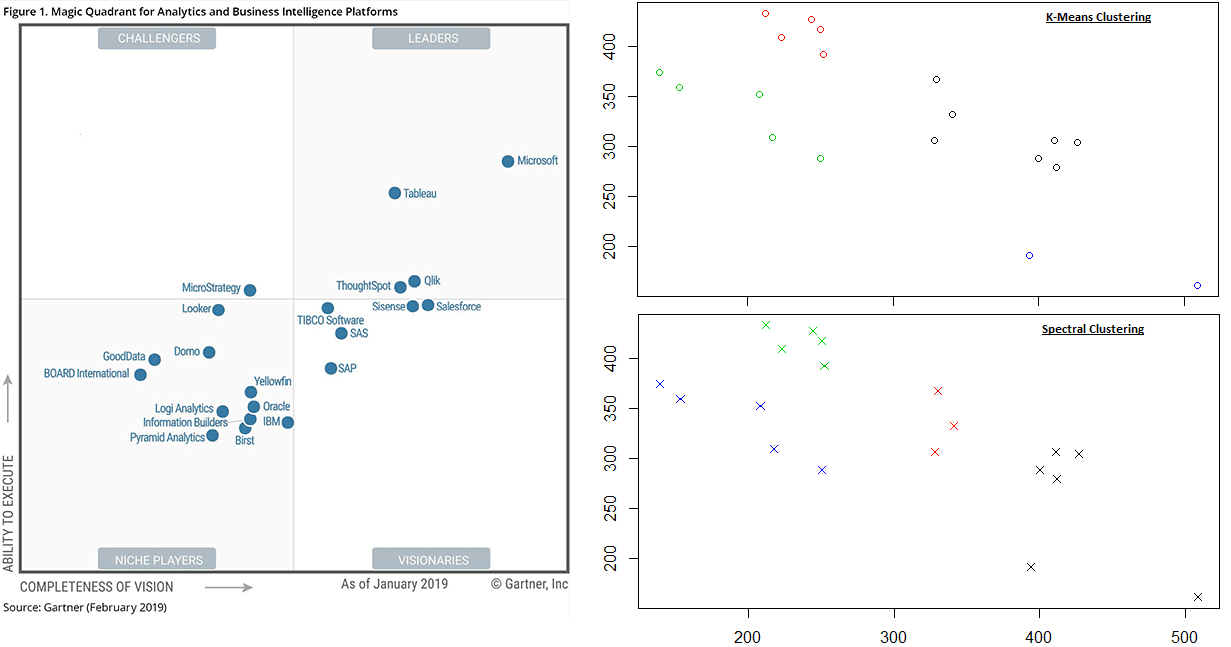
There is no possible logic in Gartner’s classification outcome of the four leaders they have in their magic quadrant. Notice, it is not one MQ that is falling apart in logic under cluster analysis; it is every one that we look at.
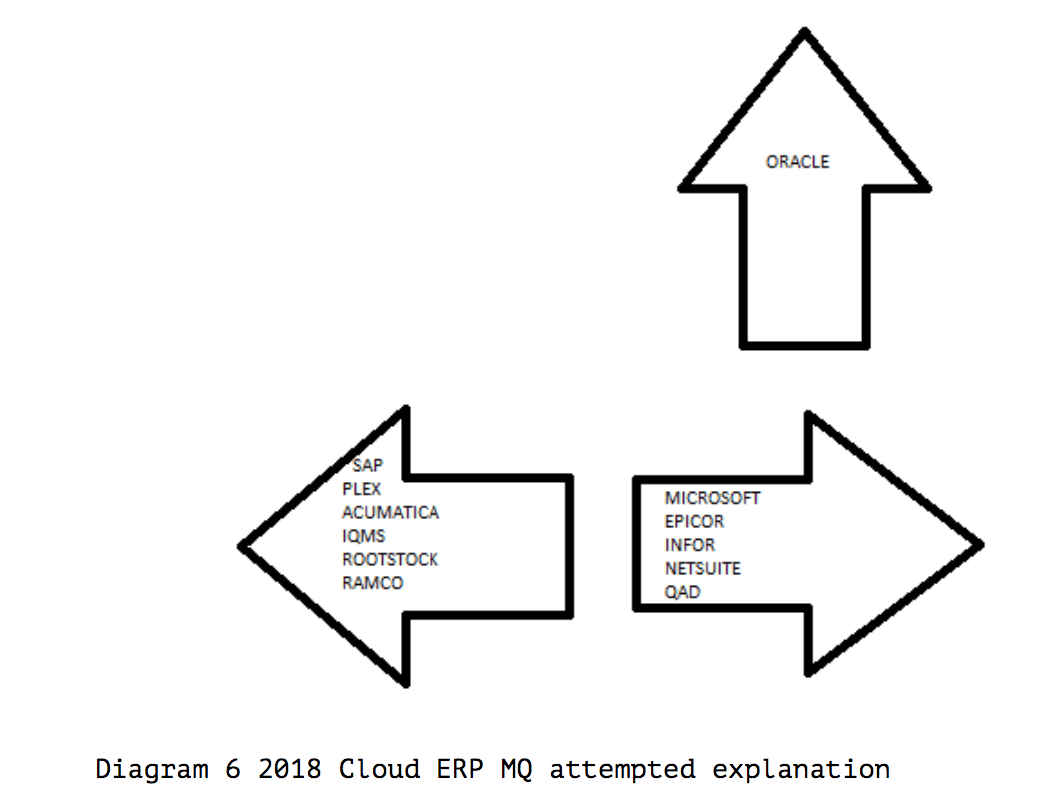
Let us review another MQ in an immature area of software, cloud ERP.
Clustering Analysis of the 2019 Gartner Cloud ERP Magic Quadrant
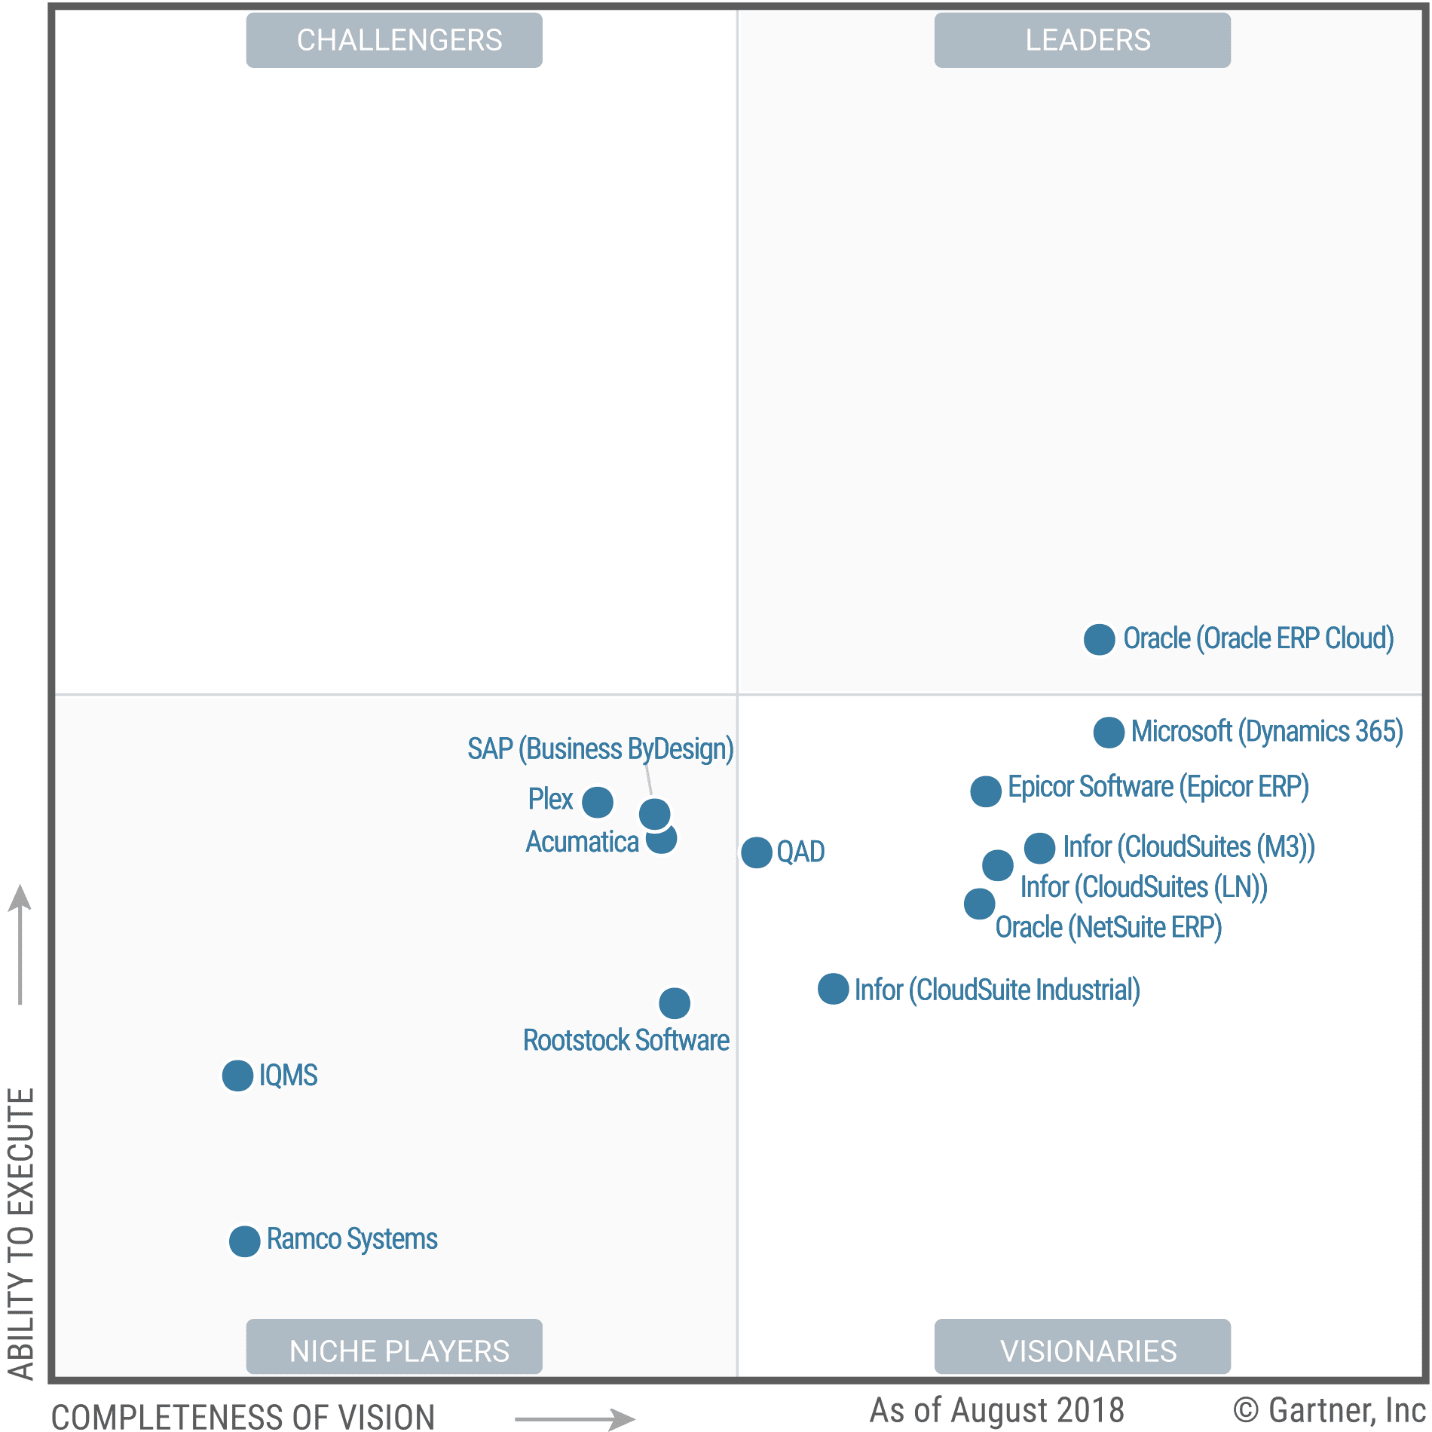
Notice what we are focusing on in this MQ.
Gartner places Oracle ERP Cloud, a vendor with a very lowly regarded cloud offering, as the only vendor with an offering in the Leader quadrant.
Naturally, Oracle has a lot of money to give Gartner. However, Oracle’s acquisition NetSuite, which is cloud-native and built its business in the cloud before the acquisition, is rated lower than Oracle ERP Cloud with far higher ability to execute, even though Oracle ERP Cloud has very few live instances, and NetSuite has a large number of live instances.
“Ability to Execute” apparently has nothing to do with the vendors’ previous history of executing. However, how can that be considered to be true?
It should also be mentioned that we can only perform a mathematical analysis of the vendors listed in each MQ. However, what is also very much worth observing is Gartner’s vendors not include in its MQs. For example, in the cloud ERP category, our highest-rated vendor in ERPNext.
However, ERPNext is not even listed in this MQ. And as we cover in the article, Can Anyone Make Sense of the ODMS Magic Quadrant?
Gartner has a strong bias against any vendor that cannot pay them.
And as ERPNext is open source ERP software, ERPNext cannot afford to pay Gartner. This means that each MQ needs to be stated as “The Magic Quadrant in XYZ Category for Vendors Who Could Afford to be Included in the MQ.” This is why we propose that Gartner is one of the market factors that support the commercial software model at the cost of the open-source software model. How to Understand Gartner and the Patent Software Vendor System.
Gartner essentially tells IT departments that open source options are off the table. And that IT departments should only consider commercial software and commercial software that pays Gartner, with the most significant commercial software vendors being the most preferred option.
So let us reemphasize, the mathematical analysis we performed, which shows Gartner’s problems, only covers the issues with the included vendors. The lack of representation from smaller vendors or open-source vendors is a different discussion, further undermining the MQs, and is covered in the article. Gartner can, in no way, claim to be surveying the actual field of vendor participants. Gartner offers a restricted view of the participants that change from year to year, without explaining why the field is narrowed and why some participants are included, and some are excluded. This lack of explanation is that if Gartner were to explain the logic for inclusion and exclusion, this could provide ammunition to those that seek to understand the MQs. Therefore, Gartner does not address the issue. This also reduces the leverage of any vendor versus Gartner. As Gartner sees itself as not being responsible for any continuity from year to year in the MQs, Gartner can legitimately threaten to leave non-paying vendors off the MQs whenever they see fit.
Gartner’s ZL Technologies Lawsuit
Gartner Magic Quadrants have long been plagued with controversy. In 2009, software vendor “ZL Technologies” challenged Gartner with a federal lawsuit. While ZL Technologies’ complaint was thrown out of court due to “lacking a specific complaint,” Gartner, Inc. was forced to declare their Magic Quadrants were the results of “pure opinion.” This case is covered in the article Is the Gartner Ombudsman for Real?
Despite ZL Technologies complaint being ruled out for “not being specific,” the following seven claims were made by the plaintiff;
“(1) defamation of character; (2) trade libel; (3) false statements under 43(a) of the Lanham Act concerning Gartner’s products and services; (4) false statements under 43(a) of the Lanham Act concerning products of Symantec Corporation (“Symantec”); (5) false or misleading advertising under California Business and Professions Code 17500; (6) unfair competition under California Business and Professions Code 17200; and (7) negligent interference with prospective economic advantage.”
So how can Gartner classify vendors more transparently?
Given that Gartner provides an assessment of vendor classifications In the field of “Data Science,” what would happen if we applied Machine Learning to the 2019 Gartner Magic Quadrant for Data Science for all of the Gartner Magic Quadrant pixel coordinates?
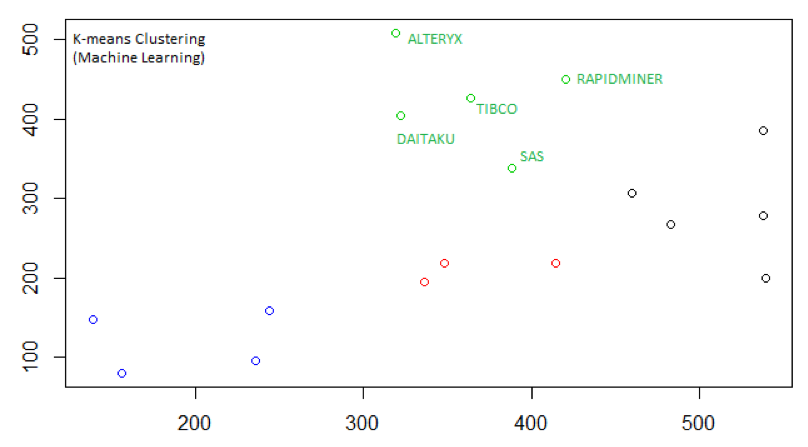
Diagram 7 ML Algorithm (K-Means) applied to 2019 Data Science MQ Pixel Coordinates.
Using any standard image software (we recommend MS Paint), using a mouse, you can locate the pixel coordinates for any of the data points on a scatterplot diagram. Now, as (Dr. Michael J Garbade, 2018) explains, “K-means clustering is one of the simplest and popular unsupervised machine learning algorithms.”
When the K-Means machine learning algorithm is applied to our pixel coordinates and searching for 4 clusters, we get Diagram 7 as our output.
So when applying Data Science to the 2019 Data Science MQ, both Alteryx and Daitaku are classified in the “Leaders” cluster. However, Gartner preferring the method of “pure opinion” for evaluating Data Science vendors, categorize Alteryx and Daitaku as mere “Challengers.” Which, according to Gartner’s methodology, is the lowest ordered MQ category.
Queue the La La Land soundtrack, please.
While Gartner is entitled to “pure opinion,” the Association for Data-Driven Marketing and Advertising (ADMA 2017) states business can run a trade promotion as either:
- A game of chance where all entrants have an equal chance of winning or
- A game of skill where the winner is chosen against set criteria.
ADMA, What You Need to Know About Running a Competition, 2017.
ADMA explains that these two descriptions of an intense competition ensure competitions or trade promotions are not, or not likely to be, misleading or deceptive.
Conclusion
The analysis of the grouping of Gartner’s MQs repeatedly demonstrates that Gartner is not following a consistent approach to how the vendors are positioned on the MQs. Secondly, the lack of publication of the supporting values is odd for a company that purports to perform research. Not doing so strongly implies that Gartner has something to hide.
It has been the long term assertion of Brightwork Research & Analysis that Gartner does not publish the supporting values, precisely so Gartner’s MQs cannot be audited. This mathematical analysis using clustering is just another piece of evidence that Gartner’s MQs are not based on consistent mathematical values.

The Problem: Thinking that Gartner is Focused on What is True
Gartner is hired by companies who fundamentally don’t understand how Gartner functions. Gartner has virtually no first-hand experience in the technologies they evaluate and get most of their information from executives at buyers or executives at vendors and consulting firms. Gartner is also not a research entity. They compare very poorly to real research entities once you dig into the details as we did in the article How Gartner’s Research Compares to Real Research Entities. Gartner serves to direct IT spending to the most expensive solutions as these are the companies that can afford to pay Gartner the most money. Gartner has enormously aggressive internal sales goals that place accuracy far below revenue growth in importance.