
How to Add and Remove Key Figures from Planning Books
Executive Summary
- We cover how to adjust Key Figures in Planning Books.
- There are problems with extra Key Figures.
- Several options are ranging from hiding Key Figures, removing Key Figures from the Planning Book, and removing Key Figures from the Planning Area.

Introduction
As the use of a system progresses, there are, in almost all cases, changes that are required to be made to the configuration. This is particularly true of SAP DP implementations, which tend to be implemented with too much complexity, even though it may have seemed like a good idea at the time. Often, over time the wheels will fall off of the wagon and SAP DP. When this happens, manual overrides replacing statistical forecasting, unused and un-updated Key Figures, which in most cases do not serve the needs of the demand planners.
The implementation of SAP DP by both the large consulting companies like IBM and Deloitte places emphasis on creating show horse implementations that do not work well in practice. In almost every case, the implementation, configuration, and overall setup must be streamlined — which also means a new way of working for demand planners. This is a subject with many different threads, but we will stick with how to make adjustments to Key Figures in Planning Books for this article.
Our References for This Article
If you want to see our references for this article and other related Brightwork articles, see this link.
Notice of Lack of Financial Bias: We have no financial ties to SAP or any other entity mentioned in this article.
- This is published by a research entity, not some lowbrow entity that is part of the SAP ecosystem.
- Second, no one paid for this article to be written, and it is not pretending to inform you while being rigged to sell you software or consulting services. Unlike nearly every other article you will find from Google on this topic, it has had no input from any company's marketing or sales department. As you are reading this article, consider how rare this is. The vast majority of information on the Internet on SAP is provided by SAP, which is filled with false claims and sleazy consulting companies and SAP consultants who will tell any lie for personal benefit. Furthermore, SAP pays off all IT analysts -- who have the same concern for accuracy as SAP. Not one of these entities will disclose their pro-SAP financial bias to their readers.
The Problem with Extra Key Figures in the Planning Book
Key Figures that are not wanted consume screen real estate, and if they are part of macros, they consume calculation cycles — although if an entire Key Figure, I am unsure how much extra processing this takes — as I have never tested it. However, everyone likes a zippier and more compact Planning Book. A primary reason for Key Figure reduction in DP is that companies are often optimistic in thinking that their demand planners will have the time to enter forecast adjustments in multiple categories.
A second reason is that DP projects assume that demand planning will instantly or eventually begin receiving more forecasting input.
After having reviewed many DP implementations, I can say that the existence of a live DP environment has little impact on how many forecasting inputs are received. The input to DP very strongly tends to be from demand planners as the DP user interface is challenging to distribute, widely considered clunky, and does not have the type of workflow and control that would make for a useful collaborative forecasting application. This is part of a broader topic: many statistical forecasting applications pose as collaborative forecasting applications. I cover this in my book.
I cover this in the book Supply Chain Forecasting Software, where I showcase real collaborative forecasting applications. About the only thing collaborative about DP is you can name Key Figures “Sales Input” or “Consensus Adjustment.” However, that is enough to fool most enterprise software buyers into thinking DP is a collaborative forecasting application. More on this is covered in this article.
Option 1: The Users Can Hide Key Figures Within the Planning Book
Any Key Figure — that is part of the default Key Figures for any Planning Book can be hidden by the user. This is not an “option” because it makes the user very inefficient, having to repeatedly hide the Key Figure every time they open the Planning Book. However, I list it here because it is technically an option.
It is a common complaint from users of implementations that had not had their Key Figures hidden through more robust means that they are repeatedly hiding Key Figures that, in fact, they never want to see. Key Figures that had some reason for being when DP (or SNP for that matter) was first implemented, but now are no longer required.
Option 2: Hiding Key Figures as a Default
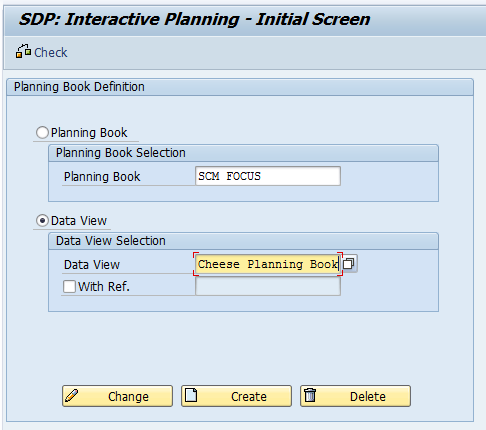
Key Figures can be hidden very easily. This is accomplished by going into the /SAPAPO/SDP8B (Define Planning Book) transaction, which is the Planning Books’ configuration.
You must select the Data View; if you choose the Planning Book option, you will be taken to an entirely different area.
Next, right mouse clicks on the Key Figure or row that you want to hide and select “Hide” from the drop-down. Then finish off by saving the change by choosing the Save Graphic Settings button. From there on out, that Key Figure will not appear as an option for the user to display.
Improving Performance
The next step – if one wants to improve performance, is to delete the macros that are associated with this Key Figure, so the Planning Book is not continually going through the calculation. When the MacroBuilder comes up, the list of all macros in the system is shown. There is an excellent way to find which of the Key Figures targeted for removal are located within which macro. However, the macros are categorized by the APO application area.
Secondly, each macro shows both the Planning Book it is associated with, as well as the Data View. From this information, it is straightforward to find the macros that have the Key Figures that are to be removed from the Planning Book/Data View.
Option 3: Removing the Key Figures from the Planning Book
This again requires going to /SAPAPO/SDP8B transaction, but this time selecting the Planning Book rather than the Data View alternative. On the Key Figure tab, you remove the Key Figure by selecting the Key Figure and hitting the remove button. There will always be more Key Figures in the Planning Area than in any one Planning Book. If the Key Figures are not assigned to the Planning Book, then they are no longer used in any calculation.
Luckily the Key Figures that are involved in macros are called out in the /SAPAPO/SDP8B transaction. For those Key Figures that do not have a macro that uses them, there is no other step required. For those Key Figures that do have macros that use them, there is another step, which means going to the Macro workbench, which is transaction /SAPAPO/ADVM.
A filter can be applied to the Macro workbench list, which significantly improves the efficiency of finding the macros that you are looking for.
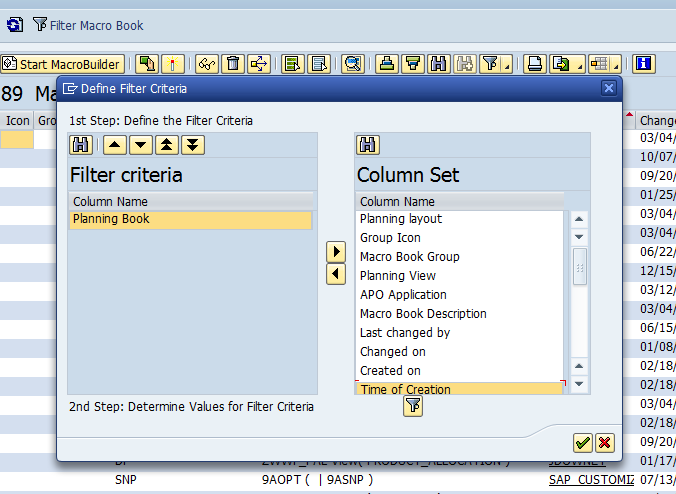
After you add the column, the second step is selecting the filter button on the bottom of this dialog box, which will bring up a selection screen where you can type in (in this case) the Planning Book that you want to filter on.
I very much recommend doing this. It gets the irrelevant macros out of the way, so you can focus on just the ones you are looking for.
Option 4: Removing the Key Figures from the Planning Area
While not necessary, if the Key Figures are no longer required, they can be eliminated from the Planning Area. This is accomplished with the following steps. This is from SAP SNC.
- “So first take the back up of all data, which is essential to you, and you would need that back in the Planning area.
- De-initialize the Time series.
- Remove the key figure.
- Initialize the time series.
- Check consistency for Planning area, Planning book, and Other dependent Objects like Macro, background activity/jobs.
- If all is okay, you can load the data back from Back up.”
I wanted to put this quotation within the context of other approaches to making changes to the Key Figures, as it is easy to read this note and conclude that this Option 2 and not Option 3 (that is the most extreme option)