
How to Understand Aggregated Statistical Forecasting in SAP DP
Executive Summary
- There are several options for the aggregated forecasting in SAP DP.
- There is a specific forecasting sequence.
- A forecast can be created at the aggregation at the product/ship-from with no disaggregation.
Introduction to Forecast Aggregation
Forecast aggregation is how products and locations are grouped. Forecast aggregation increases the complexity of any DP implementation. You will learn how aggregation is set up in DP.
Notice of Lack of Financial Bias: We have no financial ties to SAP or any other entity mentioned in this article.
- This is published by a research entity, not some lowbrow entity that is part of the SAP ecosystem.
- Second, no one paid for this article to be written, and it is not pretending to inform you while being rigged to sell you software or consulting services. Unlike nearly every other article you will find from Google on this topic, it has had no input from any company's marketing or sales department. As you are reading this article, consider how rare this is. The vast majority of information on the Internet on SAP is provided by SAP, which is filled with false claims and sleazy consulting companies and SAP consultants who will tell any lie for personal benefit. Furthermore, SAP pays off all IT analysts -- who have the same concern for accuracy as SAP. Not one of these entities will disclose their pro-SAP financial bias to their readers.
Introduction
I have evaluated SAP APO Demand Planner’s (DP) capability to perform attributed based aggregate forecasting. For those interested in understanding what attribute based aggregate forecasting is, please see this article.
Attribute-based aggregate forecasting is probably the most important advance to statistical forecasting in the past few years. Attribute-based forecasting is a specific design related to how the system deals with data that is associated with a product. An attribute can be anything, but simple examples of attributes can be the can item’s color or a significant body of research demonstrates that forecasting at the level of an attribute (yellow, blue, red) or (small, medium large) is one of the most reliable ways to improve the forecast. However, not enough companies are taking advantage of it because they do not test the forecast accuracy improvement per attribute.
Only in rare circumstances was the hierarchy structure selected by the ability to improve the forecast. Secondly, there is never just “one hierarchy,” as different departments want to see the data in different ways. Companies most often select a hierarchy that matches the company’s organizational structure, which has nothing to do with improving forecast error.
This confuses forecasting with reporting.
In his book “The Business Forecasting Deal,” Michael Gilliland has the following to say on this topic.
“Many forecasting software packages allow hierarchical forecasting wherein statistical forecasts are generated at one level (such as brand/region/month) and can be aggregated up (for example, to corporate total) or apportioned down (for example to item/customer/week). There is often confusion of forecasting needs with reporting needs, leading to overly complex hierarchies that cripple system performance.”
With attribute-based forecasting systems, no hierarchy is permanent. SAP DP is a popular forecasting system, can perform forecast aggregation.
“If you use navigational attributes, it is much easier to realign realignment characteristic value combinations when characteristic values change. For more information, see “Realigning” Navigational Attributes.” – SAP Help
Here, you can see that when an attribute is used, it’s easier to “realign realignment characteristics.” However, a true attribute base system has no realignment. The Specifics on the Use of Aggregated Forecasting
I consult in SAP and with some applications in the SCM suite, including DP. I find many companies that use DP do not use aggregated forecasting (this is different from having aggregations or reporting on aggregations. What I am speaking of is performing a top-down forecast based upon aggregation), and those that attempt aggregated forecasting using a hierarchy to even run into problems here.
Checking Online Sources
There are two places online that have significant amounts of information that are shared between SAP users and consultants. One is SDN, and the other the SAP OSS Note system. In checking both, I found very little on the topic of aggregation. I have attached several of the screenshots below.
As you can see, I performed searches for both aggregate and attribute forecasting beginning in SDN.
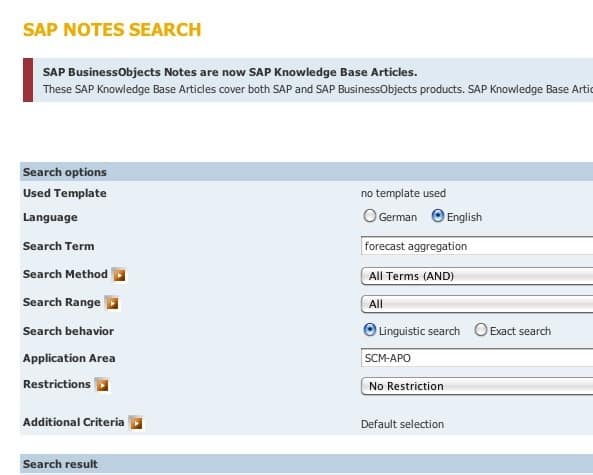
So very little is returned in either of these two search criteria. Next, I searched through the SAP Notes system and restricted the search to within the SCM-APO suite.
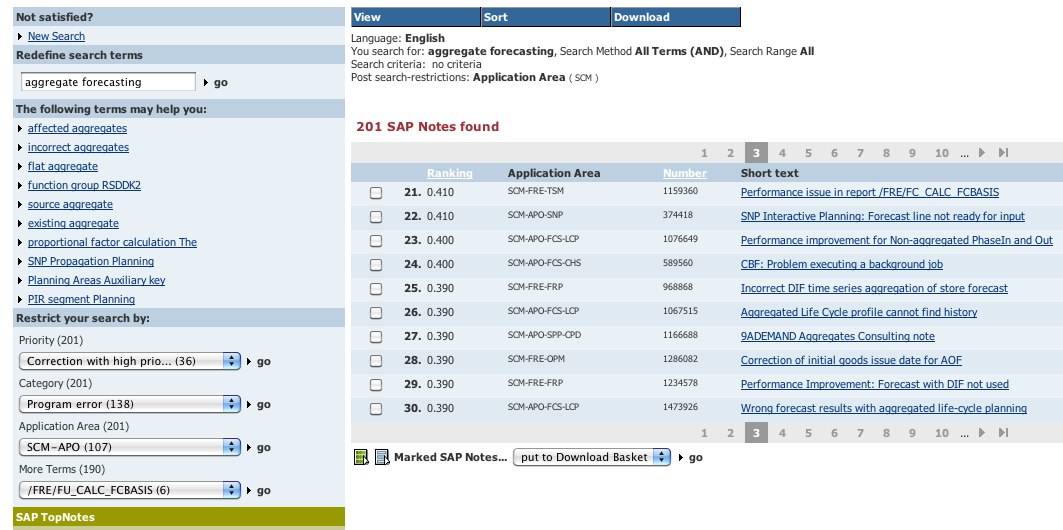
The OSS note system has a nice filter for subjects. In this case, you can see on the lower left-hand side; I have selected only for SCM-APO OSS Notes. However, these notes do not show much concerning actual aggregate forecasting.
These notes are important because they tell you what companies are having problems with and what areas of functionality are intensively used.
Synopsis of Analysis
My conclusion from these notes, my consulting experience and triangulating with some other consultants is that companies that are using DP are not performing much-aggregated forecasting. This is not to say they don’t have a hierarchy, but that it is most often not used to create a top-down forecast.
Unfortunately, forecast aggregation is quite beneficial. Secondly, attributes are highly flexible, and anything that can be coded for can be an attribute. For instance, a company could code its products as either being forecasted by statistical methods or by sales input (i.e., new products, products that don’t forecast well with pure stats) and then apply specific forecast aggregations to just sales forecast items or statistically forecast items. With attributes, products can quickly move between different categories without having to realign the hierarchy.
Combining Hierarchies in Multiple Demand Planning Systems
This is one of the first questions asked when I recommend combining demand planning solutions. This topic is covered in this article.
How Aggregation Works
SAP can create a forecast at any level of aggregation that is available in the system. The starting place for aggregation is characteristics. These are attributes of what is being forecasted. Disaggregation of the forecast occurs in the Key Figures of the Planning Book. This is true whether the statistical forecast is generated in the background (that is through Process Chains) or interactively — which is within the Univariate View of the Planning Book.
There are several types of aggregation/disaggregation in DP, but we will discuss the Calculation Type for this area.
“The Calculation Type: This is the primary aggregation/disaggregation method in DP. The Calculation Type controls how the disaggregation is performed from one level of aggregation and down to the lowest level in the hierarchy and on what, if any other Key Figure the aggregation/disaggregation is based upon.” – SAP Help
The most common type of Calculation Type aggregation/disaggregate that is used in the DP, but also for disaggregating the statistical forecast, is Pro Rata. Pro Rata works in the following way.
“S: Pro Rata: This is the most common Calculation Type disaggregation used in the Data Views of the DEMAND_WWF Planning Book. In fact, of the Key Figures that disaggregate, all but one uses Pro Rata. If you create key figure values on an aggregate level: The values are distributed on detail level in equal portions. If you change key figure values on an aggregate level: The values on detail level change so that each value has the same proportion with regard to the aggregate value as before.” – SAP Help
For example, let’s set up a sequence to see how to forecast disaggregation in the DP. The desire is to obtain a forecast at the Product/Ship-From location.
Forecasting Sequence:
- Step 1: Create a forecast at the Ship-From location. This will populate a Key Figure with a forecast for each Planning Bucket. We will call this the “Ship-From” Key Figure.
- Step 2: Create a forecast for the Product. Place the forecast in a Key Figure, which is the primary statistical forecast Key Figure, which we will call “Stat Forecast.” Set the Disaggregation Type as Pro Rata, and set the Key Figure Basis as the “Ship-From” Key Figure. All of these settings are configured in the Planning Book Design View. The details of what can be configured can be read in this article.
When the Product forecast is created, it will allocate or disaggregate the overall Product forecast based upon the relative quantities in the Ship-To forecast. That is one option for getting a Product/Ship-From forecast. However, there is, of course, another option.
Creating the Forecast at the Product/Ship-From with No Disaggregation
In DP, a forecast can be generated at any combination.
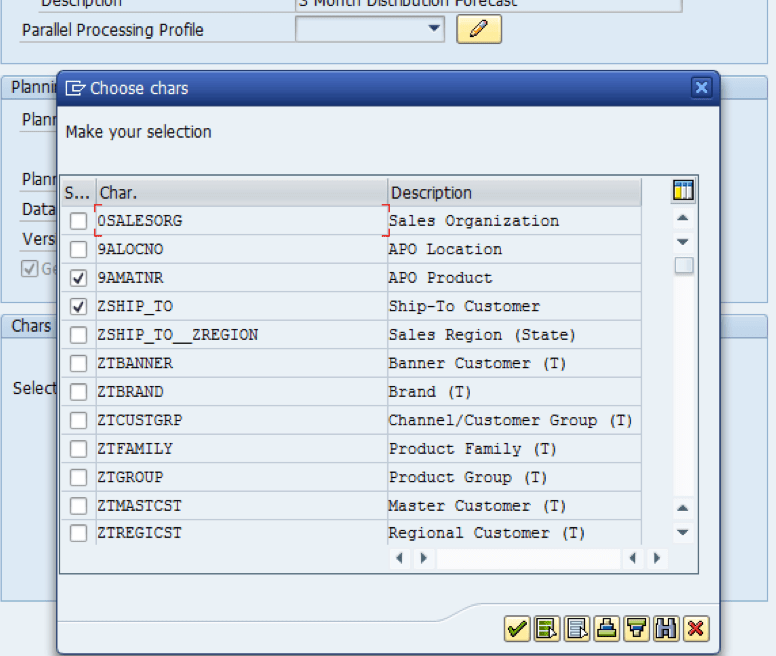
This is a Planning Job in a Process Chain in SAP DP. As you can see, I have two checkboxes selected — so this would create a Product/Ship-To forecast. However, DP can create a forecast for any combination of characteristics included in any Planning Book.
The questions become then, whether to generate a single forecast at one level of aggregation or create multiple forecasts, where one forecast disaggregates based upon another forecast — as was described above.
Choosing the Right Characteristic
- Some characteristics are helpful for statistical forecasting, and some are not.
- Some characteristics are used not by the statistical forecast but are used by users to apply manual adjustments.
- When a company decides to configure SAP DP to use a particular set of characteristics for forecasting in their of the ways described above, it’s important to perform the research that can show definitively that statistical forecasting improves forecast accuracy. “
- At the end of the day,” the forecast should be at the product/ship-from combination. However, that does not mean that attributes/characteristics cannot be used to generate the forecast — that will eventually disaggregate to the end state of a product/ship-from.
- Marketing and sales will have other areas where they want to measure forecast error. However, for supply chain purposes, the forecast error should be measured at the point of replenishment.
Using SAP DP for Characteristic Testing
Setting up forecasting at a particular aggregation is time-consuming, and SAP DP is not a good system for testing which characteristics should be used. This is why I use an external prototype environment for this type of characteristic/attribute testing, which is much faster and easier to simulate. Consulting companies that use DP for prototyping tend not to get very far. For instance, a company like IBM or Accenture will never be concerned about efficiency as they simply want to bill as many hours as possible. Prototyping in DP is a great way to waste time and to bill the client for very low value-added work. I liken DP is like a battleship. For that reason, it’s a better system to configure after you have already figured out what you want to do.
Conclusion
On a recent project, I added some Forecast Profiles to a Process Chain, and the Process Chain began to malfunction, applying the wrong Forecast Profile, which required a lengthy period of troubleshooting.
However, after the right characteristics have been determined through testing, they can then be set up to be part of the Process Chain’s statistical forecast. I have not come across any other consulting company or consultant that follows the approach I have outlined above.
During the testing process, the characteristics that are desired to be tested can be compared to other characteristics. In most cases, only a few of the characteristics will actually be beneficial for forecasting with a top-down forecasting approach. There will still be more characteristics included in the Planning Book, but other characteristics will serve other purposes outside of statistical forecasting.