
Executive Summary
- There are common problems in measured forecast accuracy; however, making the forecast error monetized and weighed increases the ability to drive forecast improvement.
- This forecast error measurement is available in the Brightwork Explorer.

Introduction
Forecast error measurement is hugely important. Without an accurate rating of your forecast accuracy, it is unknown what changes to the forecast process are desirable and will lead to forecast accuracy improvement.
However, while most of the discussion circulates the forecast error measurement type (MAPE, MAD, RMSE, etc..), these methods are generally ineffective in helping companies improve their forecast accuracy.
This article will explain why and why the Brightwork Explorer contains a far more direct and effective alternative.
The Common Problems in Measuring Forecast Accuracy
A primary reason for this is that most forecasting software is designed for viewing the time series graphically and either make manual adjustments or fit various forecasting models. The design orientation of all of the forecasting applications that we have worked with and reviewed over the years is not specifically around forecast error determination. This means measuring forecast accuracy given the standard tools usually is time-consuming, stressful, itself error-prone. For these reasons and a host of others, forecast error measurement is very restricted in nearly all companies. And it also means that companies do not have a firm grip on how various forecast methods compare against one another. Doing this requires being able to compare each method’s forecast error against one another relatively easily.
Here are some common issues we see with forecast error measurement.
- The forecast error is reported out at too high of a level.
- In our experience, companies only very rarely weigh their forecast error. And this is unsurprising as weighting the forecast using the standard forecast error methods is complex.
- They never quantify the value of the forecast improvement monetarily.
- The forecast error is only measured and reported for the statistical forecast, with literally no other forecasts measured for error. This means the manual overrides, the sales forecast, the marketing forecasting, and other forecasts are excluded from measurement.
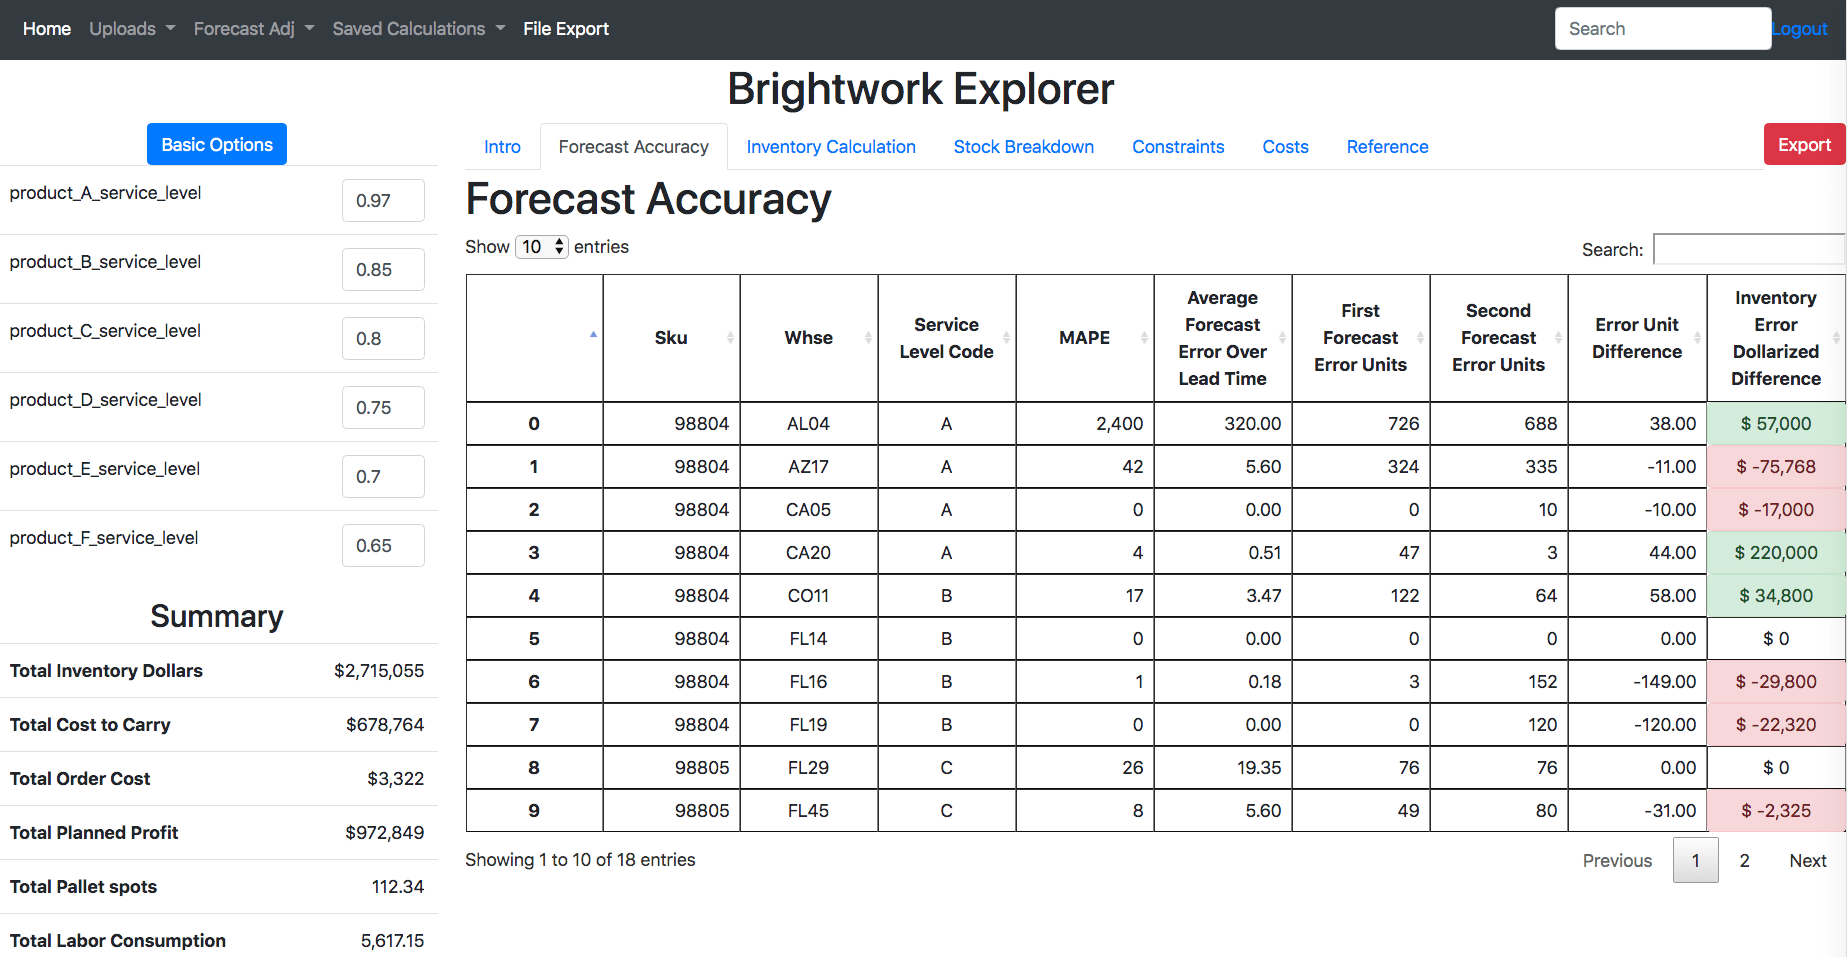
This view above does not exist in forecasting applications, and it does not matter how much you spend. Notice at the far right column, there is dollarization of the forecast. This is the inaccuracy in units * the inventory dollars over the interval being checked. The interval is flexible in the Brightwork Explorer and can be any “to” month or week and any “from” month or week. This means that while any number of forecast buckets can be loaded into the Brightwork Explorer, the user defines what interval they want to check for the forecast error and can change the interval at will.
Sorting The Inventory Error Dollarized Forecast Product Locations
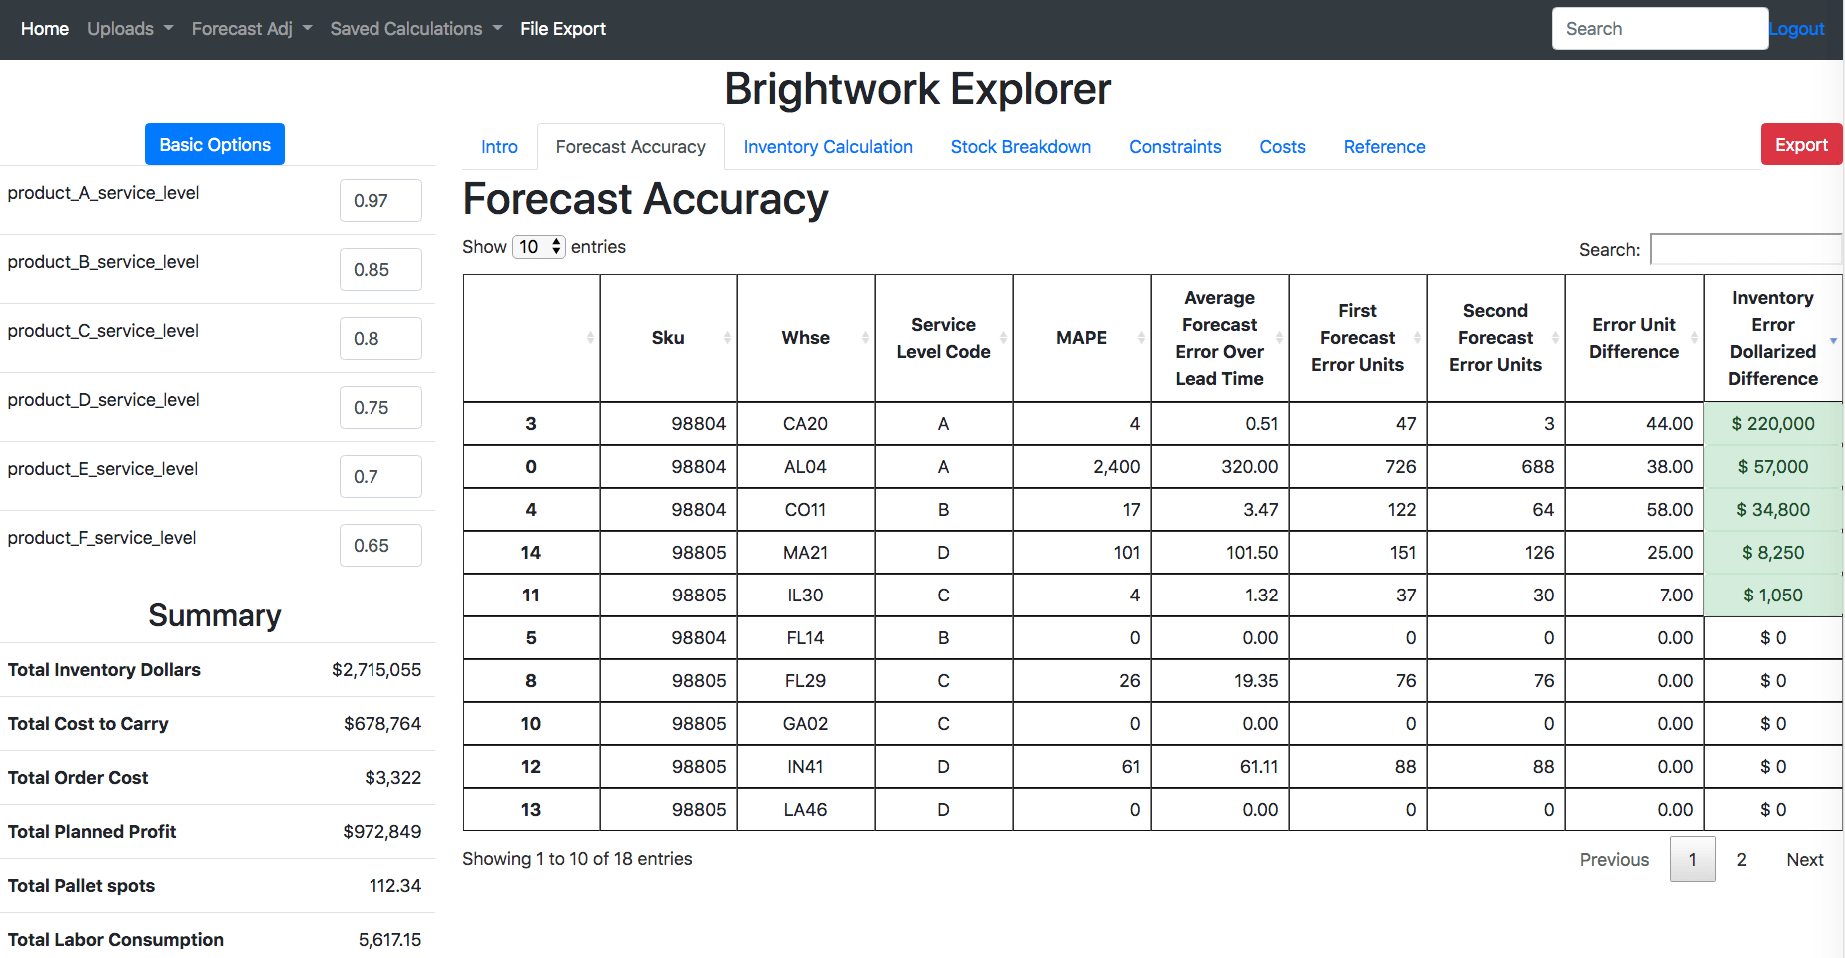
These are the product location combinations that are improved by the second forecast. This means that there is a likelihood that the product locations that sort to the top of the monetized forecast error should be changed to the tested forecast method. This tells the demand planner where to focus their attention.
Tests like this can be performed repeatedly to ensure the best forecast is being applied to the product locations.
It is critical not to confuse performing a forecast at a level of aggregation by measuring the forecast. Measurement must be at the lowest level or the level pertinent to supply planning. The supply planning process is the “customer” of the supply chain forecasting process.
Problem #1: Reporting Forecast Accuracy at a High Aggregation than the Product Location Combination
Companies will often say that they are reporting forecast error at an aggregation (product family, product group, etc..) because it reduces the forecast error. Or they might say that reporting forecast error at a grouping is how different departments “want to see the forecast error.”
While there will always be many different forecast error reports, the forecast error for supply chain planning must be measured at a specific product for a particular location. That is, the measurement location is not optional. This leads companies to have a much lower forecast accuracy than they think they do. This led one executive on at a client of ours to state.
“I don’t get it. Our unit forecast accuracy is high, why is our service level so low?”
Higher aggregation means, of course, lower error. But the error cannot merely be measured wherever it is lowest!
To make forecast improvements, a company must know its forecast error and then what techniques make what percentage improvement in the forecast error. If the company is “hazy” as to what a relative forecast error is or what their forecast error is, it becomes impossible to know the impact of changes to techniques.
Solution #1: Why…For Supply Chain Planning, the Forecast Error Must be Measured at the Product Location Combination
The forecast error that is pertinent to supply planning is the error at the product location combination. No other aggregation higher than this has any meaning for supply planning as the supply plan must be generated at the product location.
Companies require an easy way to measure forecast error. Brightwork Forecast Explorer provides the easiest way to calculate forecast error. It can be used to calculate any forecast interval (that is a grouping of periods) and many different forecasting inputs.
Problem #2: A Lack of Weighting of the Forecast Error
Most companies do not weigh their forecast error.
This makes little sense because, without weighting, a product with an average demand of 10 units per month counts the same as a product with an average of 20,000 units per month.
A primary reason that companies do not weigh the forecast error, even though no average forecast error makes sense without it, with the standard error measurements, it isn’t straightforward to do. And it is also confusing to explain to people outside of those close to the forecasting function.
Solution #2: Natively Weighing the Forecast Error
The Weighted Monetary Forecast Error naturally weights the forecast error right within the Brightwork Explorer application. The Brightwork Explorer always calculates the error at the product location combination, but every line item of error is naturally weighed.
Problem #3: No Comparative Forecast Error
A forecast error without comparison loses much of its meaning. You are informed that a product location using an advanced machine learning algorithm has a forecast error of 20% and an accuracy of 80%.
This sounds pretty good.
However, what if the naive forecast for this same product location combination has a forecast error of 17% or 83% accuracy?
That changes the interpretation of the first description.
Solution #3: Natively Comparing the Forecast Errors of Two Forecasts
The Brightwork Explorer is designed to have two forecasts uploaded along with the sales history. At every product location combination, the Weighted Monetary or Dollarized Forecast Error can be calculated.
The Brightwork Explorer can save any number of simulated comparisons of forecast errors in the application, which can be brought up at any time and reviewed and discussed.
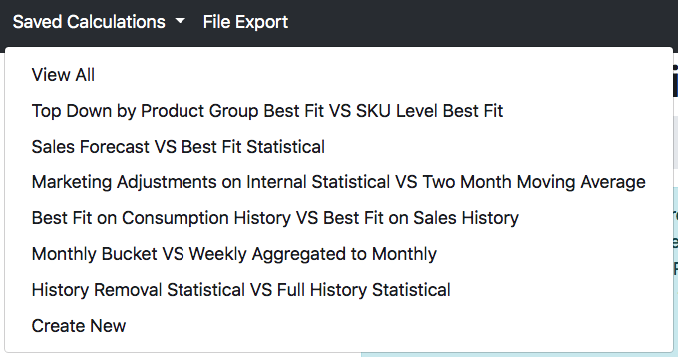
This is just an example of the comparisons that we have saved in the Brightwork Explorer. Having these comparative errors saved in the BE allows the forecast error to be easily shared within the company.
Problem #4: A Lack of Prioritization
What if one has the list of the MAPE, MAD, or RMSE calculations for a list of product locations. And the demand planner thinks that they should put effort into improving the forecast?
In most cases, the demand planner will have no idea how to focus their attention. This is because forecasting systems provide no logic for prioritization.
The demand planner usually does not know the following important information.
- Which product locations have the highest potential for improved forecast accuracy with a new forecasting method?
- What is the financial value of the improved forecast error — as most forecasting applications do not have the part cost or price. Standard forecast errors work off of percentages, not units, and not cost or price.
Solution #4: Monetization, Prioritization, and Native Sorting
With the Brightwork Explorer, monetization of the forecast error occurs right in the application. The prioritization is simple. The forecast error can be quickly sorted to tell the demand planner which product locations have the most significant impact on inventory dollars based upon a change to a different forecast method than is currently used.
Problem #5: Only Measuring Forecast Error for the Statistical Forecast and No Other Input
Forecasts come in from sales, marketing, and supply chain, among other sources.
Most companies put a great deal of emphasis on measuring the statistical forecast. However, they usually do not measure either manual overrides by demand planners or forecast inputs from sales and marketing.
Often, all of these inputs are simply part of the final forecast.
If each of the inputs is not measured, how does anyone know what the value is to continue to include these different inputs in the future? Secondly, why measure the statistical forecast for accuracy but not the other inputs. Why are sales and marketing exempt from being measured on the quality of their inputs?
To develop a high-quality consensus forecast, the error of each input must be evaluated.
- Most companies do not know the error of these inputs. Most sales and marketing departments can enter any forecast they wish without their forecast error ever being measured.
- Therefore they do not know how much to weigh some inputs versus others.
- Companies that attempt to incorporate sales input into the forecasting process will nearly always confuse “getting input” with getting quality input and will not set up the appropriate measurement mechanism and firewall between the sales forecast and the supply chain forecast.
Solution #5: Measuring the Forecast Error of Every Forecasting Input
The only successful consensus-based sales/supply chain forecasting projects are where sales provide but do not control which inputs get into the supply chain forecast. (this generalizes for all consensus inputs). This is because sales want the inventory always available and can increase inventory by increasing their forecast. As they aren’t held responsible for inventory, they don’t care how much the cost of sale is, as it does not impact their quota.
Successful consensus-based sales/supply chain forecasting projects are rare.
There are several reasons why companies do not measure forecast accuracy outside of the statistical forecast. And one reason gets back to the previously mentioned issue that most forecasting systems are designed to produce forecasts, not to measure error. They have essential error measurement, but that is not the same as purpose-building to measure forecast error specifically.
A primary reason for this is that companies find it too difficult to maintain each of these inputs’ forecast errors. Therefore, low accuracy inputs end up being accepted into the consensus forecast. This is like baking a cake without worrying about where the ingredients came from or their quality.
With Brightwork Forecast Explorer, you can know the forecast error — and the forecast error as it relates specifically to the product location combination for all inputs.
Taking Control of the Forecast Error Process
It is easy to get overwhelmed with forecast error measurement complexity. How we observe companies tend to measure forecast error indicates they are overwhelmed by these complexities. Don’t waste your time or lose your mind trying to calculate forecast error.
None of the forecasting applications calculated forecast error the way the Brightwork Explorer does. It took years to figure out the lack of effectiveness, using the traditional error measurement methods and eventually coming up with our approach.
Forecast inputs should be determined by measuring each forecasting input error before being included in the final forecast.
Forecasting Testing — Everywhere
We mean that. We say it because we use Brightwork Forecast Explorer ourselves to measure forecast error from every dimension, so we focused on this functionality in particular. Once forecast error measurement is semi-automated, there becomes a much higher ability and, therefore, interest in testing forecast error.
Brightwork Forecast Explorer is perfect for measuring any forecast error.
This includes:
- Statistical forecasting in different time buckets.
- Statistical forecasts from top-down techniques.
- Statistical forecasts using different history (for instance, sales orders versus consumption)
- Determining the statistical forecastability of different locations in the supply network (which may lead to placing forecasts in locations different from their current locations).
- Determining which data streams to use for generating a forecast (for example, orders versus bookings or goods issues)
- Testing historical removal — that is, removing history that is nonrepresentative to improve pattern recognition.
- Sales forecasts
- Marketing forecasts
- Etc..
We can count on one hand the number of companies that we have worked with that know the forecast error of their sales or marketing forecasts!
And the end of the process, once the forecast error can be easily calculated (we always need the files in the format of the forecast being at the product location combination), it tells the entity that is creating the forecast the best way to forecast is.
Having Brightwork Create the Tested Forecast for You
The Brightwork Explorer is free for as many users at a company to use but requires a consulting contract. Customers pay an hourly rate for support and a small base cost per month, depending upon the company’s size.
However, the hourly support rate can also include Brightwork creating the forecasts by any method (such as those described above) and then loading the results into the Brightwork Explorer for you to review. We often recommend doing this because we are very efficient at creating any forecast that customers are interested in seeing tested. This is typically just for the testing phase. Once the testing is complete, the standard approach is to configure the forecast within your forecasting system. Companies that only have an ERP system or are producing forecasts with Excel or Excel and a statistical plugin should ask us about their forecasting options.