The Answer to Coronavirus is Isolating the Plus 65 Age Group and the Obese
Executive Summary
- The most effective way of managing the Coronavirus is apparent from observing the mortality data of the virus.
- This is to have only a small segment of society self-isolate.

Introduction
The media has given an enormous amount of coverage of the Coronavirus. However, they have tended to cover the virus in a very sensational and, therefore, non-analytical way.
The US government, along with other international governments, have done very little to apply statistics and epidemiology expertise to craft a policy response to the Coronavirus.
Previous Video at (https://www.youtube.com/watch?v=C1cK5B1j4)
Curiously, the video that was published and viewable when this article was first published is no longer available.
Lockdowns have been a primary tactic for addressing Coronavirus. This has caused economic damage and conflict in nearly all countries.
About Our References
See our references for this article and related articles at this link.
To Lockdown or Not Lockdown?
The lockdown decision’s presumption appears that all people have a roughly equal likelihood of dying from the Coronavirus. The question is whether locking down and reducing Coronavirus deaths or not locking down and increasing Coronavirus deaths. There is little nuance in these two options, and due to a lack of specificity based on the epidemiology of the virus, the lockdown/no lockdown option, as presented, is a false choice between two undesirable courses of action.
Let us get into the data on the mortality of the Coronavirus to see what it tells us.
The Coronavirus Mortality by Age
The following table is from World O Meters, which has become the global goto site for Coronavirus statistics.
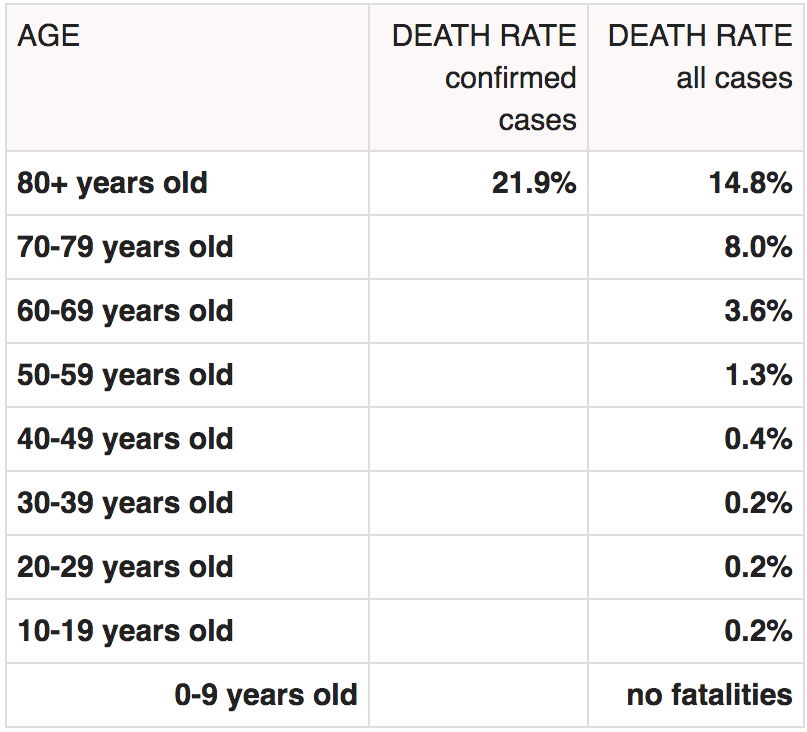
Notice the dramatically increasing mortality by age.
If we look at people in the 70 to 79-year-old category, they have mortality from Coronavirus that is 40 times higher than someone in the 30 to 39-year-old category. People above 80 have a mortality rate 74 times higher than those in the 30 to 39-year-old category.
This tells us that the vast majority of deaths from Coronavirus have been the aged. This tells us that many, if not perhaps, people dying from Coronavirus are just having their deaths pulled forward a few years.
Major Media Outlets Prefer Anectodes Over Statistical Analysis
Major media outlets have largely argued against this analysis, pointing to anecdotes of young people and “perfectly healthy” who have died.
- First, the anecdotes do not tell us the overall trend or larger pattern.
- Second, as the victims who were declared perfectly healthy were not given a full medical exam before falling ill, we don’t know what underlying issues they had that were unpublished.
Here is another presentation of the data in a different way and from a later date.
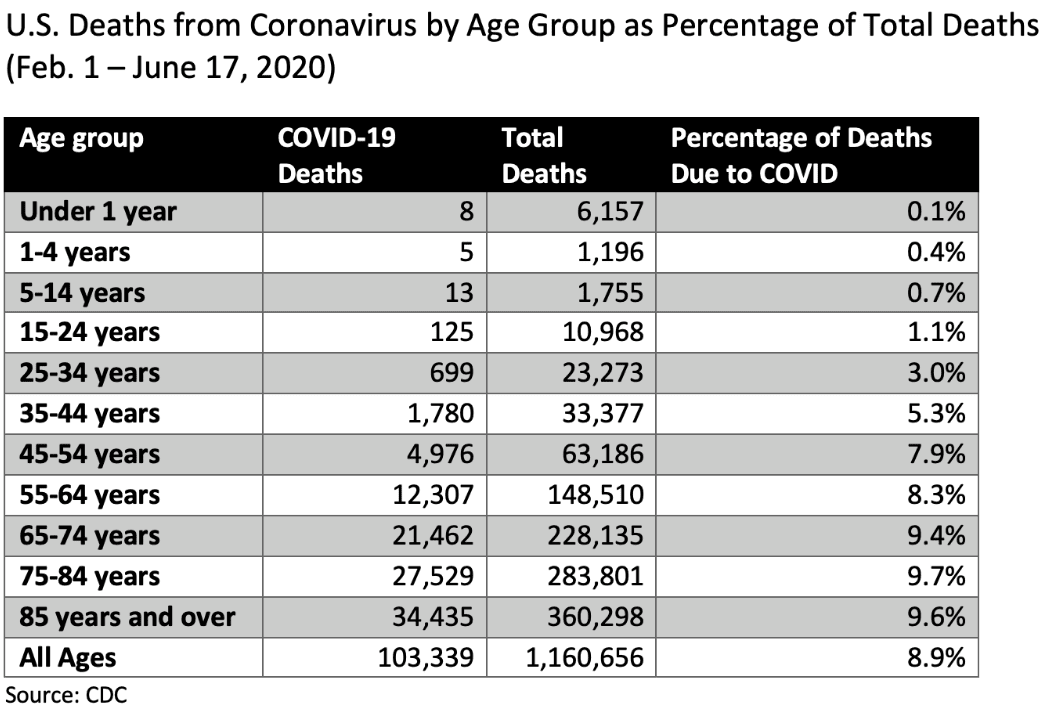
It is simple to add 228,135, 283,801, and 360,298 and divide this sum by the total of 1,160,656 and realize that 75% of all Coronavirus deaths come from these three top age cohorts.
This table shows the significant death percentage in the 65 and older cohort.
This virus is lethal to the old and, to a far smaller degree, those with health issues.
Media entities have preferred to focus on the virus’s lethality on blacks. However, this discrepancy is nearly invisible compared to the lethality differential by age. But, as is normally the case, most media entities prefer to carry stories around racial discrepancies if it is the right racial discrepancy. If the death rates from Coronavirus for whites were higher than blacks — the media would simply not report it, as they are not reporting the higher death rates from Coronavirus for men versus women. The virus would be called sexist if the death rate were higher for women than men. But as the reverse is true, it’s a non-topic.
As is stated by the author of the American Council on Science and Health article.
While coronavirus is obviously concerning and a very real threat to some people (namely, the elderly and immunocompromised), these data also show that the risk for the rest of the population is quite low.
Is it?
Yes, it is.
But when is someone in charge of setting the policy response to Coronavirus going to figure out how to work this into that response?
And it is not just this issue.
Flattening the Curve
The logic of flattening the curve is presented in the following graphic.
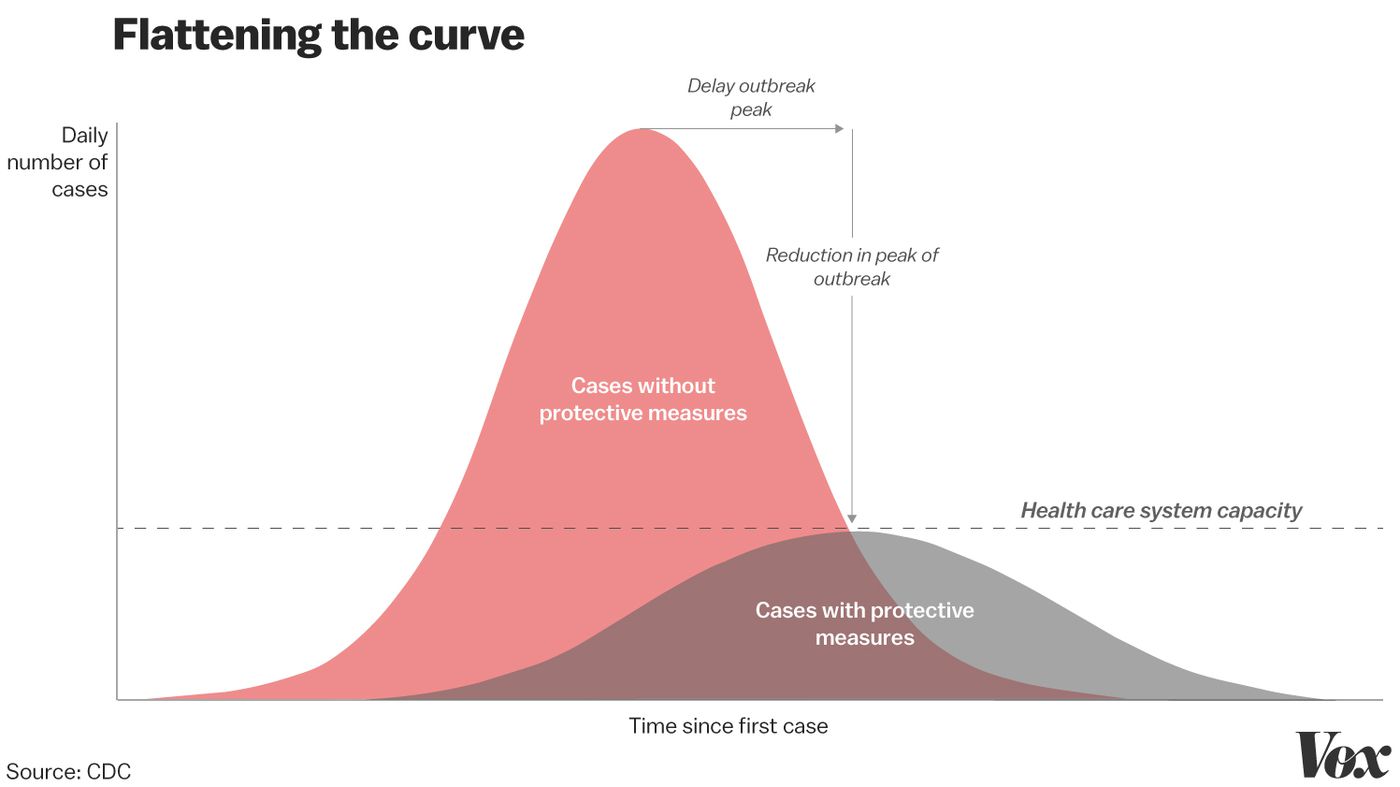
A big part of the logic of locking down states is to flatten the curve. This is to prevent hospitals from being overwhelmed, and they’re not enough ventilators for those that need them.
However, the flaw in this analysis is that it is extremely rare for those not 65 years or above — or those with underlying health conditions to require a ventilator. Therefore, by applying restrictive policies for the overall population, we are causing adjustments to the roughly 80% of the population that do not need to flatten the curve as they are not likely ever to be put on a ventilator.
The Outcome of a Near 100% Coronavirus Contraction Result on a US Aircraft Carrier
In the case study, virtually every person on the US, Theodore Roosevelt, who contracted Coronavirus and was asymptomatic.
This is explained in the following quotation.
Roughly 60 percent of the over 600 sailors who tested positive so far have not shown symptoms of COVID-19, the potentially lethal respiratory disease caused by the coronavirus, the Navy says. The service did not speculate about how many might later develop symptoms or remain asymptomatic. – Reuters
That is, it is not that only 60% of the sailors tested were asymptomatic, only 60% of the crew was tested, and while testing positive, all of them were asymptomatic.
Then the following quotation illustrates that several senior members in the US DOD have major limitations in interpreting data.