
How SAP DP Calculates The MAPE Error Incorrectly With Zero Demand
Executive Summary
- DP has problems with MAPE, and it shows incorrectly in DP when there are errors.
- We cover an example of what DP does to calculate the MAPE.

Introduction to MAPE Forecast Error in DP with Zeros
On several accounts now, clients I have worked with have had problems getting the best fit functionality in SAP DP to work correctly. It has not been a case of clients who tried it quickly and quit, but rather clients who invested large sums of money in attempting to get the functionality to work, who contacted SAP (and were given the runaround), and who finally gave up. MAPE does not work when one period has a zero in the demand history. However, how SAP shows the error is confusing to many SAP customers.
Our References for This Article
If you want to see our references for this article and related Brightwork articles, see this link.
First Analysis of the Forecast Error
At first, it appeared as if the main problem why SAP DP has such a problem picking a best-fit forecasting methodology is that DP has a flaw in calculating its error.
It appears that DP Auto Model Selection 1 and 2 use the MAD calculation.
- MAD does not have the same problems with zeros as Mean Absolute Percentage Error.
- MAPE is a problem when there are zeros in the demand history with any application, but how the error is shown and used is what comes down to the designers’ decisions.
The Calculation of the DP Error
Daniel Hutchinson, a demand planning manager who observed the SAP error and worked backward, solved what it was doing. He performed this work in a spreadsheet, and screenshots of this spreadsheet have been copied below. 
This screenshot shows how the externally calculated error for MAPE is matching the APO calculated MAPE. This is when there are no zeros in the time series.  However, all that it takes to throw off the SAP DP MAPE calculation is a single zero in the time series, which we are about to introduce.
For January, we changed the demand from 6 to 0.
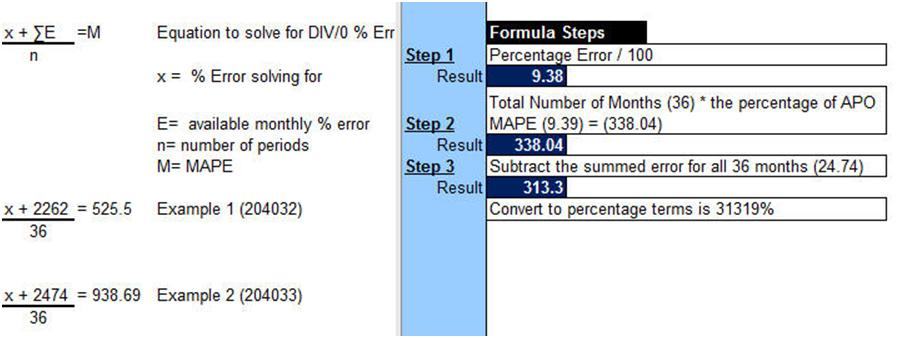
Now notice the #DIV/0! error that we receive. However, DP has some way of dealing with the error because it calculates not a #DIV/0! for the total MAPE but 525%. To get the externally calculated error also to match 525%, this month’s error has to be set at 16654% for January.
- This shows the heart of the DP error calculation failure.
- Because that error is so high, it throws off the Mean Absolute Percentage Error calculation for the entire time series. Here is another time series, but with the same problem.
- In this case, DP calculates an error of 31319%, pushing the error for the time series to 939%.
Working backward from what was required to get the error this high, the following formula was used. The formulas are on the right below, and the spreadsheet calculation description (which will probably be more comfortable for most people to use understand) is on the right.
Conclusion
This shows the central problem with how planners perceive SAP DP best fit, its error calculation is defective, and it has no way to calculate zeros effectively. We have addressed this issue by superimposing an average when the history is a zero, but this only works when the zero is only occasional, so in the Brightwork Forecast Explorer, we move to MASE MAAPE, which are designed to be calculated with zeros.
Dp is ten years old, and it is the most widely implemented module in the SAP SCM suite. And SAP surely knows about this error and has chosen not to give it development resources. The change they made back in 2005 was to substitute a “1” for the “0”s in the time series. Previously, it simply did not calculate a Mean Absolute Percentage Error, which would have been preferable. This is documented in OSS Note 849019.
A Better Approach to Forecast Error Measurement
We cover the problems with MAPE in the article The Problem With Using MAPE for Forecast Error Measurement. Our observation is that all of the standard forecast error measurements are negative for improving forecast accuracy. As we cover in the article How is Forecast Error Measured in All of the Dimensions in Reality?
Observing ineffective forecast error measurements at so many companies, we developed the Brightwork Explorer to, in part, have a purpose-built application that can measure any forecast. The application has a very straightforward file format where your company’s data can be entered, and the forecast error calculation is exceptionally straightforward. Any forecast can be measured against the baseline statistical forecast — and then the product location combinations can be sorted to show which product locations lost or gain forecast accuracy from other forecasts.
This is the fastest and most accurate way of measuring multiple forecasts that we have seen.
How Should EOQ and Other Supply Planning Parameters be Calculated?
One would be able to, for example:
Item #1: Simulation
Set the supply planning parameters in a way that one can simulate the impact on the overall supply plan. When using supply planning systems, inventory parameters are typically managed on a "one by one" basis. This leads to individual planners entering values without considering how inventory parameters are set across the supply network.
Item #2: Interactivity of Changes
This is the ability to see the relationship between changes to service levels and the simulated output.
Item #3: Seeing Financial Implications
This is the ability to see the impact on the dollarized inventory for different aggregate settings.
Item #4: Mass Change for Efficient Maintenance
This allow the parameters to be changed en mass or as a mass change function. Both supply planning systems are designed to receive parameters; they are not designed to develop the parameters.
 Getting to a Better Parameter Setting Capability
We developed an approach where EOQ and reorder points are calculated externally, which allows for a higher degree of control. And for the average inventory to be coestimated in a way that provides an observable total system inventory, holding cost, service level, and a picture of what is happening to the overall system. Calculating individual parameters like EOQ without an appreciation for the systemwide does not make any sense. Also, in many, perhaps even most cases, there is no reason to use EOQ for the purposes given above. Instead, an alternative custom order batching method can be created to replace EOQ. There is nothing magical about EOQ. It is not a "best practice." It will not provide you with "digital transformation." It is not "Six Sigma." You will not get a "black belt" for using it.
After observing ineffective and non-comparative supply planning parameter setting at so many companies, we developed, in part, a purpose-built supply planning parameter calculation application called the Brightwork Explorer to meet these requirements.
Few companies will ever use our Brightwork Explorer or have us use it for them. However, the lessons from the approach followed in requirements development for supply planning parameter maintenance are important for anyone who wants to improve order batching and supply parameters.