
How to Best Understand Forecast Bias
Executive Summary
- Forecast bias is distinct from forecast error and is one of the most important keys to improving forecast accuracy.
- Reducing bias means reducing the forecast input from biased sources.
- A test case study of how bias was accounted for at the UK Department of Transportation.
*This article has been significantly updated as of Feb 2021.
Introduction
Forecast bias is distinct from forecast error and is one of the most important keys to improving forecast accuracy. It is a tendency for a forecast to be consistently higher or lower than the actual value. Forecast bias is well known in the research; however far less frequently admitted to within companies. You will learn how bias undermines forecast accuracy and the problems companies have from confronting forecast bias. We will also cover why companies often refuse to address forecast bias, even though it is relatively easy to measure.
Bias as the Uncomfortable Forecasting Area
Bias is an uncomfortable discussion area because it describes how people who produce forecasts can be irrational and have subconscious biases. This relates to how people consciously bias their forecast in response to incentives. This discomfort is evident in many forecasting books that limit the discussion of bias to its purely technical measurement. No one likes to be accused of having a bias, which leads to bias being underemphasized. However uncomfortable as it may be, it is one of the most critical areas to focus on to improve forecast accuracy.
What is Forecast Bias?
Forecast bias is a tendency for a forecast to be consistently higher or lower than the actual value. Forecast bias is distinct from forecast error in that a forecast can have any error level but still be completely unbiased. For instance, even if a forecast is fifteen percent higher than the actual values half the time and fifteen percent lower than the actual values the other half of the time, it has no bias. But forecast, which is, on average, fifteen percent lower than the actual value, has a fifteen percent error and a fifteen percent bias. Bias can exist in statistical forecasting or judgment methods. However, it is much more prevalent with judgment methods and is, in fact, one of the major disadvantages of judgment methods.
After the bias has been quantified, the next question is the origin of the bias. With statistical methods, bias means that the forecasting model must either be adjusted or switched out for a different model. Grouping similar types of products and testing for aggregate bias can be a beneficial exercise for attempting to select more appropriate forecasting models.
For judgment methods, bias can be conscious, which is often driven by the institutional incentives provided to the forecaster. Bias can also be subconscious. An excellent example of unconscious bias is optimism bias, a natural human characteristic. Forecasting bias can be like any other forecasting error, based upon a statistical model or judgment method that is not sufficiently predictive. It can be quite different when premeditated in response to incentives. As the financial services industry exemplifies, bias is easy to demonstrate but difficult to eliminate.
Forecast Bias List
- Forecast bias is a tendency for a forecast to be consistently higher or lower than the actual value.
- Forecast bias is distinct from forecast error. Given the forecasted circumstances, a forecast bias can be high but with a reasonable forecast error. Alternatively, a forecast bias can be low but with a high error. For instance, in in-service part forecasting, the bias is often (that is, in data sets tested by Brightwork Research & Analysis) low, but the error usually is high.
- For instance, a forecast that is ½ the time 15% higher than the actual and ½ of the time 15% lower than the actual has no bias. A forecast that is, on average, 15% lower than the actual value has a 15% error and a 15% bias.
How Large Can Bias Be in Supply Chain Planning?
Some research studies point out the issue of forecast bias in supply chain planning. According to Shuster, Unahobhokha, and Allen, forecast bias averaged roughly thirty-five percent in the consumer goods industry. They point to research by Kakouros, Kuettner, and Cargille (2002) in their case study of forecast bias’s impact on a product line produced by HP. They state:
“Eliminating bias from forecasts resulted in a twenty to thirty percent reduction in inventory.”
Bias Identification Within the Forecasting Application
This information is publicly available and can also be tracked inside companies by developing analytics from past forecasts. Companies often do not track the forecast bias from their different areas (and, therefore, cannot compare the variance), and they also do next to nothing to reduce this bias. This is partly because companies are too lazy to measure their forecast bias.
Now, let us take a quick timeout to consider how to measure forecast bias in standard forecasting applications.
Forecast bias in most forecasting applications regarding outputting a specific metric is generally not tracked. However, one can very easily compare the historical demand to the historical forecast line to see if the historical forecast is above or below the historical demand.
The problem in doing this is that normally just the final forecast ends up being tracked in the forecasting application (the other forecasts are often in other systems), and each forecast has to be measured for forecast bias, not just the final forecast, which is an amalgamation of multiple forecasts.
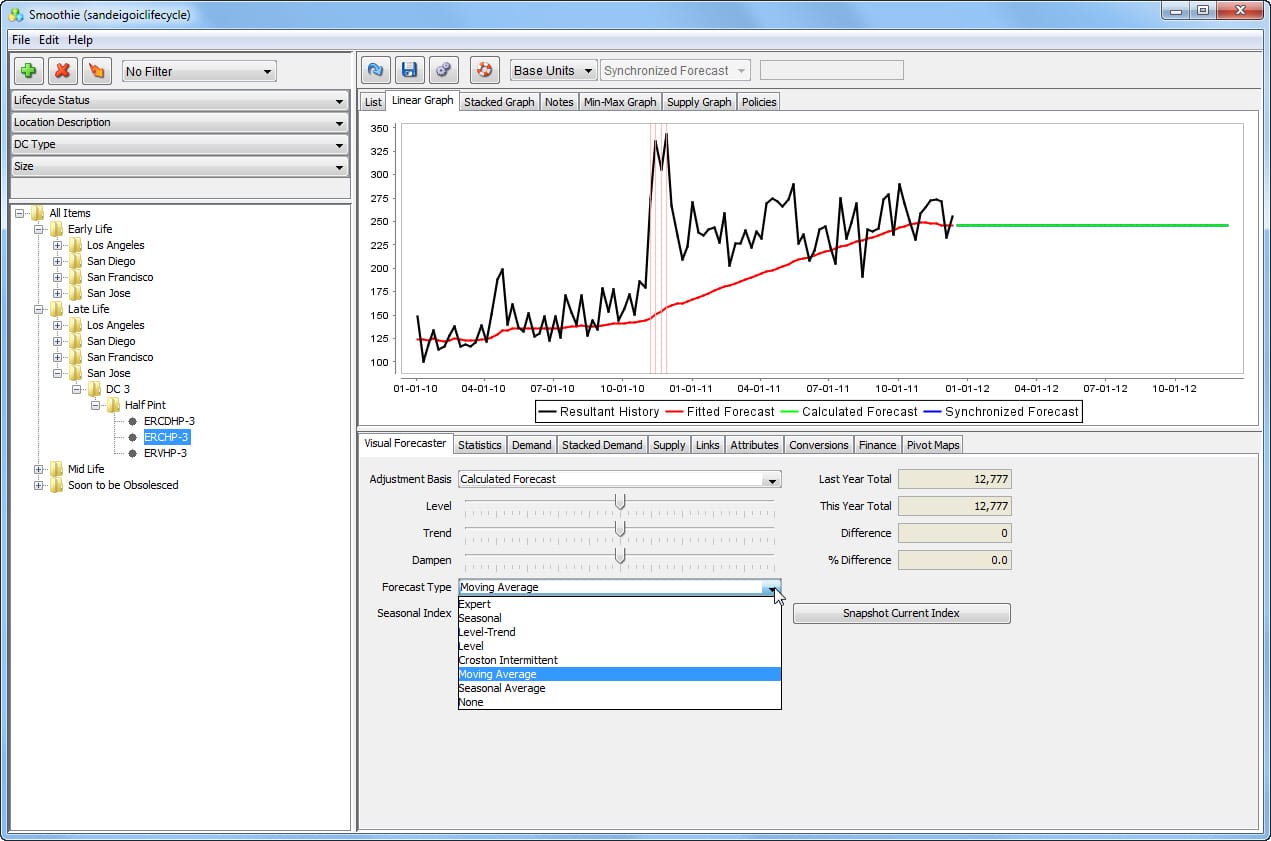
This screenshot shows how the previous forecast is lower than the historical demand in many periods.
This is a negatively biased forecast.
Although it is not for the entire historical time frame, earlier and later the forecast is much closer to the historical demand. However, this is the final forecast. To determine what forecast is responsible for this bias, the forecast must be decomposed, or the original forecasts that drove this final forecast measured.
Keeping the Illusion of Objectivity Alive
Part of submitting biased forecasts is pretending that they are not biased. Companies are not environments where “truths” are brought forward, and the person with the truth on their side wins. People are considering their careers and try to bring up issues only when they think they can win those debates. Sales and marketing, where most of the forecasting bias resides, are powerful entities that will push back politically when challenged. And these are also departments where the employees are specifically selected for their willingness and effectiveness in departing from reality. Each wants to submit biased forecasts and then let the implications be someone else’s problem. This is covered in more detail in the article Managing the Politics of Forecast Bias.
The Importance of Bias Measurement
It is amusing to read other articles on this subject and see so many of them focus on how to measure forecast bias. No complex formula is required to measure forecast bias, and that is the least of the problems in addressing forecast bias. These articles are just bizarre as every one of them that I reviewed entirely left out the topics addressed in this article you are reading. The topics addressed in this article are of far greater consequence than the specific calculation of bias, which is child’s play. One only needs the positive or negative per period of the forecast versus the actuals and then a metric of scale and frequency of the differential.
Forecast bias can always be determined regardless of a report’s forecasting application. However, it is preferable if the bias is calculated and easily obtainable from within the forecasting application. Bias tracking should be simple and quickly observed within the application without performing an export.
But it isn’t.
Of the many demand planning vendors I have evaluated over the years, only one vendor stands out in its focus on actively tracking bias: Right90. The application’s simple bias indicator, shown below, shows a forty percent positive bias, a historical forecast analysis.

Being able to track a person or forecasting group is not limited to bias but is also useful for accuracy. For instance, the screenshot of the following page is from Consensus Point and shows the forecasters and groups with the highest “net worth.” This network is earned over time by providing accurate forecasting input.
However, most companies use forecasting applications that do not have a numerical statistic for bias.
The Current State of Forecasting Bias
It’s challenging to find a company that is satisfied with its forecast. And I have to agree. I have yet to consult with a company forecasting anywhere close to the level they could. Everything from the business design to poorly selected or configured forecasting applications stands in the way of this objective. However, finding a company with any realistic plan for improving its forecast is rare.
General ideas like using more sophisticated forecasting methods or changing the forecast error measurement interval are typically dead ends. One of the easiest ways to improve the forecast is right under almost every company’s nose, but they often have little interest in exploring this option. This method is to remove the bias from their forecast.
The Biased Forecast
As pointed out in a paper on MPS by Schuster, Unahabhokha, and Allen:
Although forecast bias is rarely incorporated into inventory calculations, an example from industry does make mention of the importance of dealing with this issue. Kakouros, Kuettner and Cargille provide a case study of the impact of forecast bias on a product line produced by HP. They state that eliminating bias from forecasts resulted in a 20 to 30 percent reduction in inventory while still maintaining high levels of product availability. Similar results can be extended to the consumer goods industry where forecast bias is prevalent.
While several research studies point out the issue with forecast bias, companies do next to nothing to reduce this bias, despite a substantial emphasis on consensus-based forecasting concepts. Forecasting bias is endemic throughout the industry. However, so few companies actively address this topic.
What Type of Bias?
It’s important to differentiate a simple consensus-based forecast from a consensus-based forecast with the bias removed. However, removing the bias from a forecast would require a backbone. That is, we would have to declare the forecast quality from different groups explicitly. Few companies would like to do this.
The first step in managing this is retaining the metadata of forecast changes. This includes who made the change when they made it, and so on.
Case Study: How Bias Was Accounted for at the UK Department of Transportation
In addition to financial incentives that lead to bias, there is a proven observation about human nature: we overestimate our ability to forecast future events. We also have a positive bias—we project that we find desirable events will be more prevalent in the future than in the past. This is one of the many well-documented human cognitive biases. Cognitive biases are part of our biological makeup and are influenced by evolution and natural selection. This human bias combines with institutional incentives to give good news and to provide positively-biased forecasts.
The UK Department of Transportation is keenly aware of bias. It has developed cost uplifts that their project planners must use depending upon the type of project estimated. Uplift is an increase over the initial estimate. Different project types receive different cost uplift percentages based on the historical underestimation of each project category.
Measuring the Uplift
For instance, on average, rail projects receive a forty percent uplift, building projects between four and fifty-one percent, and IT projects between ten and two hundred percent—the highest uplift and the broadest range of uplifts. A quotation from the official UK Department of Transportation document on this topic is telling:
“Our analysis indicates that political-institutional factors in the past have created a climate where only a few actors have had a direct interest in avoiding optimism bias.”
However, once an individual knows their forecast will be revised, they adjust accordingly. Therefore, adjustments to a forecast must be performed without the forecaster’s knowledge. The UK Department of Transportation has taken active steps to identify the source and magnitude of bias within its organization. They have documented their project estimation bias for others to read and learn from. However, most companies refuse to address bias, much less actively remove bias.
Conclusion
Forecast bias is quite well documented inside and outside of supply chain forecasting. Bias is based upon external factors such as incentives provided by institutions and is an essential part of human nature. How much institutional demands for bias influence forecast bias is a fascinating field of study. It is a subject made even more exciting and perplexing in that so little is done to minimize incentives for bias. Properly timed biased forecasts are part of the business model for many investment banks that release optimistic forecasts on their investments. The so-called “pump and dump” is an ancient money-making technique. Investment banks promote positive biases for their analysts, just as supply chain sales departments promote negative biases by using a salesperson’s forecast as their quota. These institutional incentives have changed little in many decades despite never-ending talk of replacing them. However, it is well-known how incentives lower forecast quality. They persist even though they conflict with all of the research on bias.