
How to Best Understand Gartner’s Magic Quadrant
Executive Summary
- The Gartner Magic Quadrant reduces software selection efficiency through the deceptive way they are created.
- Gartner promotes large vendors over small vendors, as large vendors have the most to pay Gartner.
- The problem with the broadness of the Gartner Magic Quadrant and how they promote software acquisitions.
Introduction
The Gartner Magic Quadrant is a top-rated “research product” that Gartner uses to shake down vendors for payments to score well. Vendors are compelled to give Gartner money because, for many companies, you don’t get shortlisted if you don’t do well in Gartner’s Magic Quadrant. This gives Gartner’s Magic Quadrant tremendous power to impact the future of a software vendor. However, for how famous the Gartner Magic Quadrant is, it remains unclear how it is created and how little it can be used for software selection. You will learn from our detailed research into the Gartner Magic Quadrant.
Our References for This Article
If you want to see our references for this article and other related Brightwork articles, see this link.
Notice of Lack of Financial Bias: You are reading one of the only independent sources on Gartner. If you look at the information software vendors or consulting firms provide about Gartner, it is exclusively about using Gartner to help them sell software or consulting services. None of these sources care that Gartner is a faux research entity that makes up its findings and has massive financial conflicts. The IT industry is generally petrified of Gartner and only publishes complementary information about them. The article below is very different.
- First, it is published by a research entity, not an unreliable software vendor or consulting firm that has no idea what research is.
- Second, no one paid for this article to be written, and it is not pretending to inform you while being rigged to sell you software or consulting services as a vendor or consulting firm that shares their ranking in some Gartner report. Unlike nearly every other article you will find from Google on this topic, it has had no input from any company's marketing or sales department.
What is the Gartner Magic Quadrant?
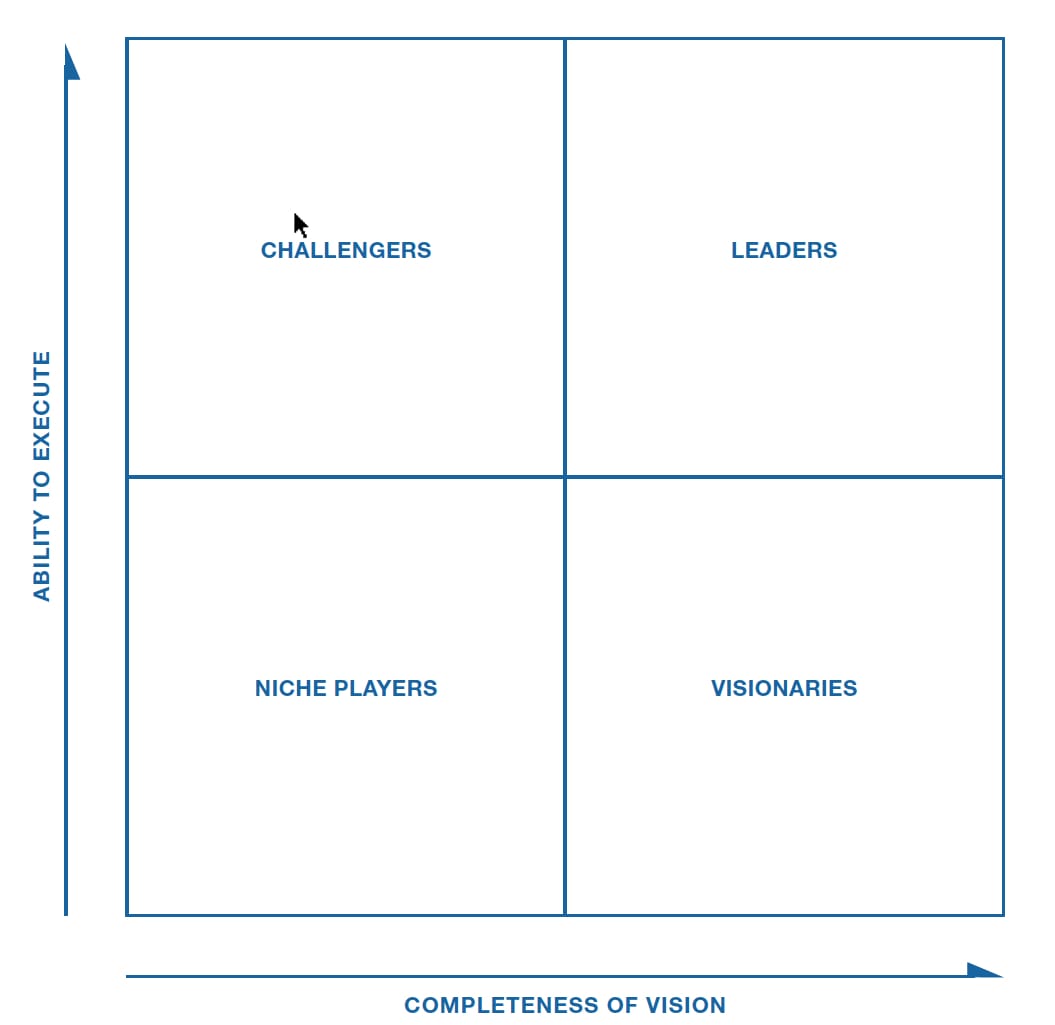
The Gartner Magic Quadrant is a well-known and straightforward graphic and is the most renowned research produced by Gartner. The Gartner Magic Quadrant places a software vendor on a matrix, with the completeness of vision on one axis and the ability to execute on the other.
People frequently ask about the Magic Quadrant how many of these graphics Gartner produces. The full list of Gartner Magic Quadrants can be found on Gartner’s website at the following link.
However, many of the Gartner Magic Quadrants produced by Gartner have been discontinued. Using Gartner’s spreadsheet, I found one hundred and twenty-six magic quadrants. However, this spreadsheet is missing several entries, as I know of Gartner Magic Quadrants that are not on the list. Furthermore, I have several Magic Quadrants from the mid-2000s that Gartner used to produce but does not list as retired Magic Quadrants.
An example of a Gartner Magic Quadrant is shown below:
According to Gartner
“Magic Quadrants depict markets in the middle phases of their lifecycle….”
Depending upon how the software vendor rates, they are placed into one of the following four quadrants. These quadrant descriptions are from Gartner’s publication Inside Gartner Research.
Gartner’s Quadrants that Make up the Gartner Magic Quadrant
- Leaders: “Leaders provide mature offerings that meet today’s market demand. These providers also demonstrate the vision necessary to sustain their leading position as the market evolves. Leaders focus and invest in their offerings in ways that impact and influence the market’s overall direction.”
- Visionaries: “Visionaries align with the Gartner view of how a market will evolve, but they have less-proven capabilities to deliver against their vision. In new markets, this status is normal. But in more mature markets, it may reflect a competitive strategy for a smaller provider (such as selling innovation ahead of mainstream demand), or a larger provider trying to break out of a rut to differentiate.”
- Challengers: “Challengers are well-positioned to execute but may not have a strategy to maintain strong, up-to-date value propositions for new customers. Larger providers in mature markets may often be positioned as challengers because they choose to minimize risk. Although challengers typically have significant human and financial resources, they may lack vision, innovation, or an overall understanding of where the market is headed. In some cases, challengers may offer products that dominate a large but shrinking market segment. Challengers can move into the leaders’ quadrant by expanding their vision.”
- Niche players: “They do well in a specific market segment or have limited ability to innovate or outperform other providers. This may be because they focus on functionality, geographic region, or new entrants to the market. Assessing niche players is more challenging than assessing providers in other quadrants. While some niche players could progress, others do not execute well and may be unable to keep pace with broader market demands.”
According to my interviews with Gartner, buyers should use the Magic Quadrant independently of Gartner’s analysts. Furthermore, buyers should not interpret a Magic Quadrant as a recommendation to concentrate on those vendors that appear in the Leader Quadrant. Gartner agrees that there is a misimpression that being categorized in the Niche quadrant is a bad thing. A vendor in a non-leader quadrant might be the best vendor for a particular buyer.
The Gartner Magic Quadrant Methodology
As previously stated, Gartner publishes only a high-level overview of how it determines the Gartner Magic Quadrant rankings. People who read Gartner’s analytical products, especially the most influential ones, can only review a high-level graphic, the research output. One must pay more to find out more details and speak with an analyst, but Gartner does publish the criteria that count towards each axis. These criteria, quoted from Gartner’s article Magic Quadrants and MarketScopes: How Gartner Evaluates Vendors Within a Market, are listed below. The asterisks are used later to explain some criteria’ categorization.
The Completeness of Vision Criterion
- * “Market Understanding: The ability of a vendor to understand buyers’ needs and translate these needs into products and services. A vendor with the highest degree of vision listens and understands buyers’ wants and needs, shaping or enhancing its vision.
- Marketing Strategy: A bright, differentiated set of messages consistently communicated throughout the organization and publicized through the Website, advertising, customer programs, and positioning statements.
- Sales Strategy: A strategy for selling products that uses the appropriate network of direct and indirect sales, marketing, service, and communication affiliates to extend the scope and depth of a vendor’s market reach, skills, expertise, technologies, and services customer base.
- *Offering (Product) Strategy: A vendor’s product development and delivery approach related to current and future requirements.
- Business Model: The validity and logic of a vendor’s underlying business proposition.
- Vertical/Industry Strategy: A vendor’s strategy to direct resources, skills, and offerings to meet the needs of market segments, including vertical industries.
- **Innovation: Marshaling of resources, expertise, or capital for competitive advantage, investment, consolidation, or defense against the acquisition.
- Geographic Strategy: A vendor’s strategy to direct resources, skills, and offerings to meet the needs of regions outside of the vendor’s ‘home’ or native area, directly or through partners, channels, and subsidiaries, as appropriate for that region and market.”
The Ability to Execute Criterion
- ** “Product/Service: Core goods and services the vendor offers that compete in and serve the market. This category includes product and service capabilities, quality, feature sets, and skills offered natively or through original equipment manufacturers, as defined in the market definition and detailed in the sub-criteria.
- Overall Viability: Includes an assessment of the vendor’s overall financial health, the financial and practical success of the relevant business unit, and the likelihood of that business unit continuing to invest in and offer the product within the vendor’s product portfolio.
- Sales Execution/Pricing: The vendor’s capabilities in pre-sales activities and the structure that supports them. This criterion includes deal management, pricing and negotiation, pre-sales support, and the sales channel’s overall effectiveness.
- Market Responsiveness and Track Record: Ability to respond, change direction, be flexible, and achieve competitive success as opportunities develop, competitors act, customer needs evolve, and market dynamics change. This criterion also considers the vendor’s history of responsiveness.
- Marketing Execution: The clarity, quality, creativity, and efficacy of programs designed to deliver the vendor’s message to influence the market, promote it is brand and business, increase awareness of its products, and establish an identification with the product, brand, or vendor with buyers. This mind share ‘can be driven by a combination of publicity, promotions, thought leadership, word of mouth, and sales activities.
- *Customer Experience: Relationships, products, services, and programs that enable clients to succeed with the products evaluated. This criterion includes the ways customers receive technical support or account support. It can also include ancillary tools, customer support programs (and their quality), user groups’ availability, and service-level agreements.
- *Operations: The vendor’s ability to meet its goals and commitments. Factors include the quality of the organizational structure, such as skills, experiences, programs, systems, and other vehicles, that enable the vendor to operate effectively and efficiently.”
The Orientation of the Gartner Magic Quadrant Methodology
Something surprising to me (and is extraordinary to many people the first time I tell them about these criteria) is that only six of the fifteen bullet points above (40%) are in any way related to the actual application offered by the vendor, which is the bullet points with an asterisk in front of them. Only two of the fifteen bullet points above (13.3%) directly relate to the application. However, these percentages are based merely upon an even weighting of the criteria. Gartner does not explain if they weigh the criteria equally, so that is all I have to go by for this analysis. After reviewing many Magic Quadrants as part of this book’s research, it appears the criteria are equally weighted.
Gartner is, of course, free to use any set of criteria that they like. However, I find that few people read their criteria, and most software buyers are under the impression that Gartner’s ratings are much more product-focused than they are. Most of Gartner’s criteria are just proxies for the size of the software vendor. Therefore, I think that it would be helpful if each Gartner Magic Quadrant were published with something like the following disclaimer:
*Gartner Magic Quadrants rate vendors on a variety of criteria, 40% of which are related generally to the application, and 13.3% are related directly to the application. For more details on the exact criteria used, see this link.
Gartner Magic Quadrant Scenarios: Large Vendor Versus Small
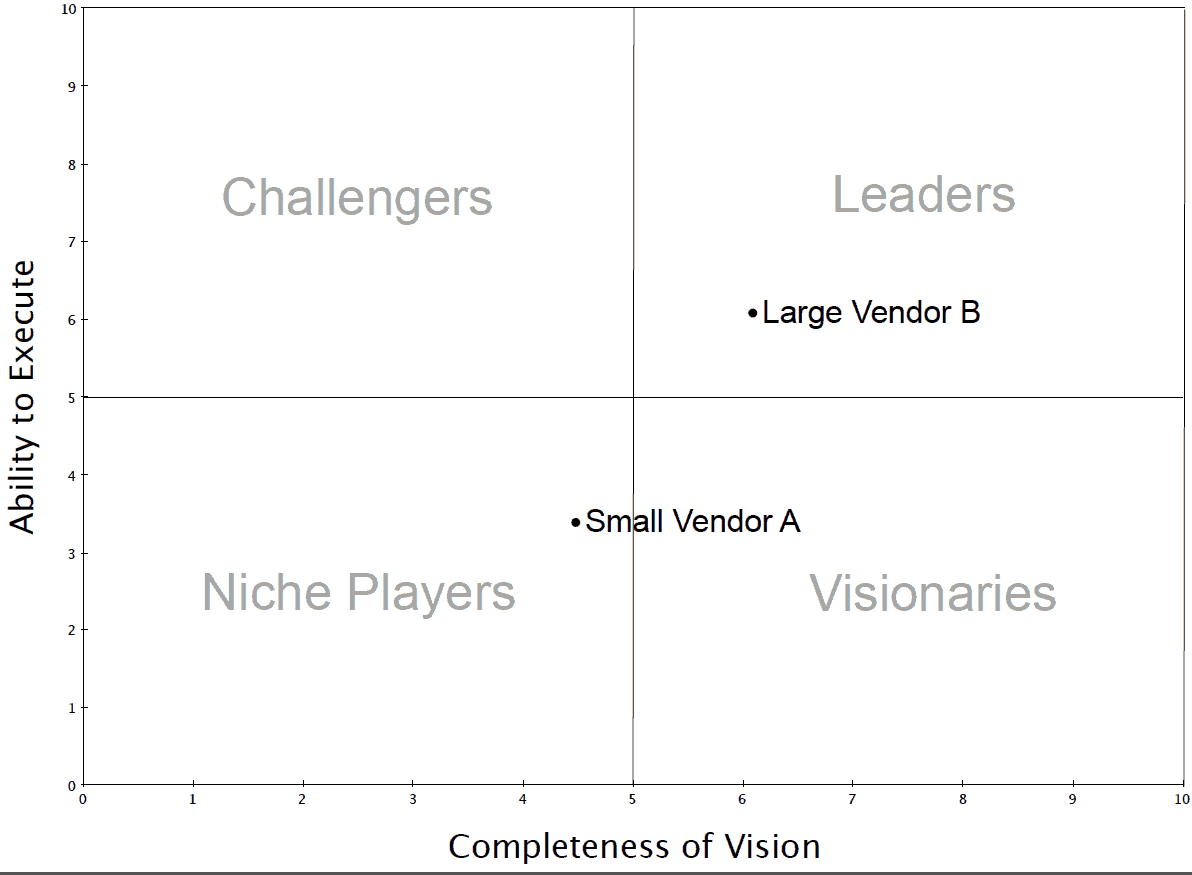
The following comparison was created to simulate how a large vendor could score well, even if it had fragile software, against a smaller vendor with the best possible rating for its software. To simulate this, I rated all product-related criteria as 2 out of 10 for the more significant vendor and 10 out of 10 for the smaller vendor. I then measured the other criteria unrelated to the product such that the more substantial vendor would score better.
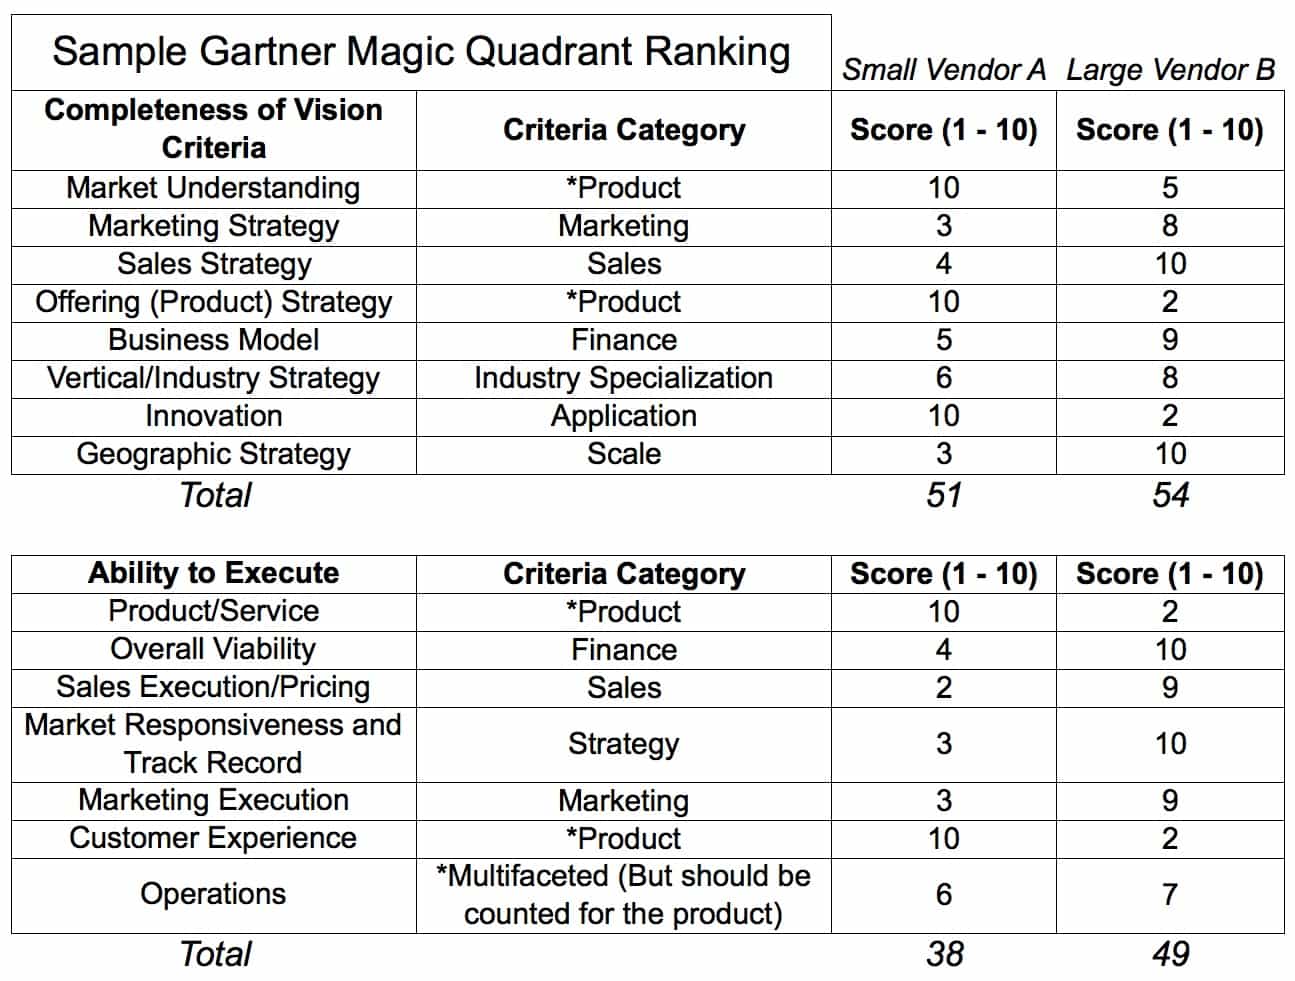
Now we can show how this rating per criteria would show on a Magic Quadrant graphic.
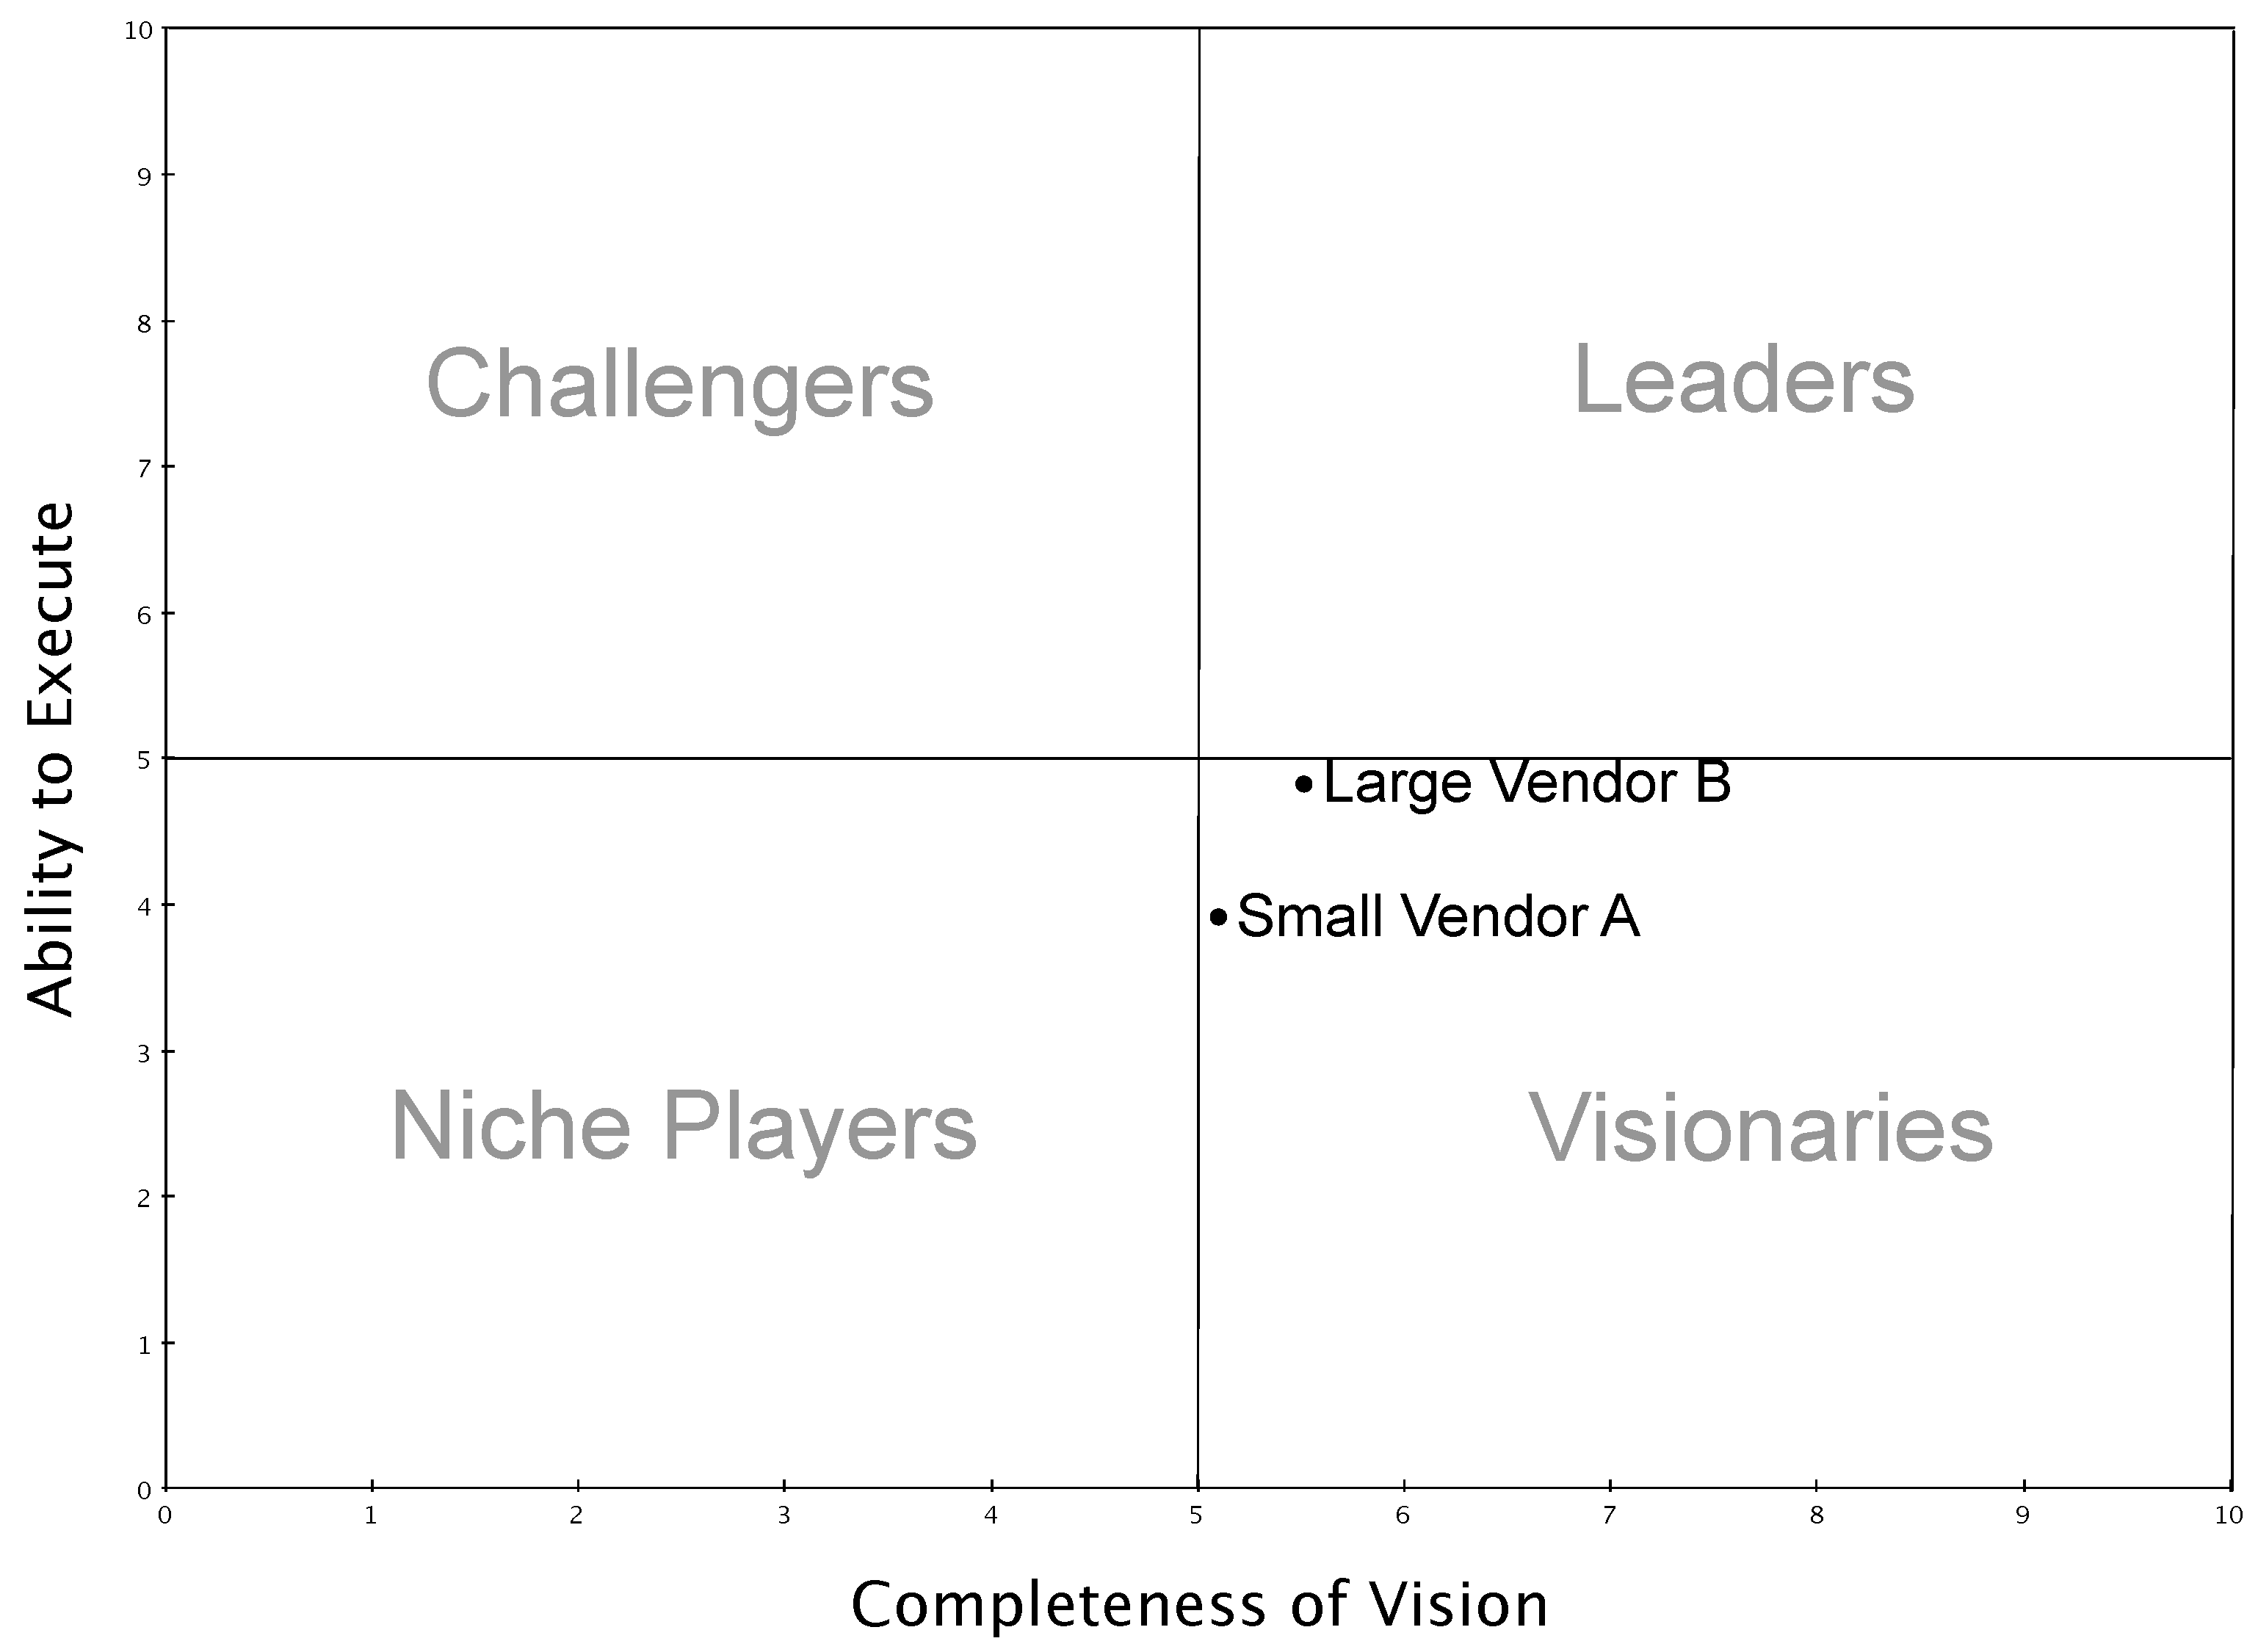
When this hypothetical example is placed on Gartner’s Magic Quadrant, the larger vendor scores higher than the smaller vendor. They both would be rated as visionaries, with the larger vendor almost in the leader category.
How can the Magic Quadrant correctly represent the scores listed in the previous graphic? A vendor with a 2 out of 10 score is neither a Visionary nor a Leader. Secondly, a small vendor cannot be considered merely a Visionary simply because it lacks sophistication in sales and marketing. If they score at the top of all product-related criteria, they are the Leader in that product space.
The Impact of Low Scores in the Gartner Magic Quadrant on the Software Vendor
If we look at the scores from the investor’s perspective, the low scores outside of the product-related criteria would probably limit the vendor’s ability to grow. However, from the software buyer’s perspective, the small software vendor would be the preferred choice because their software will be implemented more efficiently and have a far higher likelihood of success. However, it is not shown that way in the Gartner Magic Quadrant.
It should be clear from this Gartner Magic Quadrant that the criteria used by a software buyer do not match up very well with those used by Gartner. However, let’s not stop the analysis here. Instead, let’s take another example, and in this one, the more significant vendor has a more competitive product than in the last example.
In this example, we keep all the same values from the first matrix, except this time, we make all of the product-related rankings equal, setting them to 7 for both the small and large vendors.
When plotted, we see that the large vendor is now in the Leader quadrant, and the smaller vendor is a Niche player. This is true even though they both have the same rating on their product and by extension, it would be true if both companies had the same product.
How Gartner Magic Quadrant Promotes Software Acquisitions
Therefore, if a large vendor acquires a smaller vendor, its overall score in the analyzed category should increase significantly. Is Gartner telling us that it would prefer to have all small software vendors acquired by more significant software vendors? Should all software coalesce into mega software vendors? Given the history of more significant vendors with software innovation, what would be the predictable outcomes for innovation if this were to occur? These are very appropriate criteria for rating a company as an investment vehicle but are not the criteria that one would generally select if one were attempting to develop a matrix for software buyers.
Now, let’s imagine a smaller vendor that does not spend much on marketing or selling but has a great product. Here is another thought experiment with the Gartner Magic Quadrant: How would this smaller vendor with a great product fare in Gartner’s rating system?

In this example, we model a highly product-focused company that invests little in sales or marketing. However, they have a great product. For criteria that are neither sales, marketing nor product-focused, we assign an average value of 5. Let’s see how the product-focused company would fare in a Gartner Magic Quadrant.
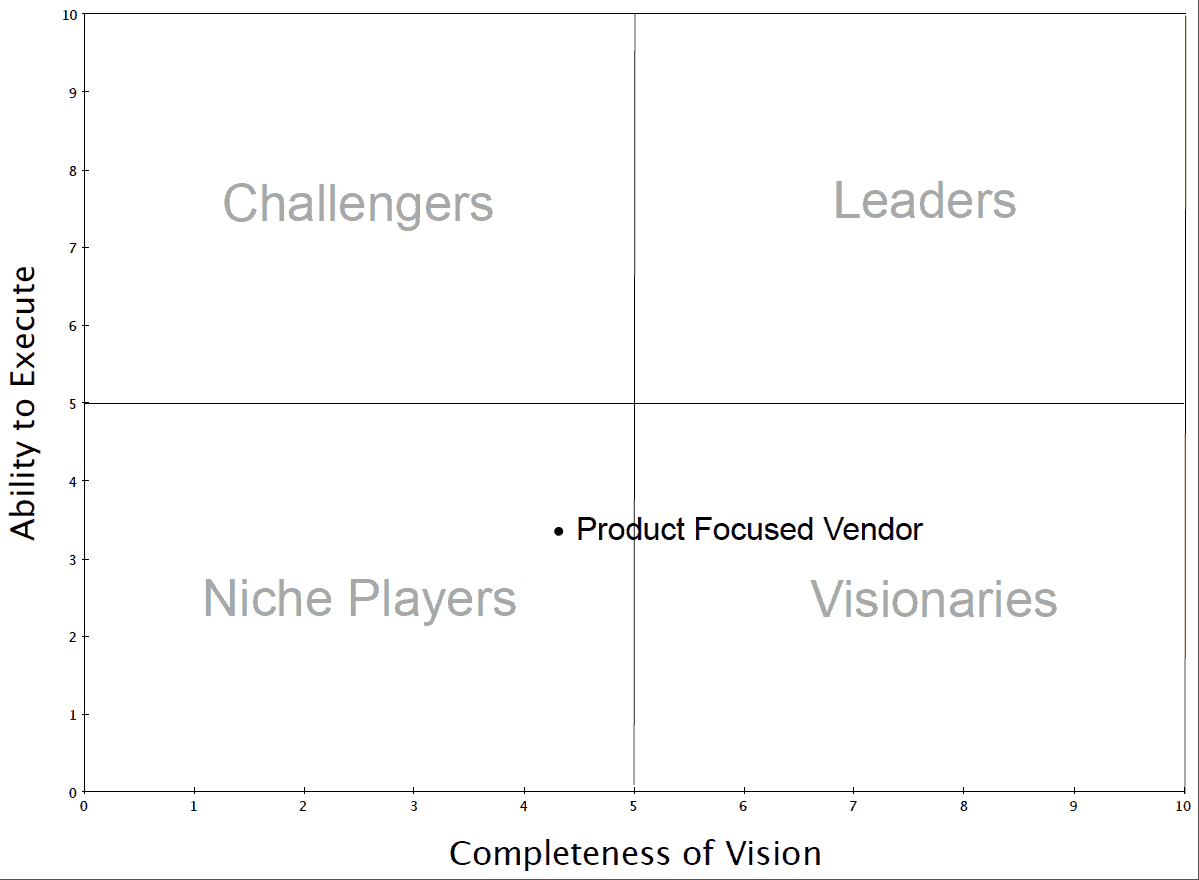
Here we see that the vendor ends up as a Niche player. In Gartner’s Magic Quadrant methodology, sales and marketing count for as much in the rating as product-related factors.
Now that we have reviewed sample Magic Quadrants, let’s consider an actual Gartner Magic Quadrant created by Gartner and look at two vendors on opposite sides of the spectrum regarding product and size.
The Problems with the Broadness of the Gartner Magic Quadrants
Gartner does not produce Magic Quadrants for every software category or every area. My software category has no Magic Quadrant for production, demand, or supply planning. These are all subcategories of the software category “supply chain planning,” Gartner does have a Magic Quadrant for this broader category. However, when a Gartner Magic Quadrant does not exist for the subcategory that a buyer is interested in purchasing, it does not work to use a Gartner Magic Quadrant for the broader category. Beyond this, I did not find articles (not only Magic Quadrants but any articles) on production planning or supply planning, which are significant software subcategories within the supply chain planning category. The best analogy I can give is that—while Honda may be a leading brand—one cannot buy a Honda. One must buy a Honda Accord or a Honda Odyssey. People, as good as Hondas are, want to see the model compared to models from competing brands.
By the same extension, it makes little sense to determine which demand planning application scores highest in Gartner’s Magic Quadrant, as brought up in the following quote by Mark Madsen. He is talking about a different software category, but the same issue applies.
How can someone take seriously ‘IBM’ or ‘Oracle’ in the quadrant? Which of the dozen or so products from a single vendor is implied for leadership? If it stated ‘Oracle Data Integration’ or ‘IBM’s DataMirror’ it would be more useful. Some vendor’s products are DOA while others are terrific. Since the evaluation is not the products but the vendors, it’s not possible to use the MQ to choose DI technology appropriate to the situation. When I’m with clients who are Gartner subscribers I have to guide them in their use of these results.
When No Gartner Magic Quadrant Exists for Your Software Category
One of the biggest obstacles that a buyer or analyst can face is when there is no Gartner Magic Quadrant for the software category of interest. When Gartner decides to create a Gartner Magic Quadrant for a group of products or a software suite, it is impossible for a company that only makes a single product to compete in that type of analysis. Secondly, a buyer shouldn’t implement multiple products from one suite. Doing this means using a vendor’s weak and stronger products. Also, once the analysis moves to a suite, the business tends to get the short end of the stick because, at that point, it becomes merely more about integration, and the functionality becomes an afterthought.
Nevertheless, software suites have been a common approach to IT implementation for several decades. While the concept was that there would be fewer integration issues if software suites were implemented, this approach has meant that the business does not get the software it needs. Software selection based on software suites does not emphasize each application but instead emphasizes the suite.
Software Suites as Anticompetitive Mechanisms
As explained in this quote from Christopher Koch of CIO Magazine, software suites are mechanisms that reduce the competition a vendor must face.
“Indeed, integration standards interfere with ERP vendors’ traditional ways of gaining and keeping customers and market share. Before the Web came along, your integration strategy was simple: Buy as many pre integrated applications from a single vendor as possible. That worked for you, and it worked extremely well for the vendor; integrated application suites fetched a high price and required long-term maintenance and support contracts that promised a steady, predictable stream of revenue from customers.” – ABCs of ERP
I have now seen many poor-performing applications implemented and a great deal of frustration from business users and managers who were not delivered applications that ever had a chance of meeting their requirements.
The Usefulness of High-Level Gartner Magic Quadrants?
Such high-level Magic Quadrants are useless to a company selecting an application, a subcategory of that Gartner Magic Quadrant. Suites reduce the more significant vendor’s incentive to offer the best products because they do not have to compete on the individual application but can compete based on integrating the suite’s applications.
If a company is looking to select one or multiple products from a suite, it isn’t easy to see how a high-level Gartner Magic Quadrant can be adjusted. Some details about specific applications can be provided in the vendor description section, but this is insufficient to support an informed decision. At this point, the Gartner analyst must be contacted, and little value can be received from the Gartner Magic Quadrant.
Adjusting for Functionality and Maintainability
Gartner employs analysts who tend to look at the more significant (biggest?) possible picture. Gartner looks at so many factors outside of how good the application is and how maintainable the solution is that these most important factors are under-emphasized. Corporate buyers should strive to obtain software that closely matches their business requirements and has the best functionality. Gartner tells buyers that the application is just one decision component. Still, the problem is that Gartner has too many factors pulling their ratings away from practical software implementation criteria. This can be addressed by checking reference accounts and asking the Gartner analyst how the various vendors performed on the surveys for functionality and maintainability.
The Supply Chain Software Category
Getting back to the supply chain planning category, I can say that no vendor rates highly across all software subcategories of supply chain planning. Secondly, some software vendors work better than others for specific requirements and some for particular industries over others. Making broad Magic Quadrants, such as supply chain planning, will drive potential buyers to review the more significant software vendors with the most comprehensive software category within the software category. For instance, here is a quotation from Gartner’s Magic Quadrant write-up on supply chain planning.
“SAP has a stronger focus that Oracle on business process and a well-established, capable platform in Advanced Planning and Optimization (APO), which covers all the functional areas of supply chain planning, according to Payne. But SAP APO lacks depth in inventory optimization and production scheduling.”
Is This Quote Correct?
I have written four books on modules in SAP’s supply chain planning suite and one on the overall suite. When looking at the above quote, it’s hard to see what it is attempting to accomplish, but the statement certainly benefits SAP. SAP’s supply chain planning suite (APO) has roughly ten modules (depending on how you count them)—some are mature, some are quite immature, and barely implemented anywhere. Each module must be evaluated independently. There is no way to cover the suite with such a high-level explanation of how it works. One of the worst things a company could do is find a single vendor for all of its advanced planning needs. It would leave significant areas of requirements unaddressed and oversimplify vendor decision-making rather than application-oriented criteria.
This is where the analyst comes in; however, I question the point of even having a supply chain planning Magic Quadrant if it is so broad that it cannot be used for specific application purchase decisions and if it promotes purchasing behavior that looks for suites—a bad value for buyers.
How to Adjust the Gartner Magic Quadrant
There is a lot to unpack and understand when using a Magic Quadrant. However, the first thing to remember is that the MQ is not merely an honest evaluation of the software. The MQ has a series of biases that are not random or coincidental. They are due to Gartner’s financial biases around how Gartner maximizes profits versus emphasizing research. Magic Quadrants must be viewed through this lens to get any value from them and keep from being manipulated by Gartner’s financial biases.
Gartner’s analysis cannot be adequately used without adjusting the research output. By most analysts’ accounts, only about twenty percent of Gartner’s research gets into a report. While Gartner publishes reports, it prefers to deliver more information by having clients consult with analysts. The downside to this, of course, is that consulting is more expensive.
Much of this book was dedicated to providing the background for the reader to understand why Gartner reports must be adjusted. Companies can, of course, contact Gartner and ask questions at a cost. Some things can be changed without contacting Gartner, and others cannot. I have included some of the most common adjustments and listed items that would require a company to contact Gartner for more information.
By making these adjustments, I believe the usability of Gartner’s research is improved considerably. Some of these rating adjustments are universal, while others depend on the company you work for.
Gartner Report Adjustment Rules
Rule # 1: Never Use Just the Gartner Magic Quadrant to Make a Purchasing Decision
This point should be self-evident, especially if you have read the rest of the book up to this point. According to Louis Columbus, “IT buyers regrettably sometimes make their entire purchasing decision just on the Quadrant alone.” It is hard to know where to begin, as there are many reasons not to do this. Still, as I have explained, Gartner’s methodology for their Magic Quadrants includes factors that have nothing to do with the benefit to enterprise software buyers. Instead, the criteria are metrics that could be used by investors contemplating buying the software vendor’s stock. Secondly, even Gartner does not want buyers or investors making decisions based merely upon the Magic Quadrant or any other research they produce. One should consider the research produced by Gartner as a “starter kit” to start the ball rolling for more analysis, contracting with Gartner for more analyst services, etc.
Rule #2: Adjust the Rankings for the Vendor’s Size
Gartner prefers large software vendors. This extensive vendor orientation is clear, and it is difficult to see how a person doing a complete analysis of this topic could find that this bias does not exist. I hope the analysis from Chapter 5: “The Magic Quadrant” has clarified that.
On the web, there are several statements by Gartner analysts that Gartner does not favor large vendors. Besides managing perception, I can’t think of a good reason for anyone to say this. To believe that Gartner does not favor large vendors, one would not understand the various Gartner methodologies and not read the Gartner research output.
A vendor’s size is not a universal positive. More prominent vendors are less responsive, mainly if the buyer is not a large client. Because bigger vendors offer a broader set of products, they continually try to capture more and more footprints within their existing clients. They will not be happy selling a single application to a client. More significant vendors focus less on their products, less on R&D, and more on marketing and their partnerships with major consulting companies.
Working with Smaller Software Vendors
I enjoy keeping up with smaller best-of-breed vendors because they have less bureaucracy and engage in far more innovation than prominent vendors. I implement the software of the significant vendors, and when I visit smaller vendors, I always feel as if I have traveled forward in time because the approaches we follow in SAP are so dated. I essentially implement approaches and technologies that have not changed since the mid-1990s. And, of course, bigger vendors are more expensive (see the section on Adjusting for Price below).
So, the bigger vendors in any Magic Quadrant are overrated by Gartner. The best way to account for this is by reducing their rating, although I cannot provide a specific percentage adjustment.
Rule #3: Inserting More Reality into Gartner’s Ratings
Generally speaking, Gartner analysts do not have hands-on experience with their rating applications. Most of the Gartner analysts have at least fifteen years of experience in their area, so it is not that they lack experience, but they usually lack implementation experience. Gartner analysts speak with people in companies that implement software, but they speak at the CIOs and vice presidents. This constant interaction with senior executives at companies that buy enterprise software is the main reason why working for Gartner is considered an excellent place to create contacts for future careers.
However, these high-level people do not use the applications they purchase; they pass along the information to Gartner analysts who are already second-hand! While executives at buyers certainly know the problems they face with implementations, overseeing implementations and working with the software are two different things.
Rule #4: Steps to Increase Reality of the Software Selection
Now that we have established that Gartner’s ratings require more reality, the question is “how.” A valid software selection will combine the high-level analysis provided by Gartner (provided either by reading research or by interacting with Gartner analysts) with a more detailed analysis of:
- How the application works
- How the employees of the company will use the application
- How it will be configured and fit in with the rest of the company’s footprint
Unfortunately, this is a lot more work and cannot be done by the decision-makers for the software selection. So, this more detailed work tends not to get done. However, if not for all the applications under consideration, it should be done at the very least for the ones the company finds the most intriguing. This applies to both buyers and investors and is accomplished by having technical resources participate in the software selection process.
I have no idea why so many executives think they are qualified to analyze pre-sales consultants’ statements. Still, usually, presentations are made to buyers with no one from the buyer’s side in the meeting who can validate the vendor’s representatives’ technical statements.
Rule #5: Finding Technical Fact-Checkers
Many times, individuals with technical backgrounds can be pulled from the buyer’s IT department. However, this is not always the case, especially if no one is familiar with the application category being analyzed. In Appendix A, I include a section on hiring independent consultants who can provide the expertise that may not be available inside your company.
Viewing demos performed by a vendor’s most skilled pre-sales consultants is not an excellent way to truly understand an application. Rather than scripted demos, a more reality-based approach allows the reviewers to ask more questions and drive more of the demo. I cover this topic in more detail in the book Enterprise Software Selection.
Rule #6: Adjusting Down the Rate of Predicted Change
Gartner tends to overestimate the amount of change that occurs in any software category and the business developments in that category. Also, Gartner will describe industry trends as being more legitimate and permanent than they are. For instance, many companies in my area have initiatives to move towards a make-to-order environment; however, most never will because of the approach’s limitations. This falls under the category of a “pipe dream.”
It’s easy to get the impression that because Gartner learns about these initiatives from senior executives within the buying companies, Gartner tends to take their word for it that most of these initiatives will succeed when, in fact, a higher percentage may fail. This dynamic applies equally to both the buyer and the vendor side. Gartner will frequently get on board with a new technology initiative before a vendor and before that initiative has had the time to prove itself. For instance, Gartner has been a significant proponent of SAP Hana in my field.
Innovations in the Larger Vendors?
I have witnessed several innovations that no IT analyst firm has written about (I covered in the book Supply Chain Forecasting Software). After a large firm has copied the technology, I assume I will read about its greatness in a Gartner report, maybe five years from now. In any case, it’s far too early for Gartner to have jumped on the Hana bandwagon, as it is mostly still in development.
As the example above demonstrates, Gartner is well-known for its Hype cycle analysis. Still, Gartner itself will help drive a Hype Cycle to the “Peak of Inflated Expectations” (using Gartner’s Hype Cycle terminology). Often, they are more swayed by how much “sense” a vendor’s explanation seems to be over how it works in practice. Unfortunately, many things seem like a good idea or make sense but don’t necessarily take flight. For example, SaaS was supposed to be the next great thing, but its adoption has been slow. Hypothetically, Gartner’s frequent interaction with buyers should enable them to keep from doing this. However, my research into their past reports indicates that this is a consistent theme of Gartner despite their access to buyers, which would allow them to validate vendors’ statements.
Buying Evaporating Trends
Therefore, Gartner’s reports should be adjusted and deferred. Whatever Gartner is predicting, it almost certainly will not happen as quickly as anticipated. It should be understood that while many buyers may be moving in a particular direction, many will not be successful. Many initiatives are simply trends; when they peter out, they are renamed. In my area, there is an initiative referred to as “lean,” a rebranding of many identical initiatives of JIT (just in time), which mostly flame out. There are now roughly half a million books on “lean,” but what is the actual impact on inventory management? Negligible. What is the benefit of consulting revenues of consultancies promoting lean concepts? Priceless.
Likewise, vendors frequently bring out new ideas and products, but most of these developments tend to be transitory, and some are just rebranding old concepts by sales and marketing. Secondly, beyond time-phasing Gartner’s predictions, many of their projections will never come to pass. When reviewing Gartner’s past predictions, I found this repeatedly. Gartner’s Hype Cycle proposes a consistent and eventual movement of technologies to the “Plateau of Productivity.” However, some technologies or ideas are never implemented broadly, and many disappear altogether.
Rule #7: Adjusting for Price
Gartner does not account for the price in its rankings. Instead, they compare all products as if they are in the same cost category. This approach creates a bias towards more expensive products. Also, Gartner’s methodology ranks more significant vendors higher. Gartner’s recommendation tends to push buyers to higher-priced products and products that result in higher consulting costs. (Larger vendors tend to have higher acquisition and consulting costs.) Therefore, it makes the most sense to adjust Gartner’s ratings for the price. Unfortunately, this is not an easy task.
Few software vendors like Arena Solutions and Demand Works post their software costs on their websites. In fact, in many years of working in software implementation, I have rarely informed of the application’s installation costs. Many vendors are cagey about their prices; among many factors, the price depends upon the number of seats and how much the software vendor wants the account. Determining the actual costs is time-consuming and requires significant interaction with the software vendor so they can “understand their requirements.”
Gartner’s Large Vendor Bias
Gartner is perfectly positioned to provide some rough approximation of the software’s cost, which could allow buyers to put some vendors out of their cost range. They are also well-positioned to estimate the different vendors’ consulting/implementation and maintenance costs per software category. However, suppose a company does not want to use a Gartner analyst to answer these questions. In that case, it can adjust for Gartner’s significant vendor bias (and, by extension, their bias towards expensive solutions bias). They can consider a smaller vendor to account for lower cost and better value if, of course, the vendor has other compelling factors. This leads to the next area of adjustment.
Rule #8: Adjusting for the Buying Company’s Size
Gartner’s bias towards more significant vendors is related partially to Gartner’s belief that companies prefer (or should prefer) to buy from the most significant vendors. However, while larger buyers may prefer to purchase more significant vendors, it is less accurate for smaller buyers. Of course, Gartner’s largest customers are the biggest companies in the world.
I do not know if smaller buyers would prefer buying from larger buyers if they could afford to do so, but the fact is that smaller buyers often can’t. Generally, small innovative vendors offer point solutions, have small deal sizes, and sell to small buyers. As the vendor grows, it can increase the size of buyers it sells. Therefore, Gartner’s ratings fit large buyers’ preferences (and checkbook) far more than they do for smaller companies. Experience over time will let the smaller buyers know who they can afford to buy from, so for smaller buyers, it is a simple matter to remove all or the majority of the largest vendors from their list and focus on the other vendors.
Sharing This Article
Share this article with a friend or family member by copying this article link and pasting it into your email so they can read the same information.