
How Accurate is ShadowStats on The Understatement of US Inflation With the New CPI?
Executive Summary
- In the early 1990s, the US Government changed the way it calculated the CPI.
- The question is whether this change has led to a large underestimation of inflation.

Introduction
The US Government statistics are accepted by nearly all for valuing economic indicators and the price of things, a well as the change in the price level over time. However, there are open questions about the true inflation level versus the US government reported level of inflation.
Our References for This Article
If you want to see our references for this article and other related Non Status Quo articles, see this link.
The Long Term Results of Inflation
To begin, let us just look at the inflation level according to US government statistics.
A significant effect of those that do not want to put their money at risk is that it declines due to constant inflation. While a 2% inflation rate sounds small, over long periods of time, it has a very strong effect on the purchasing power of a currency.
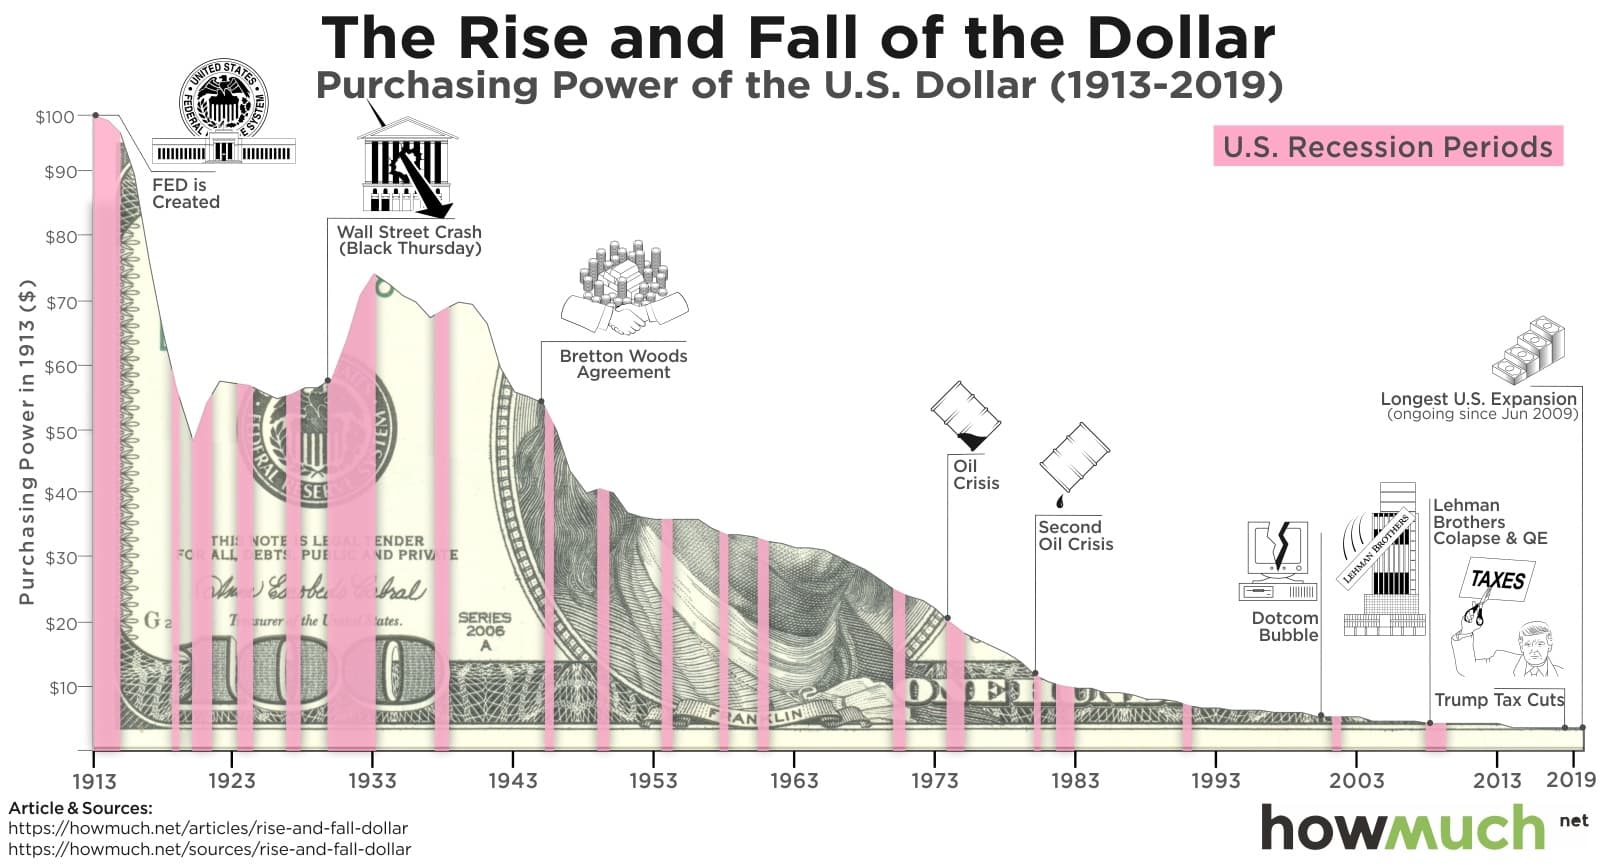
Hold on to your money over a long period of time without putting it at risk, and the US government punishes you by eroding its value.

This image shows a shorter time frame and is a little easier to see.
This is covered by Wikipedia in the following quotation.
Over time, the compounded effect of small annual price increases will significantly reduce a currency’s purchasing power. (For example, successfully hitting a target of +2% each year for 40 years would cause the price of a $100 basket of goods to rise to $220.80.) This drawback would be minimized or reversed by choosing a zero inflation target or a negative target.
However, policymakers feel the drawbacks are outweighed by the fact that a positive inflation target reduces the chance of an economy falling into a period of deflation.
Official Versus Real Inflation Rate
The problem is that the story is even worse than what is presented above. This is because the inflation numbers covered up to this point have been the official US Government reported inflation rate. However, the official rate is not the actual rate as the US Government minimizes the reported inflation rate as it allows the US Government to pay out less in things like Social Security. Another benefit is to businesses for things like the minimum wage being moved upward only occasionally, which the unstated inflation is a yearly event.
Notice the following living wage versus the minimum wage. This is for the state of Alabama, which has a relatively low cost of living versus the minimum wage.
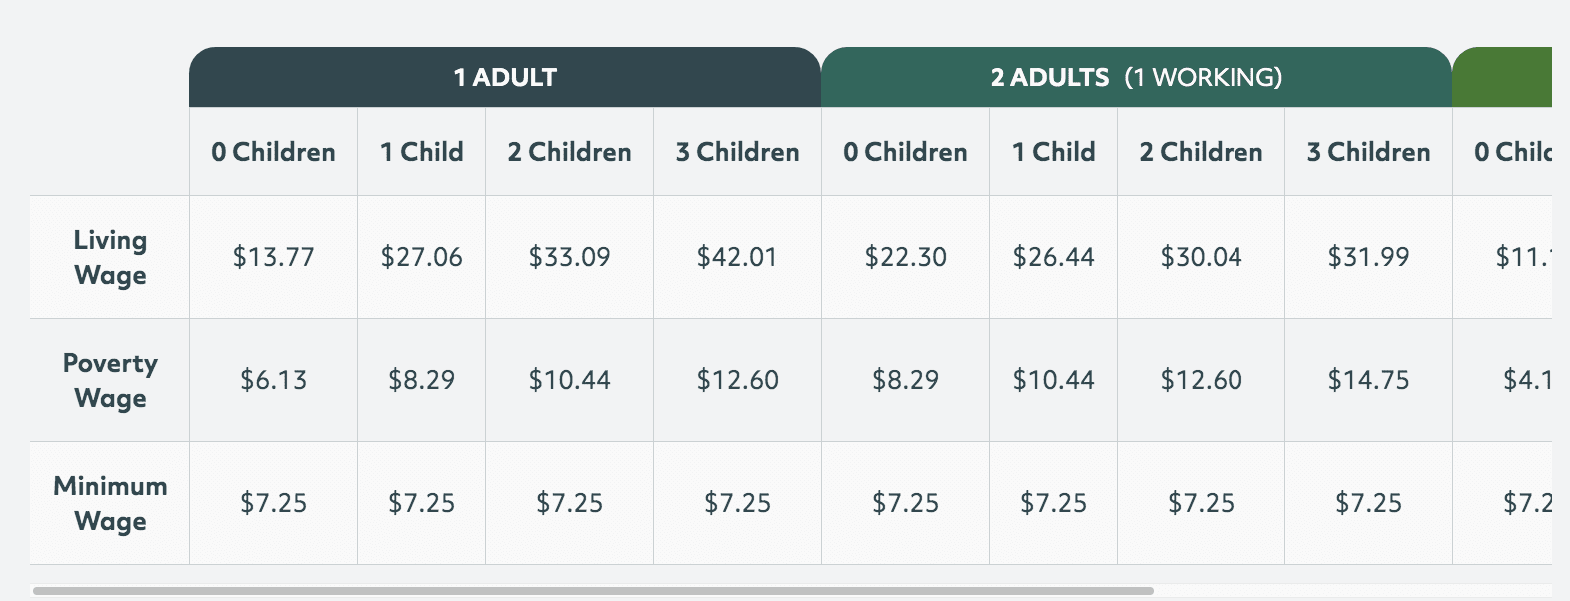
Even at the lowest level of expense, a single person with no children, the living wage is 1.899 or almost 2x the minimum wage. As soon as the number of children supported by one earner increases to two, the differential between the living wage and minimum wage is 4.5x.
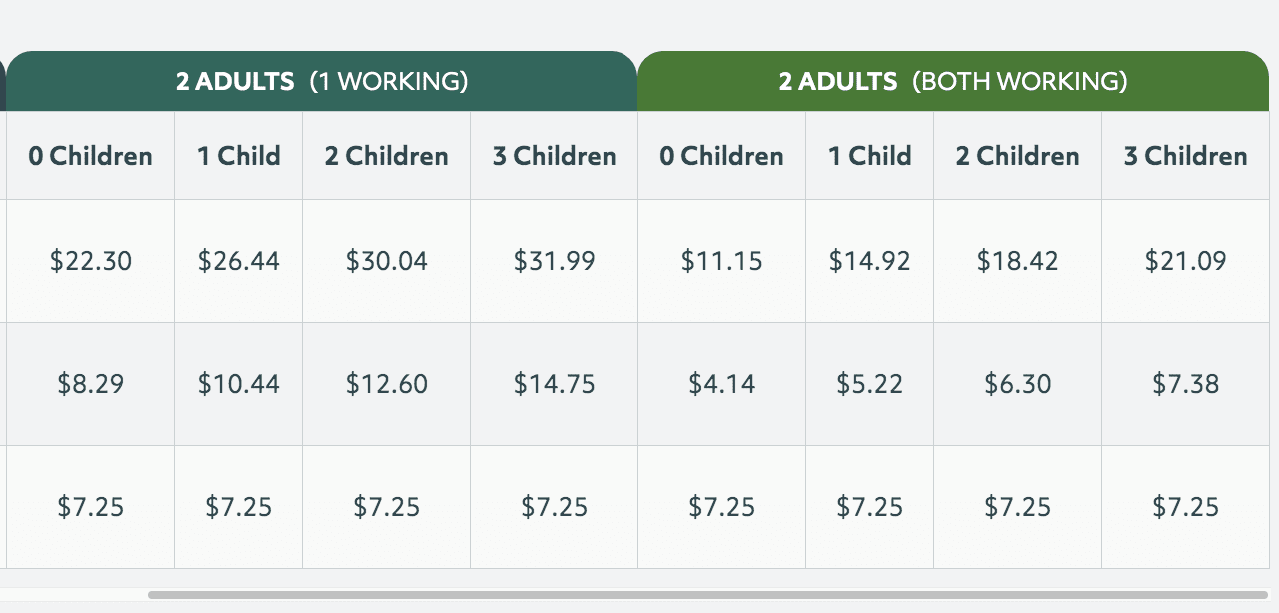
Scrolling right on the website shows that with 2 adults working and with no children, the living wage is still 1.5x the minimum wage.
How did this happen?
Well, the minimum wage has not been increased for many years. It is not indexed to the CPI, however, even if it were, it would not keep up with the real inflation level. Businesses lobby the government not to increase the minimum wage, and this allows companies to engage in a type of wage theft.
Political analyst Jimmy Dore points out what the establishment media won’t that the Democrats gaslight their constituents on increasing the minimum wage. Republicans don’t have to gaslight, as their brand is already that they believe any minimum wage is “anti-market.”
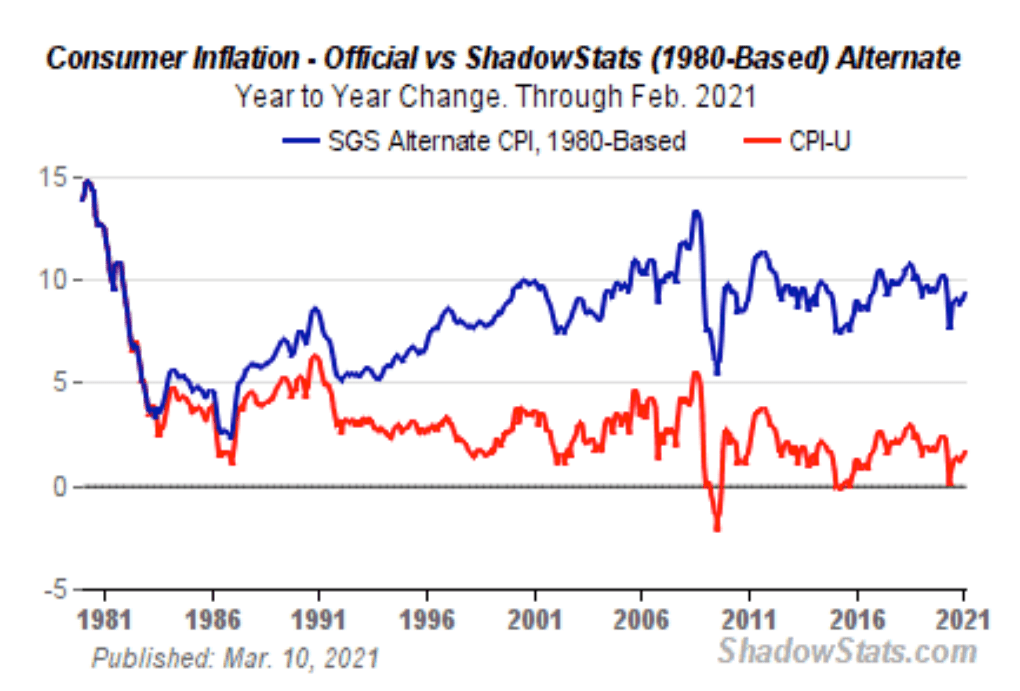
The inflation reported at Shadow Stats reports their inflation calculation versus US Government statistics.
This is explained by Shadow Stats as follows:
In general terms, methodological shifts in government reporting have depressed reported inflation, moving the concept of the CPI away from being a measure of the cost of living needed to maintain a constant standard of living.
In the last 30 years, a growing gap has been obvious between government reporting of inflation, as measured by the consumer price index (CPI), and the perceptions of actual inflation held by the general public. Anecdotal evidence and occasional surveys have indicated that the general public believes inflation is running well above official reporting, and that public perceptions tend to mirror the inflation experience that once was reflected in the government’s formal CPI reporting.
The growing difference in perception versus reality primarily is due to changes made over decades as to how the CPI is calculated and defined by the government. Specifically, changes made to the definition of the CPI and related methodology in recent decades have reflected theoretical constructs offered by academia that have little relevance to the real-world use of the CPI by the general public. Importantly, the public usually has not been aware of or understood these changes.
In the first half of the 20th century, though, the concept of a “constant level of satisfaction” evolved in academia, as a “true cost of living” concept. The general argument was that changing relative costs of goods would result in consumer substitution of less-expensive goods for more-expensive goods. Allowing for a substitution of goods within the formerly fixed-basket, the maximization of the “utility” of money held by consumers would allow attainment of “constant level of satisfaction” for the consumer.
In the early-1990s, political Washington moved to change the nature of the CPI. The contention was that the CPI overstated inflation (it did not allow substitution of less-expensive hamburger for more-expensive steak). Both sides of the aisle and the financial media touted the benefits of a “more-accurate” CPI, one that would allow the substitution of goods and services.
Before going further, let us review ShadowStats’ estimate of the true CPI versus the US Government’s reported CPI.
See the link for this article at ShadowStats.
Up until around 1982, the ShadowStats CPI estimate is identical to the US Government’s CPI reported numbers. ShadowStats’ estimate of CPI diverges in the early 1980s, however, after around 1992 to 1993, it diverges very significantly. This looks to reach a high point of divergence around 2001, that divergence growth slows but still grows until the present day. In 2001 the divergence appears to be around 6.5 percentage points. By 2021, the divergence is 8.5 percentage points!
If the ShadowStats’s estimate is correct, it means that a change rolled out to the CPI in the early 1990s, which resulted in perhaps a 1.5 percentage point change, ramps up over three decades to where it is now.
This matches with when ShadowStats says the method of the CPI calculation was changed. And it should be noted that it is not only ShadowStats making this observation. It is known and published that the method of the CPI calculation was changed at this time by the US government. However, most official sources do not critique this change as leading to a large and growing underestimate of the CPI.
Some more quotes from ShadowStats are instructive.
The plan was to reduce cost of living adjustments for government payments to Social Security recipients, etc. The cuts in reported inflation were an effort to reduce the federal deficit without anyone in Congress having to do the politically impossible: to vote against Social Security.
Furthermore, the people involved in leading the charge to change the CPI are extremely shady characters who have proven to be wrong on their major assertions — as the following quote explains.
Back in the early winter of 1995, Federal Reserve Board Chairman Alan Greenspan testified before the Congress that he thought the CPI substantially overstated the rate of growth in the cost of living. His testimony generated a considerable amount of discussion.
Federal Reserve Chairman Alan Greenspan and Michael Boskin, then chairman of the Council of Economic Advisors, were very clear as to how changing or “correcting” the CPI calculations would help to reduce the deficit. As described at the time by Robert Hershey of the New York Times, “Speaker Newt Gingrich, Republican of Georgia, suggested this week that fixing the [CPI] index, with its implications for lower spending [Social Security, etc.] and higher revenue [tax bracket adjustments], would provide maneuvering room for budget negotiators …”
“[Katherine] Abraham, the Clinton bureau [of Labor Statistics] commissioner, remembers sitting in Republican House Speaker Newt Gingrich’s office:
“ ‘He said to me, If you could see your way clear to doing these things, we might have more money for BLS programs.’ ”
Right in this last quote, it is clear that the emphasis or the motive was to play financial games, not to accurately reflect the true CPI. And this comment by Gingrich was a way of bribing Abrahams to get on board with the change.
Left of this presentation is a change like this would mean that the future CPI would be entirely incomparable to the previous CPI. One cannot change the method of calculation of the CPI and say that it is still the same metric. The old CPI metric should have been continued to have been reported, not eliminated. And not a new CPI metric put in its place under the false impression that the new CPI had anything to do with the old CPI. By doing this, the US government cheated Social Security recipients out of what was legally due to them. This is explained in the following quotation from ShadowStats.
The earlier changes had the impact desired by the politicians. Without them, Social Security checks would be more than double (emphasis added) what they are today.
And this is just the tip of the iceberg of problems.
This is explained in the following quotation from ShadowStats.
Since the 1700s, consumer inflation has been estimated by measuring price changes in a fixed-weight basket of goods, effectively measuring the cost of living of maintaining a constant standard of living.
Allowing substitution of lower-priced and lower-quality goods in the basket (i.e. more hamburger when steak prices rise) lowers the reported rate of inflation versus the fixed-basket measure.
BLS introduced: Geometric weighting—a purely a mathematical gimmick that automatically reduces the weightings of goods rising in price, and vice versa—it has no demonstrated relationship to consumer substitution of goods based on price changes. It was explained as a surrogate for a substitution measure.
BLS introduced: More frequent re-weightings of the CPI index from every ten years to every two years, which moved the CPI closer to a substitution-based index, but the change was not considered a change in methodology.BLS introduced: Ongoing re-weightings of sales outlets (discount/mass-merchandisers versus Main Street shops), also moving closer to a substitution-based index and creating other constant-standard-of-living issues.
This just reinforces that the change to CPI calculation has nothing to do with accuracy, and everything to do with politics. Once the change was implemented and the CPI corrupted, as time passed, the differential between the new CPI and actual inflation continued to grow.
Removing Home Prices from the New CPI
A major part of the new CPI is the change in how home prices are incorporated. Notice the following trickery.
On the weighting front, it is worth considering that fully 24.0% of the total current CPI-U inflation reporting reflects the category of “homeowners’ equivalent rent of residences.” Instead of reflecting some measure of home prices, as was the case before 1983, the BLS estimates the cost of housing based on what homeowners theoretically would pay to themselves in order to rent their own homes from themselves. The BLS then estimates how much homeowners raise the rent on themselves each month. Starting in 1989, the BLS “improved” these estimates by beginning to adjust that imaginary series for hedonic quality adjustments.
This is obvious sophistry.
Why would any CPI estimate need to remove the cost of housing and have it replaced with some strange number that is a pseudo proxy for what is an easily obtainable real estate index? The question answers itself.
Out With the Old In With the New
Once the new CPI was created, the US Government would not want the old CPI calculated or distributed as it would have shown how illegitimate their new CPI estimation. However, ShadowStats reconstituted this old CPI calculation, which is what you see in the chart above. This is covered by ShadowStats in the following quotation.
The ShadowStats-Alternate Consumer Inflation Measures were created by reverse-engineering the CPI-U-RS series, and adding in estimates of the inflation effects of factors not otherwise estimated by the BLS, such as more-frequent (two-years versus ten-years) reweighting of the CPI series.
The two ShadowStats series are based on the methodologies in place as of 1980, and separately as of 1990. The estimated lost inflation is added back in, over time, as described in the methodology (1980-based) published each month in the Commentary that covers the CPI reporting:
Over the decades, the BLS has altered the meaning of the CPI from being a measure of the cost of living needed to maintain a constant standard of living, to something that neither reflects the constant-standard-of-living concept nor measures adequately most of what consumers view as out-of-pocket expenditures.
See the link for this article at ShadowStats.
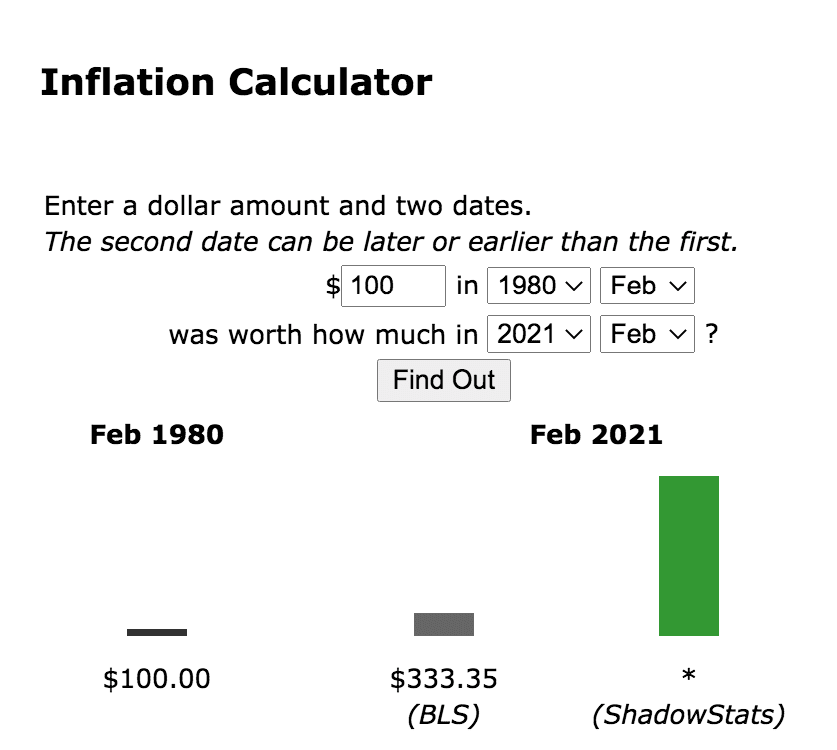
Naturally, the Old CPI-base inflation calculator substantially differs from the old CPI inflation calculator. It is mind-bending to see the difference. It is difficult to process. It appears to be a multiple of at least 6x the New CPI-based inflation calculator.
My observation is that this is too high. I don’t think that $100 in 1980 is now worth somewhere around $10.
Time for More Cheating and Even Higher Inaccuracy in the Cost of Living Calculation
As much distortion and cheating that the new CPI has enabled, politicians are now pushing for an even less reflective CPI, which is called C-CPI. This is explained by ShadowStats in the following quotation.
Arising from its second, premature political burial, the C-CPI looks again like it has a strong chance of being used as a new federal parasite to drain consumer liquidity. Like a vampire bat that sucks only enough blood for self-nourishment—leaving its victims alive for further abuse—the use of the C-CPI as a cost-of-living adjustment (COLA) measure is designed to suck real disposable income from the limited cash-flow of Social Security recipients, for the benefit of politicians who do not have the guts to vote against Social Security. Those receiving, or who will be receiving Social Security payments were forced to pay into the system for all of their working lives, and generally believed the U.S. government would treat them fairly and honestly. The government must be honest with its citizens. If the government cannot afford to pay full COLAs, it is better to indicate that upfront, rather than to try to fool individuals as to the actual level of inflation they have to overcome in order to maintain their living standards. Cutting benefits by stealth and deceit may be politically expedient for the miscreants playing this game, but it is utterly unconscionable.
This is critical to get approved because the US is likely headed for much higher inflation in the future, and a new even more falsified CPI is necessary to keep the masses in the dark over true inflation.
Distorting all Economic Statistics
The effect of the new faux CPI has been to distort the accounting of all assets and economic activity as everything in the US is denominated in dollars. This is expressed in the following quotation from ShadowStats.
Separately, to varying degrees, artificially-depressed inflation rates have created misleading indications of economic growth in major economic series, including the GDP, industrial production and real retail sales, as deflated by the appropriate inflation measures.
Yes. If inflation is not 2% but 9%, and 9% growth is reported on something — then, in reality, there was no growth. Normally statistics are reported nominally, and it is incumbent upon the reader to subtract inflation. However, the vast majority of the population, even those that work in finance go off of official US statistics and so have no idea what the correct inflation rate is. This, more broadly, allows the US Government to both hide recessions (as the GDP is denominated in US dollars) and to exaggerate the growth statistics.
How Widely is the Faux New CPI Known?
ShadowStats is the primary promoter of the concept of a faux CPI. However, the website only receives around 75,000 visits a month. This is small considering the importance of this information. This indicates that globally only a small percentage of financially knowledgeable people are aware of this issue.
Criticism of ShadowStats
Of course, the most important factor is whether ShadowStats is correct. I was able to find this criticism of ShadowStats.
Shadowstats is built on the belief that the Bureau of Labor Statistics changed their methodology in the 1980s and 1990s, and that if we were using their original methodology the level of inflation would be much higher. Shadowstats presents what they claim to be the original methodology. But Shadowstats is not calculating inflation any differently. They are not using the 1980s or 1990s methodology that they believe would be higher. All Shadowstats is doing is taking the CPI data and adding on an arbitrary constant to make it look like inflation is higher! This should be obvious from their data, which has the exact same curve as the CPI data at a higher level: –
Williams further clarified the Shadowstats methodology. Here’s what John said to me: “I’m not going back and recalculating the CPI. All I’m doing is going back to the government’s estimates of what the effect would be and using that as an ad factor to the reported statistics.” – Azizconomics
The unfair part of this criticism is that ShadowStats does not have the resources of the US Government. It is likely a one-man operation. And ShadowStats’ method may be overestimating inflation. However, there is little doubt that the New CPI is understating inflation. For one, the changes made to the New CPI were clearly intended to reduce the reported inflation rate, and secondly, Boeskin, Greenspan, and Gingrich throughout their careers always displayed both dishonesty and also nefarious intent against the general public in favor of the elites.
For how important this topic is, there is far too little analysis of ShadowStats claims.
What Does the Highly Credible CEPR Think About ShadowStats?
I looked up this topic on the Center for Economic Policy Research (CEPR), and I did find a reference to ShadowStats, but their comments about ShadowStats were more in passing.
Let us review what the CEPR said about ShadowStats.
However, since one would have to struggle to find any evidence of inflationary pressures in recent economic data, Einhorn chooses to invent his own evidence:
“Government statistics are about the last place one should look to find inflation, as they are designed to not show much. Over the last 35 years the government has changed the way it calculates inflation several times. According to the Web site Shadow Government Statistics, using the pre-1980 method, the Consumer Price Index would be over 9 percent, compared with about 2 percent in the official statistics today.”
“doesn’t even take into account inflation we ignore by using a basket of goods that don’t match the real-world cost of living. (For example, health care costs are one-sixth of G.D.P. but only one-sixteenth of the price index, and rising income and payroll taxes do not count as inflation at all.)”
And then this quote from a 2012 CEPR article.
Fingleton probably does go overboard in a few areas. First, Shadowstats is not a credible source. There are issues with the official statistics in the U.S. (as is the case everywhere), but the idea that we have overstated growth by 2 percentage points a year does not pass the laugh test.
So CEPR obviously disagrees with the ShadowStats estimates. But why has the CEPR not written an article on this topic? Because the government’s official statistics are also obviously not correct.
The CPI was changed significantly in the early 1990s. What does the CEPR think is the correct level of inflation? I would like to know. This comment seems to handwave away the issues brought up by ShadowStats, which is odd because The CEPR is an expert at doing detailed and unbiased analysis. If we only use the laugh test, then it means there are all sorts of false claims that sound incorrect but aren’t incorrect. But do you know what does not pass my laugh test? The New CPI.
What Does the EPI Say About ShadowStats?
I looked up this topic on Economic Policy Institute and could not find an article related to ShadowStats or alternative inflation estimation.
What Does the AIER Say About ShadowStats?
I was able to find a reference to the website American Institute of Economic Research (AIER). AIER calculates an Everyday Price Index, which they explain as follows.
The EPI tracks a subset of prices from the broader Consumer Price Index (CPI) reported by the Bureau of Labor Statistics (BLS). The CPI includes prices of all goods and services purchased by a typical urban consumer. The EPI, in contrast, includes only goods and services purchased on a day-to-day basis that cannot be easily postponed or forgone.
These include everyday items such as food, utilities, fuel, prescription drugs, telephone services, etc. The EPI excludes infrequently purchased items, such as cars, appliances, furniture, or apparel. Purchases of such products can be planned for or postponed, eliminating unexpected shocks to household budgets. The EPI also excludes the cost of housing, which can be contractually fixed for at least several months (in the case of rents) or several decades (in the case of mortgage payments).
An important word of caution: The EPI should not be interpreted as an improved inflation measure. Rather, it follows prices that are more relevant to families’ everyday planning.
The last quote is interesting.
My question is why not?
The New CPI has been manipulated. We need a test of the New CPI versus the real inflation level. Now notice this quote from AIER.
Our analysis shows that everyday prices and the CPI began to diverge after 2001. This split suggests that everyday prices no longer follow the same trend as the overall price index.
That is what I noted when observing the ShadowStats price, but that was the second divergence. The first divergence was around 1992. But it widened in 2001.
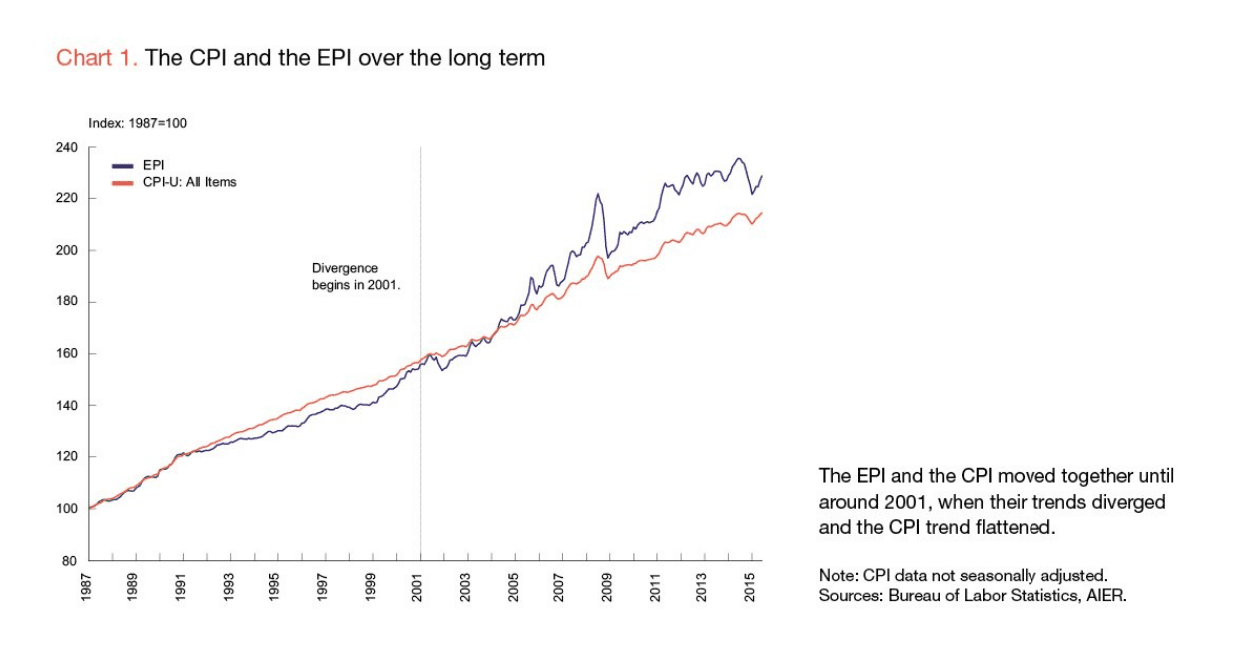
While the new EPI is not significantly different from earlier versions, it differs greatly from the more widely known CPI. It may be a more relevant index than the CPI for families trying to budget for everyday expenses. Chart 1 suggests that the EPI and the CPI moved closely together until sometime in the early 2000s, when their trends diverged. The trend in the CPI became flatter than the EPI, resulting in a substantial cumulative difference between the two indexes today.
Hmmmmmm…now why would that be? We now have two indexes that are differing greatly from the New CPI.
Let us review the AIER EPI.
So the EPI and CPI are very close until 2001 — which of course is different than ShadowStats. However, in around 2005, it diverges and it also increases — just like the ShadowStats estimate. The present level of divergence is much smaller, around 10%.
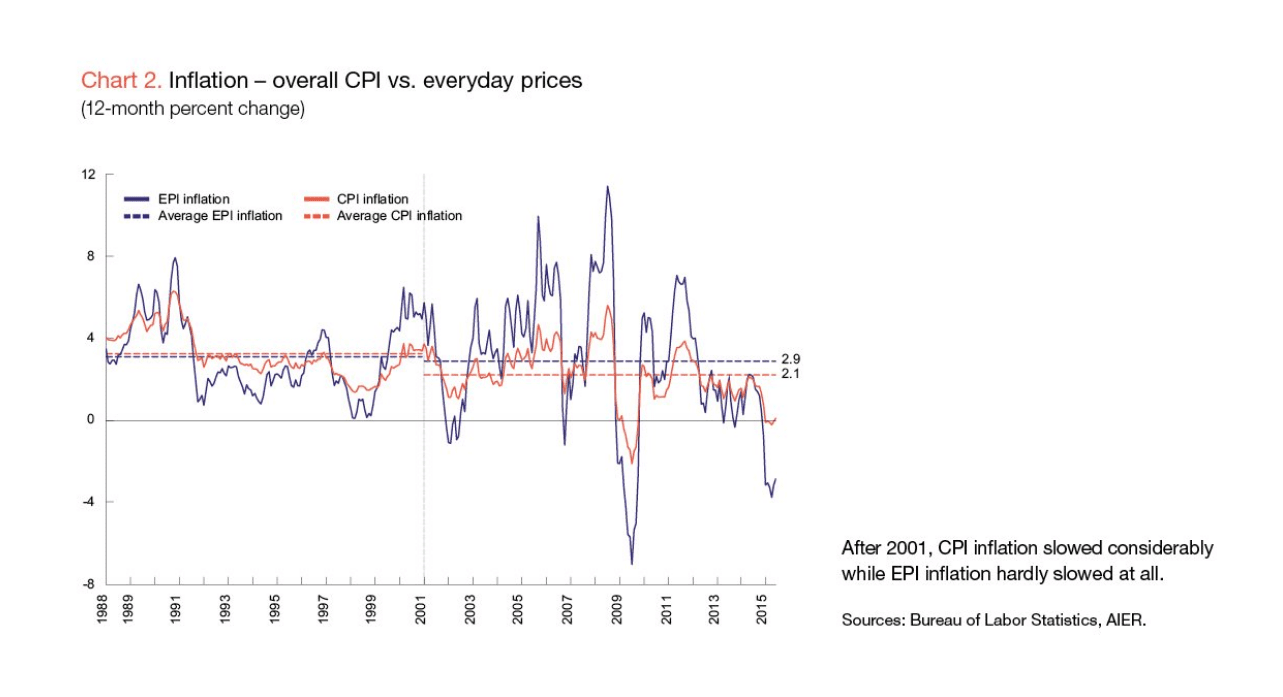
Now we have a different view. But the conclusion looks different. This graphic shows a larger difference and is consistent with what AIER has reported. If we look at 2009, the difference is around 8 percentage points. But if we look at 2010, the differential is around 4 percentage points, but this time the EPI shows greater deflation than the CPI. Since 2012, both the CPI and EPI have shown extremely low inflation, at around 2%.
Conclusion
The US Government changed the CPI in the early 1990s with the stated purpose of making a more government-friendly inflation estimate. The changes made by the US Government to the CPI or Old CPI do not make sense if the intent is accuracy. The ShadowStats estimates look to be too large, but the estimates by AIER look to be too small.
- Given the importance of this topic, there has not been very much effort into creating a reliable CPI.
- It is a complex topic because some things have gone up while others have gone down. The cost of electronics has gone down, but almost no electronics are made in the US.