
How Important is Load Speed To Keeping Users on The Website?
Executive Summary
- It is presented to those who read about website management that page speed is extremely important to visitor retention.
- We test this commonly stated rule using our website traffic.

Introduction
The proposal heard throughout the web is that users leave websites if they don’t load very quickly. I was thinking of using AWS CloudFront to address the latency I noticed outside of the US in the latency map.
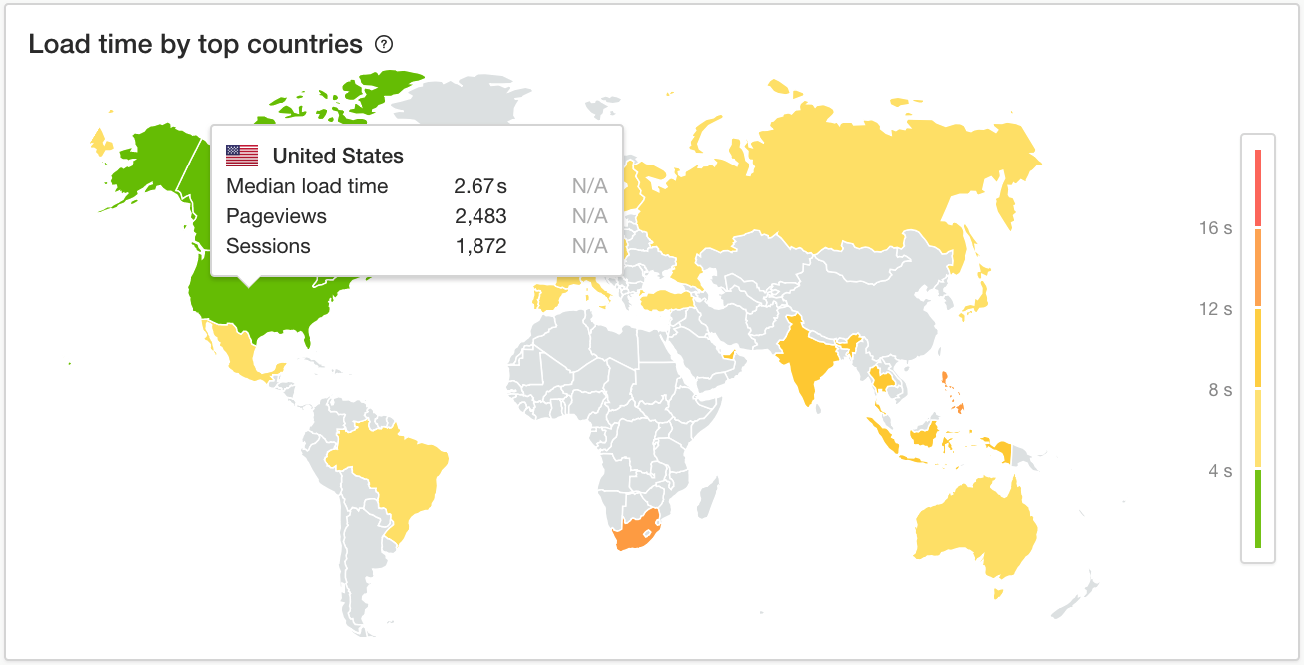
These are statistics for one week of web traffic. The host for the Brightwork website is based in the US.
- Latency partially causes countries further away to load the Brightwork web pages more slowly.
- Although some countries have better Internet infrastructure than others, for instance, there are differences in load time in Western Europe, even though these countries are relatively close to each other.
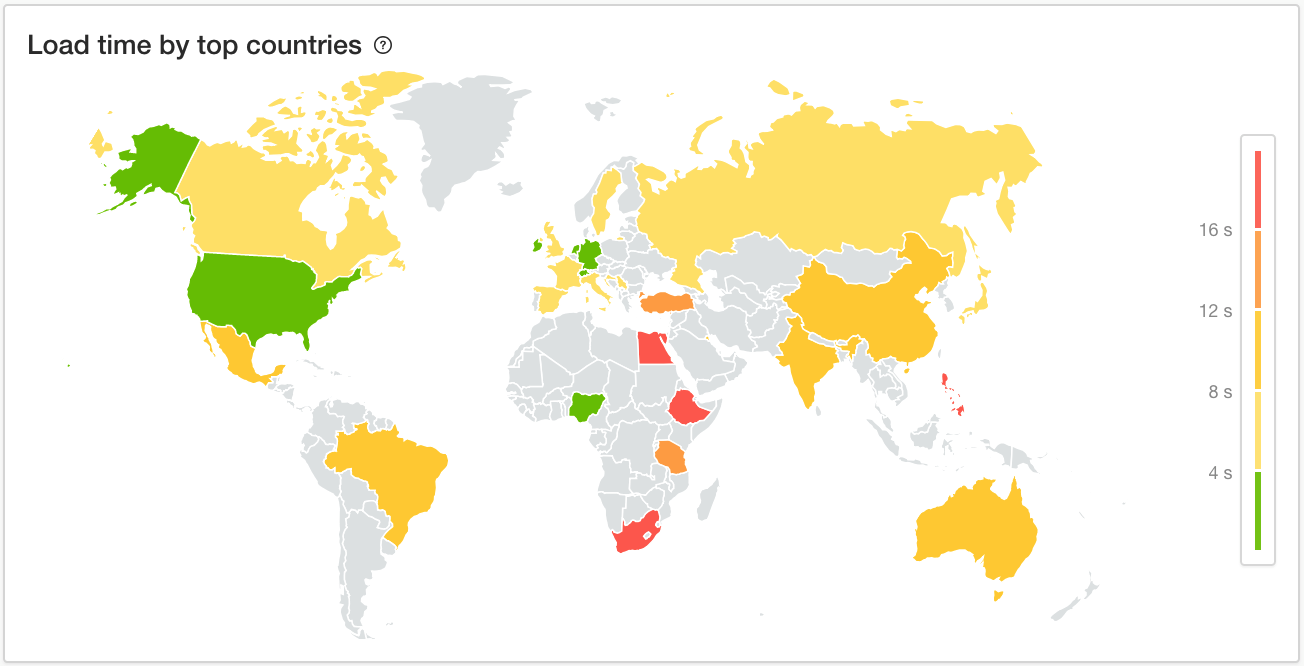
These are statistics for just 24 hours.
- Notice the red-slow areas Egypt is not any further away practically than Western Europe but has much slower load times.
- South Africa consistently has slow load times. But the longer the time interval that is reviewed, the more the extremes are moderated. This is because web speed varies.
- The Internet infrastructure can slow for shorter intervals versus longer intervals where the spikes tend not to persist.
Mixed Up Causation?
One of the commonly stated observations is that the most popular websites were analyzed and it was determined that a high percentage of them loaded in some very low timeframe.
However, the popular website has more resources to put into things like CDNs and caching and web specialists. This does not necessarily explain the popularity of the website. That is, the website speed may follow the popularity, not the other way around. The way of testing this would be to find popular websites that are of average speed. Another will be to find if there are unpopular websites that are also fast. If these examples can be found in a reasonable number, then the statement around the correlation between website speed and popularity would be challenged.
Normally one publishes the table of the numbers along with the correlation or covariance so that the reader can see the math for themselves. But this is very rarely done in the area of website speed.
Evidence Free Contentions About Website Speed
The following is a very standard explanation found on many websites about the relationship between website speed and readers and Google’s reaction.
“If your site takes more than a couple seconds to load, most people will leave. No one has patience for slow sites, so don’t be that site that feels like it is on dial-up.” – Advisory Internet Marketing
Notice that this is a “common sense” explanation, but there is little detail. Other quotations tend to point to a study showing people leaving in more than 2 seconds. Here is a similar statement, but here the rule stated is 2.5 seconds.
“In fact, I think you should be shooting for two and a half or two seconds; if possible, first you need to get a really fast hosting provider, second you want to make sure that your website is stripped down in terms of having all these external sources that are calling in, and it was especially if you have Java Script files everywhere!” – Clickx
Accepting “Research” from Promoters?
Neil Patel is a very popular specialist on websites. And he is a big promoter of website speed. Here are some of his quotations on website speed. Let us evaluate these statements.
“51% of mobile internet users say that they’ve encountered a website that crashed, froze, or received an error. »tweet«”
This does not have anything to do with the question of website speed. This is a question whether a mobile Internet user has experienced a website failure. The failure may have happened nine years ago, but even if it happened yesterday or seven days in a row, it would have nothing to do with the question of the relationship between visitors and website speed. Yet it is introduced as evidence in an article around website speed.
“38% of mobile internet users say that they’ve encountered a website that wasn’t available.”
Same as above. This is a completely unrelated topic and says nothing even about the topic it is investigating.
“47% of consumers expect a web page to load in 2 seconds or less.”
Again, it does not predict behavior, states the expectation.
“40% of people abandon a website that takes more than 3 seconds to load.”
How did Neil Patel arrive at this information?
Neil Patel is known as someone who helps website owners promote their site….and his main skill is, you guessed it promotion. People who promote things for a living generally do not care if what they say is true.
Why would anyone listen to a person who is a professional promoter and who uses evidence to try to support something that sounds similar to a primary question, but is, in fact, unrelated for advice on a research question?
As you will see, the analysis below calls into question this assertion.
Research by Pingdom
According to Pingdom, the service we used to create the previous load speed maps, the following is the average load speed for all web pages that they tested.
“From the millions of tests performed using our website speed tests, we found that the average load time for a webpage is 3.21 seconds.”
Pingdom published one of the few quantitative items of any kind that we were able to find on this topic.
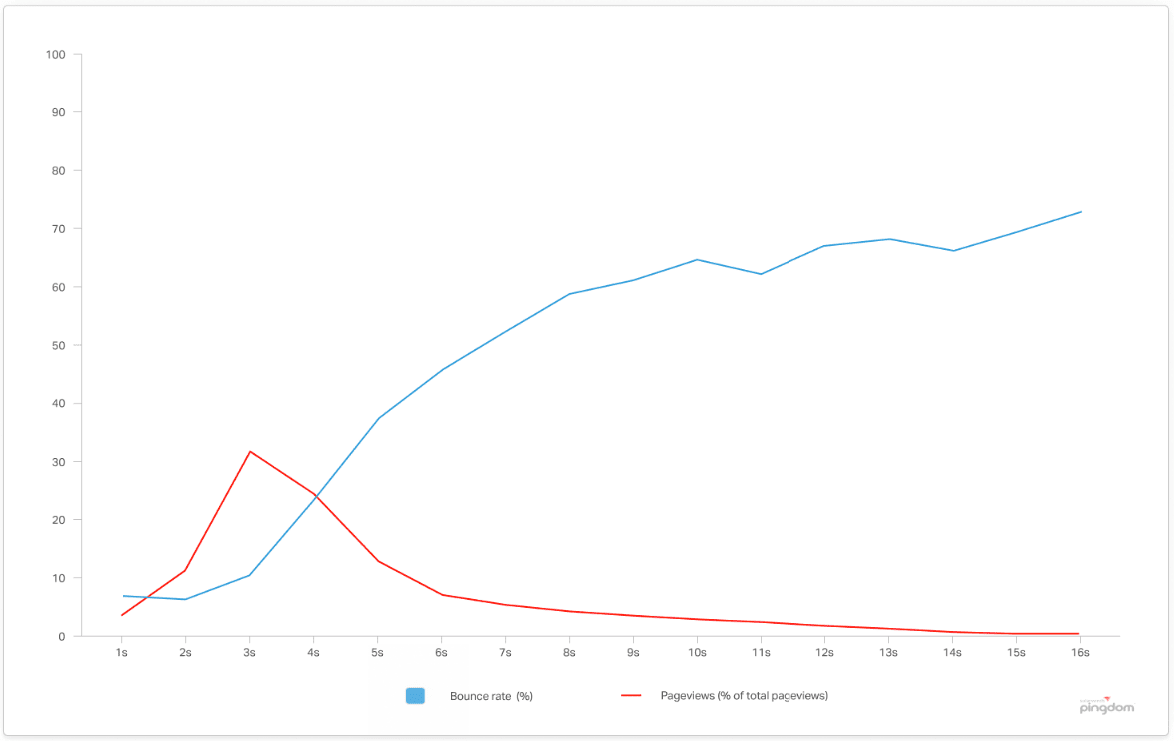
First, there is no reason for these two lines to be overlapped or shown on the same graph. It confuses the issue. And for my comments, I will only be focusing on the Bounce Rate. However, finally, we have some type of relationship that we can make sense of to understand the impact of load speed.
- Bounce rates see an inflection from 3 seconds to 4 seconds. However, the Bounce Rate only increases by 10%. Roughly another 10% will bounce from 4 seconds to 5 seconds.
- This graphic does not support the previous statements made about the Bounce Rate. The previous writers made it sound like a greater than 2 to 3 second load time was essentially a death sentence. There was no explanation of the incremental impact on the Bounce Rate.
Pingdom adds on the following observation.
“While the 2-second benchmark is a great goal to strive for in terms of delivering a streamlined web experience to your customers, it’s not a case of ‘one size fits all’. Not every page can load in under 2 seconds, and to having a longer load time does not directly mean your site will have a high bounce rate.”
Some sites have more content and pictures to load than other sites. For example, one thing we could do to increase site speed is to remove all images simply. But images are an important part of the experience.
Research by LittleData
LittleData investigated the relationship and had the following to say.
“We’ve read many articles stating a link between faster page loading and better user engagement, but with limited evidence. So I looked at hard data from 1,840 websites and found that there’s really no correlation between page load speed and bounce rate in Google Analytics.What we found is almost no correlation (0.18) between page load speed and bounce rate. This same result was found if we looked at the correlation (0.22) between bounce rate and the delay before page content starts appearing.
Again, the more data-focused the source, the less the stated relationship regarding Load Speed and Bounce Rate appeared to hold. Interestingly, Pingdom research and LittleData research can be found. Why had these results been excluded from the many articles on the subject?
And LittleData made an observation that we had never heard made before in all the articles we read while investigating.
Many of the smaller websites we sampled for this research operate in niche industries or locations, where they may be the only source of information on a given topic. As a user, if I already know the target site is my best source for a topic, then I’ll be very patient while the content loads.”
Most of the articles assumed that all websites are in competition with other websites, and if the visitor cannot get the site to load fast enough, they would depart. But not all information is of equal quality or equal interest to visitors.
The Similarity to The Goldfish Attention Span Meme?
On the other hand, it is very easy for a study to be performed without following any attempt to falsify the hypothesis and for the “results” to spread like wildfire through websites that are interesting in promoting the idea of web speed. This is a bit like the popular meme that the human attention span has dropped below that of a goldfish, which turns out to have come from a Microsoft study. After reading this Microsoft document, it is quite an exaggeration to call it is a study. It’s a whimsical report on happenings in web content consumption.
“The dissemination of this somewhat alarming data can be tracked back to a Microsoft report published in 2015 which has been the catalyst for articles in a range of illustrious publications including Time magazine, The Telegraph, and The New York Times, and continues to be quoted. However, before everyone rushes to surpass EY and BCG by creating tiny goldfish-sized pieces of content, it’s worth pointing out that the eight-second myth has been busted. The BBC explains that, for starters, the idea of an “average attention span” is pretty meaningless, that there’s no research behind the eight-second myth, and that even the analogy is paper thin: there’s no evidence that goldfish—or indeed any fish—have particularly short attention spans or memories.” – Source Global Research
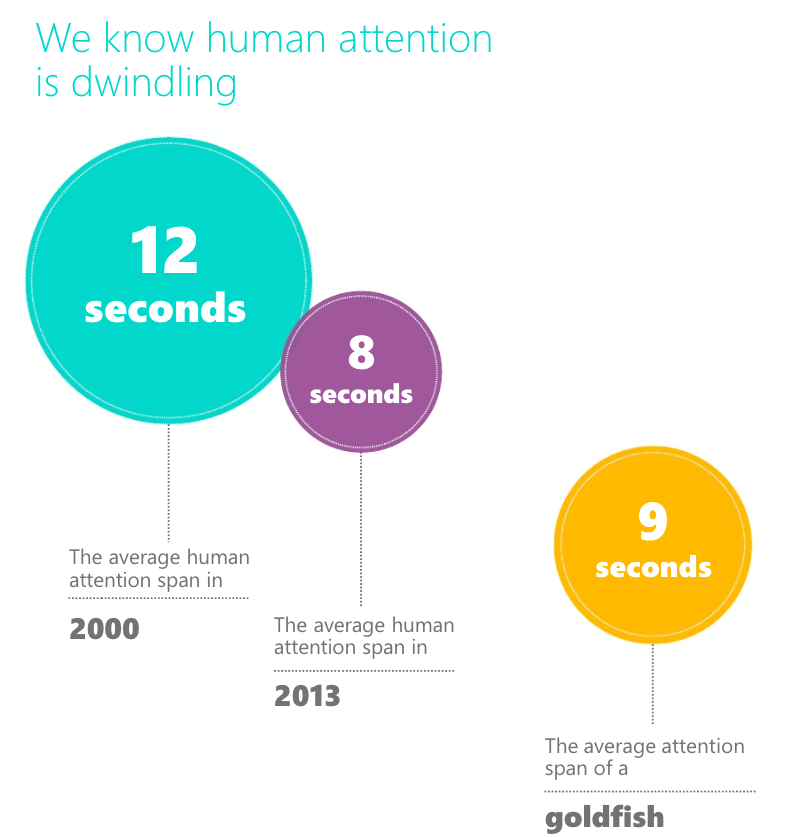
Where did Microsoft get its information that the average human attention span was 8 seconds in 2013? From Statistics Brain. How did Statistics Brain come to this conclusion….. it is unknown, you need to become a member to find out.
What is the Two-Second Rule Measuring?
Using the present web host, the Brightwork Research & Analysis website normally loads in around 2.7 seconds in the US. However, when I bring up the website (and from the US), I do not perceive the website as taking particularly long to load. The way to measure seconds is normally to utter “One Elephant, Two Elephant, Three Elephant,” or, of course, to use a stopwatch. When I have used a phone-based stopwatch, it does seem to be about 2.7 seconds. However, this does not seem slow to me. I decided to try the New York Times website, which, of course, has a team of people optimizing the load time and probably a server located close to me. When I loaded this page, it was first viewable with some elements in 1.22 seconds.
LittleData explains this phenomenon in the following quotation.
“Many websites already use lazy loading of images and other non-blocking loading techniques to make sure the bare bones of a page is fast to load, especially on a mobile device, before the chunkier content (like images and videos) are loaded. This means the time when a page is ready for the user to interact with is not a hard line.”

However, it did not finish loading until several seconds after that. And some elements did not load until I scrolled down. Therefore, while the New York Times loaded the initial elements quickly, it did not load the entire article with amazing speed.
Research into CDNs
Using a new website monitor that displayed the graphics shown above caused me to invest many hours using the products from Cloudflare. I was paying a monthly fee to CloudFlare for CND and DDoS protection (Brightwork was hit with DDoS attacks for a while). But Cloudflare did not seem to work very well for either speeding the site or for DDoS protection. I then investigated Fastly, Google CDN (which it turns out you need to host on Google to use), KeyCDN, which I was not able to set up properly or did not work, and I was about to set up AWS’ CDN called CloudFront. However, I then asked myself the question..
“We know that overseas locations are loading slower. However, are we sure that this is negative impacting how users interact with the Brightwork website.”
Almost anyone who has a website uses Google Analytics. It is a great resource. However, I think most tend to use it in a rather standard way, just to see what articles are doing well. But one can filter the GA statistics by country. If slower load speeds were reducing the user experience whereby they were leaving the website, they shouldn’t this show in the website statistics.
Getting the Data for Analysis
So, I decided to get the statistics by country (something I had never done) and see if there was a correlation between web load speed and bounce rate. Bounce Rate is the percentage of visitors that come to a web page and leave without selecting a second web page. Bounce Rate can be a bit tricky because you don’t know how much time they spent reading the article. They may have bounced after being tired of the page loading and seen none of the articles. But luckily, we have a second statistic called the Time on Page. Time on Page will show if people are leaving the site “early” before they have had time to read the content.
I assembled the following information from both Google Analytics and from Pingdom (which provided the load time). I also added several other statistics and even created a statistic where I estimated the English Proficiency of the country to see if that was a factor.
The Data Table
See the table below, which is based upon a week of visitor data from the Brightwork website.
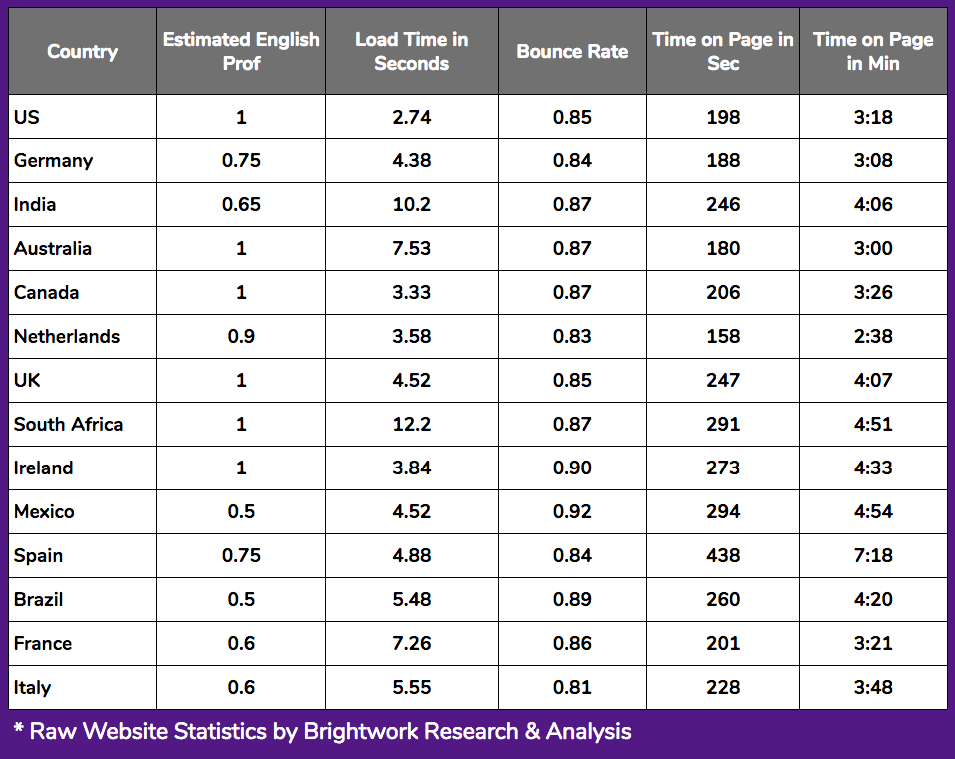
One can learn a lot just from reviewing a table of information, before running any statistical analysis. And as a note, these are my estimates of English proficiency. And this is not me saying that everyone in the world should speak English. It is simply the language in which the Brightwork website is published. I only speak one language myself, so I can’t critique people in France or Italy for not having high proficiency in English. The Dutch have the highest proficiency in English of non-native speakers I have ever seen, even able to in some cases pulling off a native American accent. Still, people in the Netherlands, Sweden, Denmark, Norway, etc.. have to speak other languages well because with their small populations no one will be speaking their language and most of the books in the world will be published outside of their language. Proficiency in the language of the website is certainly important. I was recently using a German website and translating parts of it using Google because I liked the website. But it certainly impacted my ability to use it. While I don’t speak German, I can get the meaning of some of the words due to context.
The Flesh Kincaid Readability Scale and Typical Brightwork Content
And there is a second reason this is important. Brightwork articles tend to score lower than 50 on the Flesh-Kincaid readability scale, and this means that the writing (vocabulary, sentence length, complexity) is going to push out many who are English as a first language. (This is one of the easier ones and scores 58, which is still considered fairly difficult to read.) We have tried to simplify the articles, but it’s challenging to cover what we want to cover and also make the articles have a broader appeal by reducing the complexity of the articles. Because of these factors, it seemed like a language seemed like a logical thing to include and to test.
Running the Covariance Test
Once I had the data in this format, I able to run a covariance analysis.
I very much like covariance analyses because it allows one to very simply compare how multiple variables relate to one another.
So let us take a look at the results.
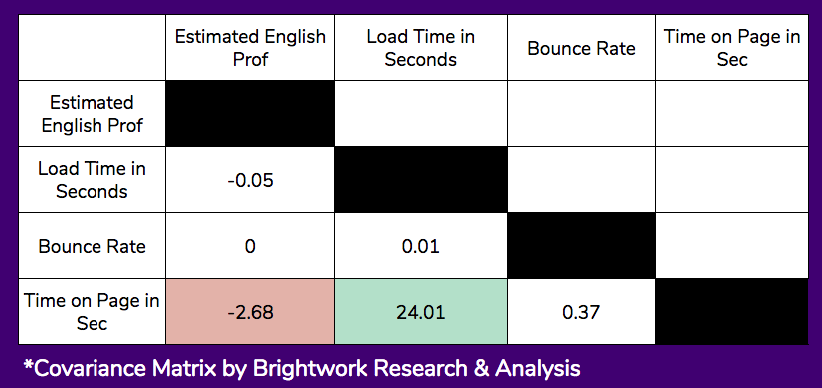
The black squares simply remove the value that shows the covariance between the item and itself (the procedure creates value, but obviously, it has no meaning). And we are left with the six values below the black boxes.
There are several relationships measured in this matrix, so let us focus first on the primary research question.
The Primary Research Question
The primary question that I wanted to test was whether the Bounce Rate increased for countries with higher load times. We can see that the covariance between the Load Time and the Bounce Rate is .01. This is so low that it can be said that there is no relationship between the Load Time and the Bounce Rate. But as I stated earlier, we need to also look at the Time on Page, as visitors may bounce before the page loads in significant numbers. However, the covariance between Load Time and the Time on Page is the strongest relationship of all the compared items at 24.01. However, there is a problem……it is positive! This means that the longer the Load Time, the longer people stay on the page.
This is easy to see from the table. The US has one of the shortest Times on Page. The typical US visitor stays for 198 seconds. But the average for the countries included in the study stay on for 246 seconds, or 24% longer. Why would the country with the fasted load time have one of the lower Times on Page? Secondly, the Bounce Rate for US visitors to the site is only one percentage point less than the average for the rest of the countries.
These results do not show what is commonly repeated by articles about website speed, which is that speed is important to keep people from leaving the website.
Conclusion
This is not to say that web speed is not a good thing. It is. However, the results of our test did not find what has become considered common knowledge on articles about web speed, that visitors begin to leave the site as the load speed increases beyond two or three seconds. This would not justify Brightwork investing time or resources in a CDN. There are a few things we do to increase the speed of the site, such as minify the website and shrink the size. However, this study makes us question how much time we should invest in speeding the website versus other activities.
There is a second reason often given for increasing website speed, and that is Google Search results. It is proposed that faster sites receive a higher ranking by Google in search results. However, the evidence for this is often even more scanty than the evidence for the relationship between site speed and visitor retentions, which is normally stated as if it is an established fact. This is expressed in the following typical quotation on the topic.
“Google also places quite a bit of favor in their ranking algorithm on faster loading sites. Keep in mind that Google’s #1 Mission is to give an incredible user experience, and showing the Google users a website that is incredibly slow, doesn’t fit in well with their overall goals. So having a slow site will hurt how your site ranks.” – Advisor Internet Marketing
Google has stated that they do prefer faster websites, but as Google keeps things close to the vest, they don’t say how much of a factor this is.
Is there Bias in Promoting the 2 Second Page Load Concept?
Something else that should also not go without observation is that there are financial incentives in the market to promote the idea of site speed. Web hosts charge a premium for faster web hosting. CDNs are an area that is primarily built around site speed. There are various plug-ins and optimizers that also live off of the proposed relationship between website speed and visitor experience and retention. There is clearly a negative relationship with problematic sites that have a problem loading, but this does not necessarily say what the results are for a page that loads a few seconds slower than another (for instance a page that loads in 2.74 seconds in the US versus the same page that loads in 4.88 seconds in Spain). And the entities that bring forth the importance of website speed tend to be those entities selling web hosting, CDN services, accelerator plug-ins, or the websites that write about these topics…..and are also funded by the vendors through affiliate links and other commercial relationships. Brightwork has none of these relationships and only performed this small study to determine if it made sense for us to invest time and money in decreasing international load times by using a CDN.
References
https://royal.pingdom.com/page-load-time-really-affect-bounce-rate/
*https://blog.littledata.io/2017/04/07/how-does-page-load-speed-affect-bounce-rate/
https://en.wikipedia.org/wiki/Flesch%E2%80%93Kincaid_readability_tests
“The F–K formula was first used by the Army for assessing the difficulty of technical manuals in 1978 and soon after became a United States Military Standard. Pennsylvania was the first U.S. state to require that automobile insurance policies be written at no higher than a ninth-grade level (14–15 years of age) of reading difficulty, as measured by the F–K formula. This is now a common requirement in many other states and for other legal documents such as insurance policies.”
*https://www.crowdcontent.com/blog/2018/02/27/content-reading-level/
“As a project manager and freelance writer, I’ve worked with numerous brands that wanted content within a specific readability range. Those companies often use Flesch reading ease scores or Flesch-Kincaid reading levels, which are text analysis tools included in word processors. They’re also readily available online. It’s not uncommon for clients to ask for all content at a 6th or 8th grade reading level, and they use Flesch-based tools to verify writers meet those requirements.”
http://time.com/3858309/attention-spans-goldfish/
https://www.nngroup.com/articles/how-long-do-users-stay-on-web-pages/
https://www.statisticbrain.com/attention-span-statistics/
*https://www.clickx.io/can-website-pass-3-second-rule/
*https://neilpatel.com/blog/loading-time/
https://internet.psych.wisc.edu/wp-content/uploads/532-Master/532-UnitPages/Unit-09/Attention_Goldfish_Abbreviated.pdf
http://advertising.microsoft.com/en/cl/31966/how-does-digital-affect-canadian-attention-spans
*https://www.sourceglobalresearch.com/attention-spans-are-getting-shorter-or-are-they/
https://www.bbc.com/news/health-38896790