
How to Combine TCO Analyses for a Complete Enterprise Solution Architecture
Executive Summary
- Brightwork Research & Analysis combined TCO can be used to combine multiple solution architectures.
- This is a critical point in determining TCO.
Introduction
TCO presents an opportunity far greater than that presented by its general interpretation. TCO is often discussed in terms of its value for doing things such as assisting with the decision regarding a specific application. As such, many people—and this is true even of proponents of TCO—often frame the benefits of TCO far too narrowly. In fact, there is no reason to limit the use of TCO because TCO can assist in selecting the overall enterprise software strategy for a company. That is, TCO can be used to compare multiple applications to make decisions between different software categories.
Cognitive errors that allowed ERP to flourish were due to a lack of overall analysis and the “advice” provided by biased parties, including advice from those who accepted direct payments from ERP vendors and guidance from consulting companies that make enormous sums of money from ERP implementations. The research review, which is explained in the book, The Real Story Behind ERP: Separating Fact from Fiction, demonstrates that none of the projections for ERP came true.
ERP’s Feeble Foundations
These projections were always based upon a feeble logical foundation. Although the logic used to sell ERP was based upon rosy projections, the vast majority of companies lacked the internal research capabilities to validate these claims. One type of analysis that was not done (and more shockingly, was not done even decades after the research became apparent on ERP) was TCO analysis. Most companies bought ERP systems on a combination of blind faith and the need to signal to various parties (the stock market, suppliers, B2B customers, etc.) that they were making intelligent and forward-looking decisions. After we reviewed all of the research on the topic, it became clear that ERP did not improve the operations or companies’ financial performance. As a result, we decided to add several TCO estimators to the Brightwork Research & Analysis website. One of these estimators compared a non-ERP solution to a one-hundred-percent best-of-breed solution. To build this estimator, we:
- Estimate the TCO for each of the individual best-of-breed applications.
- Estimate the TCO for a one-hundred-percent ERP vendor solution. This would include the ERP system combined with the ERP vendor applications outside of ERP (business intelligence, advanced planning, CRM, etc.).
- Estimate the functionality, implement-ability, usability, and maintainability differential between the best-of-breed master solution (the one-hundred percent best-of-breed solution) and the one-hundred-percent ERP vendor solution.
In addition to this comparison, we added another TCO estimation that compares a one-hundred-percent best-of-breed solution from a Tier 1 vendor to a combination of a Tier 2 ERP vendor with best-of-breed applications connected to it. This would give us three points of comparison. Once we estimated TCO for these three points of comparison, along with application estimations in the areas of functionality, implement-ability, usability, and maintainability, we would be in an excellent position to provide the highest level of advice on solution strategy to companies.
The Combined Enterprise Evaluation Method
To accomplish the above, it was necessary to find and calculate the TCO for multiple software categories—in fact, for most of the commonly implemented software categories. There are, of course, several challenges to doing so. First, we had to adjust the Brightwork Research & Analysis TCO method for different types of cost drivers. Software vendors have many different categories of costs, and not all software vendors use the same categories. Therefore normalizing TCO estimations across many different software vendors is necessary. Normalization is necessary across many of the cost categories, and giving any one vendor a cost advantage can tilt the decision-making in their favor.
For example, even within one software category, implementation times can vary greatly. The average estimated implementation time must be reflected in the TCO estimations for vendors with difficult implementation applications. The fact that this normalization has historically not been done means that many vendors get away with delivering software that implements poorly—a fact that cannot be determined by simply reviewing a demonstration provided by a presales consultant. And it should go without saying that implementation success and implementation timelines are probabilistic. TCO—as traditionally practiced—relies upon the assumption that all of the implementations will be successful and that the probability of success is equal between all applications. However, a TCO estimate without an approximation of the project’s risk makes little sense. In fact, a failed implementation can have a “low TCO” if the buyer decides to cut their losses. Strangely, companies do not estimate their probability of success before deciding which project to fund. Instead, they take the naive assumption that all projects will succeed, even though IT projects have a high failure rate, even if the exact failure rate and failure definition are most often not specified. And this is not the end of the issue because some live applications have been either significantly delayed or re-implemented.
According to IDC, fifteen percent of survey respondents re-implemented their ERP software. However, in all the many TCO estimations that I have reviewed from other sources, I have yet to see a TCO that included the risk of either project failure or re-implementation. Entities that perform TCOs clearly have a strong tendency to assume perfect-world scenarios and assume one hundred percent implementation success. This faulty assumption reduces any interest to determine the differential risk between the various applications that are part of the software selection and the functionality employed by each of the applications.
The Normalization Adjustments
The adjustments below were developed over time by simply comparing what facilitated cross-TCO comparisons:
- Calculating the TCO Per Year
- Adjusting for Differences Between SaaS and On-premises Solutions
- Adjusting for Implementation Duration Differences
- Adjusting for Training Cost Differences
- Adjusting for the Internal Support Costs Differences
- Adjusting for Differences in the Number of Users
Calculating the TCO Per Year
A major issue in any TCO analysis is how long the application is used. If one TCO analysis assumes six years, while another assumes eight years, the software license and implementation costs are not amortized across the same number of years. Generally, the number of years should be kept consistent within a software category but must vary between software categories. For instance, ERP systems tend to have the longest implementation timelines of all enterprise software categories. In fact, ERP systems also tend to be the longest-lived enterprise applications with lifespans in companies averaging around ten years. It is also useful to break the TCO down to a per year value.
Adjusting for SaaS Versus On-premises Solutions
SaaS solutions have far fewer components to calculate than on-premises applications. Also, the SaaS software vendor takes more of the risk on these costs, but they are in a much better position to do so because of their superior knowledge. In this way, SaaS has a major advantage over on-premises solutions, and while this has been known for some time, it has not been leveraged all that much by companies; as of the publication of this book, SaaS still only represents roughly four percent of all enterprise software revenues, something that was predicted to be much larger by this point. Something that SaaS vendors need to increase the adoption of SaaS software quickly is adherence to an ironclad privacy agreement so that they do not mine or sell the corporate information in the same way that is essentially part of the business model of Google and Facebook—but this is a large issue that requires an as yet unwritten book that combines a knowledge of the law along with knowledge of SaaS/cloud-delivered solutions. To make the SaaS TCO estimation fit with the on-premises TCO estimations, it is necessary to add cost categories, allowing both TCO and on-premises solutions to be compared side by side, even though they do not have the same cost components. Simply comparing total costs for each delivery method is the most important issue. Effectively comparing on-premises solutions to SaaS solutions will be an important goal in the future as SaaS increases in popularity.
The Popularity of SaaS/Cloud
In fact, our view is that a primary reason why SaaS is not more popular is that companies are not aware of the substantial cost benefits of SaaS-delivered solutions. Adjusting for Implementation Duration Different categories of software have different expected durations for implementation. For instance, SAP ERP and big ERP in general, has a very long and often painful implementation duration. The duration of supply chain planning software implementation can be long, particularly if complex methods are used. However, a bill of material or recipe management applications are relatively quick to implement. Reporting applications can be implemented quickly if the application has a self-service capability and orientation or can be one of the longest implementations, second only to the ERP system. However, the determination of when the system is live must be used to develop some substantial reports that meet business requirements, not when they are used to create some easy reports.
Amid all the discussions regarding “analytics” and “Big Data,” some on-premises business intelligence applications take a very long time to deliver usable reports. Furthermore, there are significant differences in how long it takes to implement various applications. Some applications are naturally easier to set up. Other applications are designed to enable the vendor to say they have certain functionality. Instead of relying upon good software design, vendors rely upon aggressive sales, paying off Gartner for a good rating and/or partnerships with consulting companies to get their software sold. Therefore, any TCO evaluation means spending time with the application, either implementing the application or using the application in a real-world setting, such as testing the introduction of new master data into the application and rating the difficulty, or asking the vendor to demonstrate specific functions, which can prove out the implement-ability and usability of the software.
Adjusting for Training Costs
Different software categories have very different training costs because some enterprise software is easier to use than other software categories. Additionally, within the same software category, some software can be easier or more difficult to use. Training is typically estimated by multiplying the number of users who will receive training by the average training cost. However, this brings up the question of how many “courses” the users must take. On some projects, we have seen the frustration on the part of the company—often IT—that the users are not “getting” the system and should be sent again to training. The short-term impact of training is greatly overestimated. Even after training, it takes considerable time until users reach their maximum efficiency with an application. Also, IT seems to treat all applications as equal in terms of usability when, in fact, they are incredibly different. I have pointed this out in previous books. Still, I am in no way exaggerating when I say that at Brightwork Research & Analysis, we can do several things concerning forecasting using an inexpensive demand planning application that the largest multinationals cannot do, chiefly because we test a demand planning system that grades well in multiple aspects—and then we use those applications. We require very little training on this application; in fact, most of our training has been on the software’s advanced functions. Some of these specific items that so many companies have problems concerning forecasting software are explained in the book Supply Chain Forecasting Software.
Bad Software
Bad software tends to require the most training. A good indicator of this is if users don’t really use the software even though they have been sent to training. IT resources and decision-makers will typically pin this on the users’ fault— with the remedy being that “they must be retrained.” However, in most cases, IT is simply living in denial. It was part of the software selection process to include whether the users would properly use the system. This should bring up the question of whether users were even involved in the software selection decision—and in many cases, they are not. A frequent mistake that companies make is not including the application’s usability in their software selection process. Instead, the decision to purchase software is often made by executives who will never use the application. Software vendors with poor usability often do everything in their power to exclude users—knowing they will not be able to win them over. This is explained in the book Enterprise Software Selection: How to Pinpoint the Perfect Software Solution Using Multiple Information Sources.
“Users need to be included in the audience during the demo, and their opinions should be solicited after the demo. Would they personally want to use the software? They should also be told to ask questions whenever they see fit and not at the end of the demo only. Users will pick up on things that executives will not. There is absolutely no logic to exclude the eventual users from a demo. When I worked at i2 Technologies, I recall that on one account the presales and sales team convinced the potential customers to keep users out of the demos. The sales and presales team explained to me that they knew the particular software they were showing was weak and that they would not be able to answer users’ questions, so they needed to, in their words, “sell directly to the top.”
Excluding Users from the Software Demos
In fact, the users are often excluded from the demo, meaning that the demo tends to be a high-level affair. However, the users ask the most pertinent questions related to how the software would be used in an everyday setting. Furthermore, the executives often do not even account for usability in their decision-making process and then assume that users will quickly learn a difficult system.
“Companies reported that, following initial training, it took users anywhere from several months to an entire year before they were entirely comfortable using the application.” — Nucleus Research
Companies that exclude users from software selections should not be surprised when the users do not take to the application. Instead, the executive decision-makers should say to themselves, “of course.” However, they don’t; instead of blaming the users or blaming Excel. At one client, a technique to force the users to use the ineffective solution they had spent large sums of money on was removing Excel from their users’ computers. In addition to the variability in training requirements between applications, some vendors have expensive training—expensive in terms of the software vendor charges and the travel and time commitment.
However, a few vendors (such as Demand Works) have come up with a creative way of reducing training costs by providing remote training that is partitioned out over time in smaller increments, a method that tends to enhance learning greatly and that is consistent with the continuous improvement principles that recognize that learning does not occur immediately and that users can only absorb so many new things in any interval. Much software training is very intensive and can leave the users overwhelmed. When they return to work the week following an intensive off-site training session, they find themselves further behind the work of their full-time job, and many of the things they learned will often quickly dissipate. When calculating a training cost, it is important to factor in the software’s complexity and the design of the software, and the training model of the software vendor. For this reason, we have developed three different training multiples to be applied to the number of users of any implementation: Easy, Medium, and Hard. Based upon this rating system, we assign a different training multiple to each application for which we create a TCO, and therefore a different cost.
Adjusting for the Internal Maintenance Costs
One of the most commonly underestimated areas of TCO is the internal maintenance costs. The same issues that apply to the training apply here. Software that is difficult to implement is also difficult to maintain and vice versa. Companies that breathe a sigh of relief after a difficult implementation probably shouldn’t because the implementation difficulty is often—although not always—a good indicator of how much work will be required to maintain the application. The relative ease of configuration, master data manipulation, and troubleshooting are all factors that we include in our estimates of how many people—and their percent allocation to the application and its integration and associated support— will be required for the life of the application in the implementing company, how the application support is staffed changes depending upon the experience of the company. It can mean changing the team’s makeup, bringing on new resources, or retraining existing resources. However, that part of the planning is not a focus of the TCO. Instead, it’s important to estimate the consumption of resources at the implementing company and whether they already exist. It will produce inaccurate TCO estimates to assume, as many companies do, that all applications within a software category will consume the same maintenance resources because this skews the estimates in favor of applications that are more expensive to maintain.
Adjusting for the Number of Users
Adjusting for the number of users is, of course, extremely significant for any TCO analysis because the number of users is one of the most important drivers of cost. Applications scale in cost as the number of users increases. Therefore, a TCO that assumes 100 users will be higher with only 10 users—although the costs will not scale linearly. In fact, other things being held equal, the higher the number of users, the lower the user cost per user. This is a consistent relationship that holds across all enterprise software categories.
Unfortunately, this insight often leads companies to attempt to use applications in more regions and more divisions than it actually fits to receive these “cost savings.” That is direct cost savings of a lower-cost application—without considering the cost savings or revenue-enhancing capabilities of the functionality as matched to the business requirements. However, this is a standard IT-focused blind spot that does not consider the functionality of the application. It is perplexingly simplistic but is also extremely durable. Many vendors price their software per user. If they do not, or if they have a multifactor- pricing model, then the software cost per user can be estimated by taking several estimates at specific numbers of users and then triangulating back to the user estimate provided by the implementing company. The cost per user is beneficial for comparisons within a software category, as the estimated number of users for most applications within a software category will be the same.
However, the per-user cost does not help make value comparisons between software categories because different applications vary significantly based on the application type. For instance, the categories of software that are most broadly used are ERP systems and reporting/business intelligence systems. In contrast, the categories of software used most narrowly include specialty applications such as supply chain planning. In fact, the greater problem with a supply chain planning system is that too many people in the company use it and make changes; this is an issue because planning systems are supposed to be limited to a small number of users. Transaction processing systems such as ERP systems create changes (often to single records), and reporting/business intelligence systems allow users to view data rather than change data. However, supply chain planning systems allow users to change data and change aggregations of data, even though not too many people should have this power. Therefore, the cost per user will be much higher for supply chain planning systems than ERP systems. This is not a measurement of the value that these systems provide to the company or whether a company should buy an application from one software category or another; it is simply the nature of these software categories and how they are designed to be used.
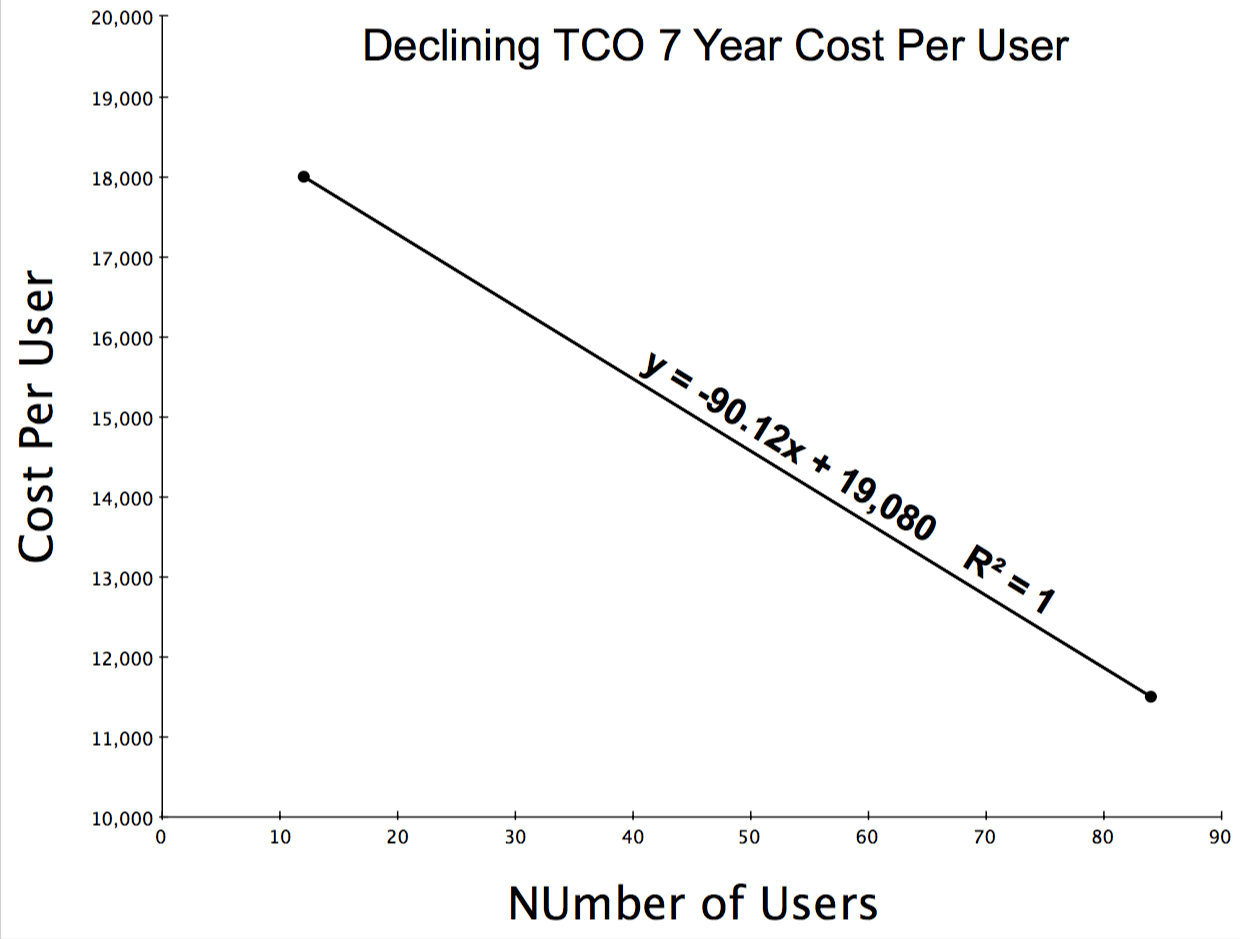
I added a regression formula, which is useful for making other estimates aside from the two data points that I have included above. For instance, if a company had forty-two users, it could expect to pay $15,295 per user over a seven-year period, or $2,184 per user per year. This is just one application; different applications have different relationships regarding how their costs per user decline as the number of users increases.
Some articles have covered the cost per ERP user but neglect to mention that the number of ERP systems users tends to be high. Analysis that compares the cost per user per vendor without explaining the average number of users for each vendor will result in a misleading conclusion. Selectively releasing TCO statistics like this without showing the full context can easily result in the reader knowing less than before they learned the “statistic.”
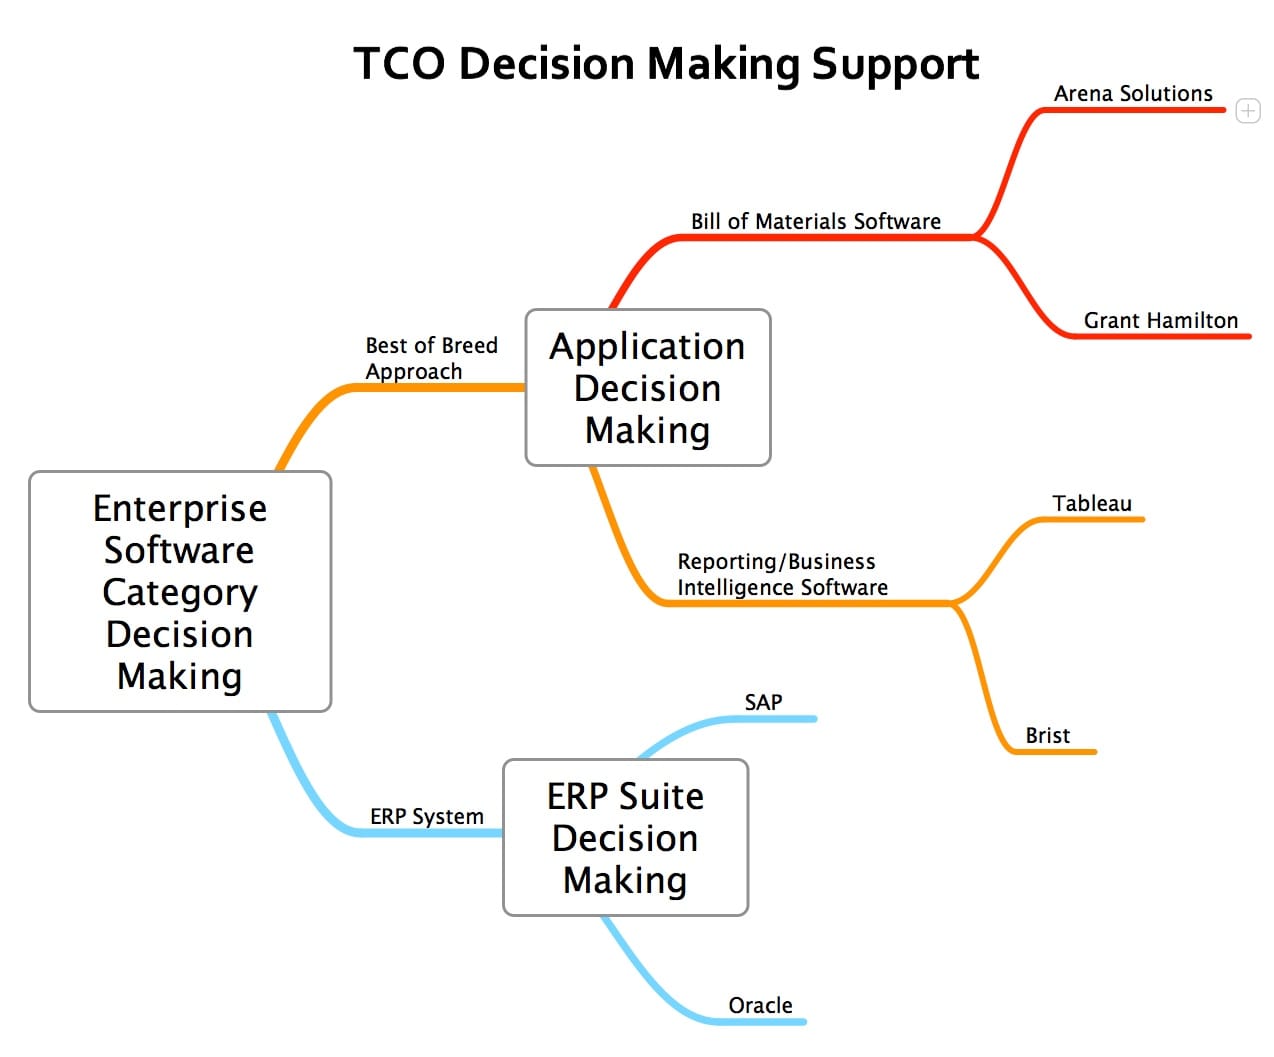
Using TCO for the Broadest Decision
However, what should be evident is that making multiple TCO calculations available leads to a variety of broader analyses. The problems with ERP are multifaceted, but two of the biggest issues are limited functionality combined with ERP’s high TCO; added to these issues is how developing a dependency on ERP leads to the purchase of other applications with high TCO low functionality. For some time, the false argument of marijuana being a gateway drug was used to develop a highly punitive law enforcement system for marijuana smokers, including its classification as a Schedule 1 drug. However, a much stronger argument can be made that ERP is a “gateway drug” for companies to purchase other enterprise software with high TCO and low functionality than ever existed for marijuana being a gateway drug to harder drugs. If a company builds a database of TCO calculations for its software selection projects, the company eventually ends up with a comprehensive TCO for enterprise software categories. The graphic on the following page shows the broad-ranging uses of TCO to support specific and broad decision-making.
Conclusion
This chapter attempted to show some creative uses for TCO. One of the most interesting aspects of performing a TCO analysis between a wide number of applications is that not only are there great differences between the application categories (such as between reporting/business intelligence, supply chain planning, etc.), there are also great differences within application categories. Essentially, some applications with very high TCO are competing directly with applications with low TCO.
Furthermore, there is no strong relationship between an application’s TCO and its quality, functionality, or capability. What this means is that the enterprise software market is essentially inefficient. It also means that software selection is essential because the variability in software value is so great.