
How to Mix Reorder Points and MRP in SAP APO
Executive Summary
- The question of how to mix reorder points and MRP is what sets part of the planning strategy.
- We cover when to use reorder points versus MRP planning.

Introduction
When to use Lean versus MRP, the question of when to use Lean versus MRP is critical to determine when to use a non-forecast based method of supply planning (reorder points) and forecast-based planning (like MRP).
Our References for This Article
If you want to see our references for this article and related Brightwork articles, visit this link.
Mixing Lean and Reorder Points with MRP Type Planning
Much time is spent debating among the different supply planning methods, but far less is spent on how to integrate multiple techniques into a cohesive strategy properly. That is unfortunate because all methods and method modifiers can be of value in some circumstances. Arriving at the right combination of supply planning methods requires a detailed study of all the requirements and data necessary to drive the technique. Without that upfront effort and knowledge, a process can be selected and then simply perpetuated because of the strong tendency not to change decisions after being made. I will use the example of SAP APO to illustrate how to configure the use of various methods. This is from a real project, and while the system that is used will change, the approach outlined in this chapter would apply to any supply planning application.
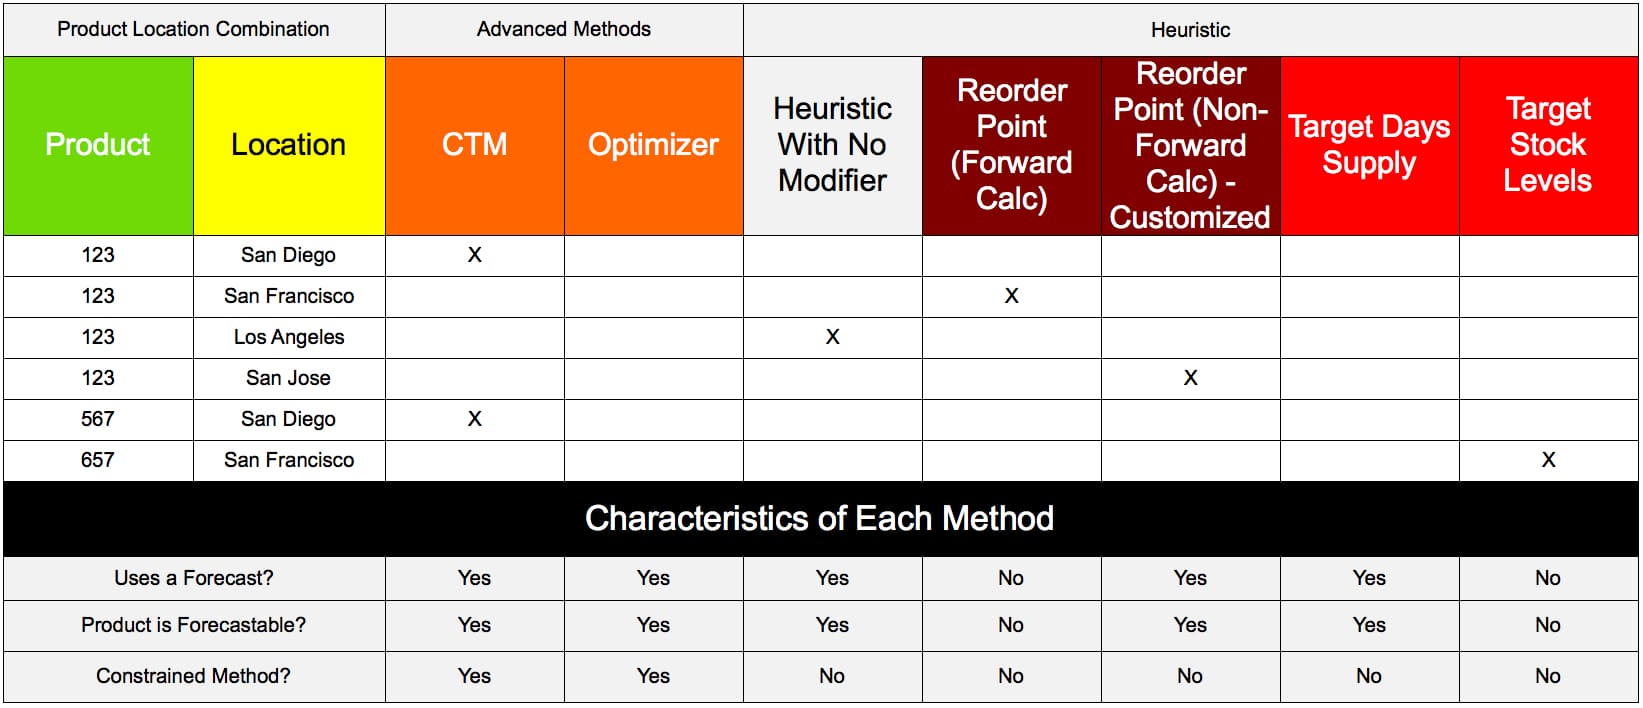
Here is a screenshot is taken from the Brightwork Research & Analysis Press book Multi-Method Supply Planning in SAP APO. It shows the association of each product location combination with either the advanced method (either CTM – Capable to Match or the optimizer) or consumption-based replenishment methods.
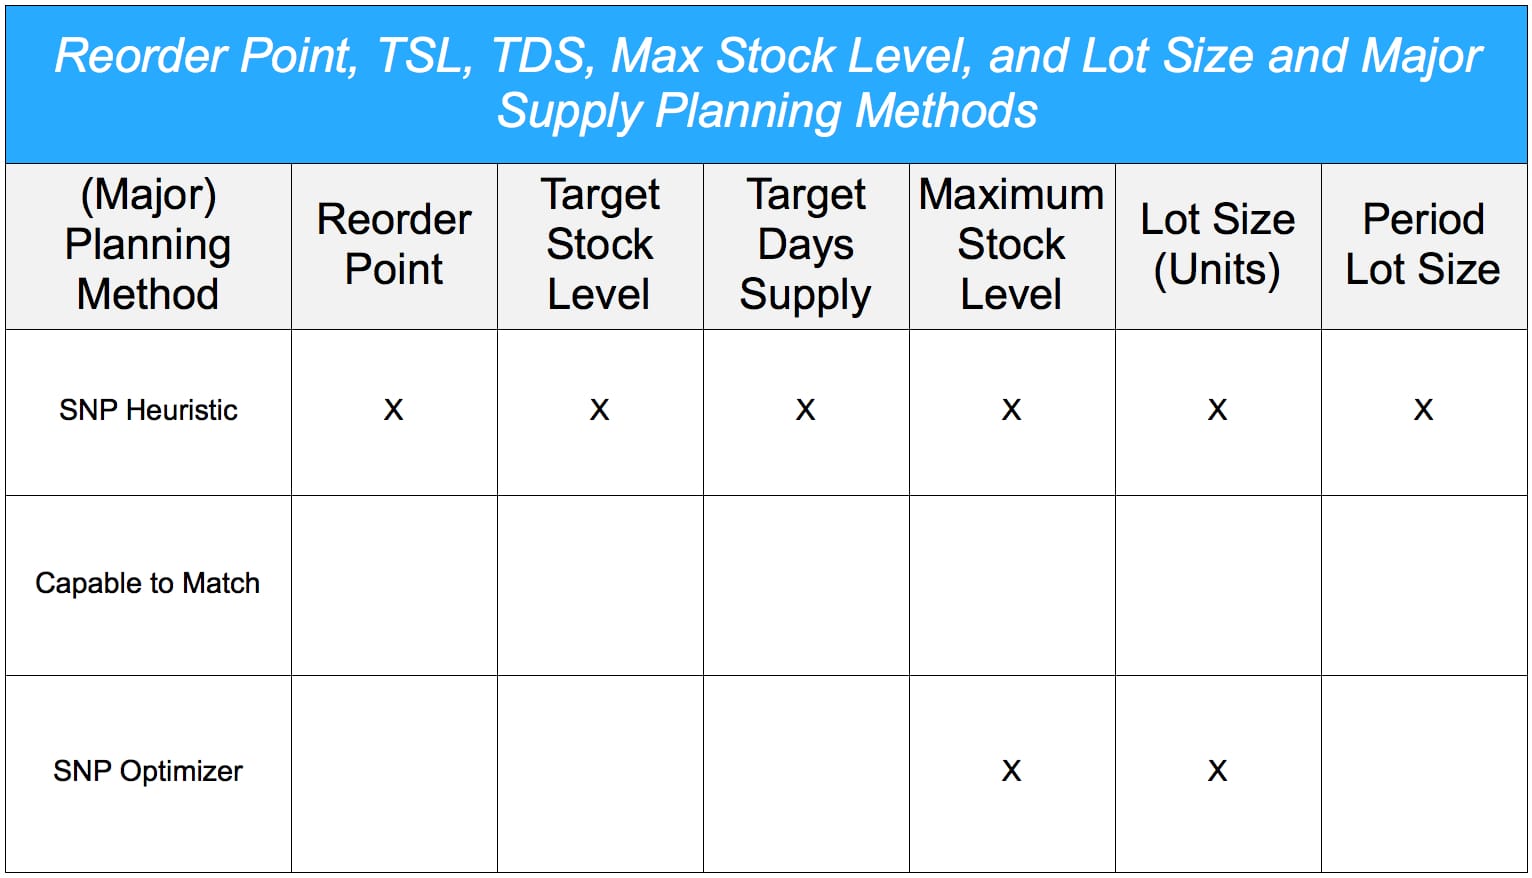
In SAP APO, some methods need to work with what I refer to as method modifiers. In SAP APO, or more specifically, SAP SNP (the supply planning module of APO), reorder point planning is a heuristic method modifier. The reorder point is just one of the modifiers that work with the SNP heuristic. Not all modifiers work with all of the methods. How this works is explained in the following graphic:
In the matrix above, the method is documented per product location. As you can see, the reorder point and the target stock level (TSL) only work with the SNP heuristic and are ignored by CTM and the optimizer. An important consideration for determining when to use one supply planning method over another is whether the product location combination is forecastable.
The above matrix can be used to help explain how to make selections between the various supply planning methods. Once this has been explained, the business subject matter experts can go off and code the entire product location database for each used method. There is much more to a successful configuration than simply assigning product locations to profiles and then running the profiles.
There is a sequence in which the different methods’ profiles must be run for the system to work correctly. ATestingmust is performed to make the desired assignments between the supply planning method and the product location combination workable and tet up the proper sequence profiles. We will get into all of the detail on this topic in the following chapter.
Background on the Configuration of Multiple Supply Planning Methods
Once a company decides to use multiple supply planning methods, the next question is how to implement this in the system’s configuration. How to do this is not widely understood or even explained. The book Multi-Method Supply Planning in SAP APO is one of the first to describe how to implement multiple supply planning methods in the configuration of any external supply chain planning system. It would be most convenient if using various supply planning methods could be accomplished by assigning every product location a supply planning method and creating the supply plan logically and consistently. Unfortunately, making multiple ways work together is a good deal more complex than this because of how APO was developed. In this chapter, I will describe how combining various methods can be accomplished with the following methods and method modifiers:
- Capable to Match (CTM)
- The SNP Heuristic with:
- A Reorder Point
- A Target Stock Level
- A Target Days’ Supply
The same principle and testing as discussed in this chapter apply to collaboratively using other supply planning methods. However, for any SNP heuristic method modifiers (reorder point, target stocking level, target days’ supply), either of the other two modifiers (target stock level or target days’ supply) could be set the same way as the reorder point I describe here. Within SNP, there are several ways of setting up a reorder point, target stock level, or target days’ supply. For this demonstration, I will show the most basic settings for each. Here is a screenshot showing the reorder point set in the product-location master:
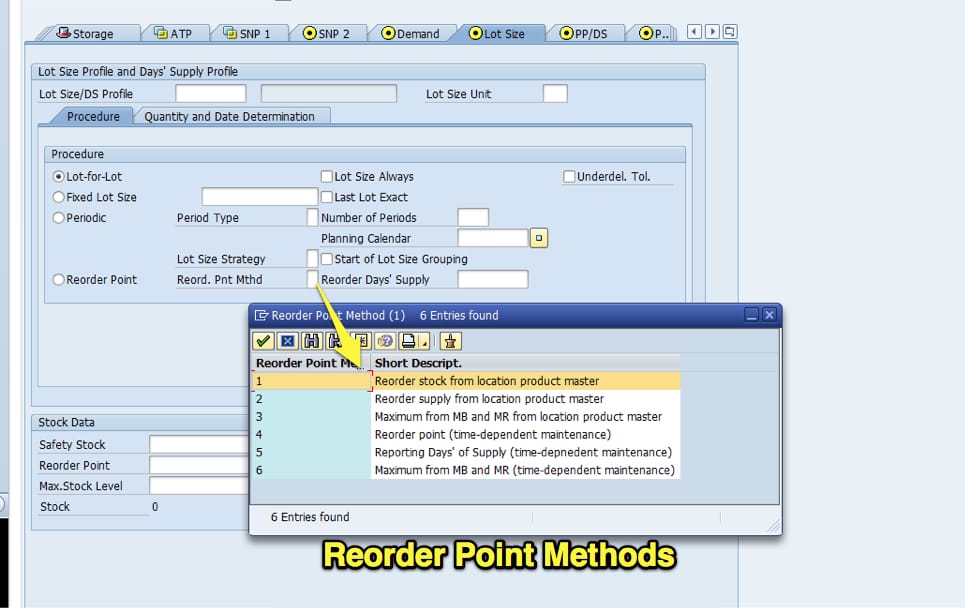
There are six different reorder point settings in SNP. However, for our purposes, there is no need to use anything but the simplest method. The time-dependent maintenance reorder points are used when the company has an interest in allowing planners to alter the reorder point per time.
On an actual project, it is vital to provide all of the alternatives for each setting that are within the scope of the project.
When following a multi-method approach, it’s crucial to have a useful tool for assigning which method (and method modifier) is to be applied to which product location combination and keeping track of these assignments. Even though companies have a vast number of product location combinations, the appointment of methods and method modifiers does not have to be a difficult task.
First, a company already has method modifiers set up in its ERP system or external planning system (if they are migrating from another system such as Manugistics). These modifier values can be extracted from the existing system and used. Product location combinations can be grouped based upon any criteria and have any value applied to them. I am unaware of any faster or higher quality approach than the one I will describe in this chapter.
A major challenge of all application implementations is how to keep track of the settings in the application. This is particularly true of SAP implementations because SAP development takes such a comprehensive approach to developing functionality that every application ends up with a vast number of fields. However, in the vast majority of cases, only a small percentage of the fields are used in an implementation. Therefore, one of the most critical steps to be performed during the implementation is to determine which fields should have values assigned to them by the business.
In SNP, there is a wide variety of fields in different locations. However, many fields are stored in the product location master, which is equivalent to the material master in SAP ERP (this would be assigned to a plant to bring in the location dimension).
There are hundreds of fields in the product location master in SAP APO. Most companies only have the values in these fields managed in SAP or whatever system they use. However, that is not the best way to manage their fields. The parameters should be kept in an external database for the following reasons:
- Comparing and Contrasting: Product location data cannot be easily compared and contrasted inside of the system, beyond bringing up the product location master for two combinations in different windows.
- Productivity: Productivity is greatly enhanced when planners have access to product location data in a readily accessible form.
- Visibility: A common problem with product location data is enhanced with this approach, reducing the likelihood that this data will become out of date.
- Metadata: A product location spreadsheet can include descriptions and comments in a way that SAP cannot. (Descriptions can be found by hitting F1 from any field. However, descriptions can be placed right into a spreadsheet, and can also be customized – and typically truncated to just the information that is of interest.)
My preferred way of storing this data is in a spreadsheet, which allows for the filtering of values, the use of Pivot Tables for analysis, and other advanced data capabilities in Excel. This approach applies to setting the overall policies during the initial implementation and to continued maintenance. Once changes have been made to the spreadsheet, they can be made in most systems with a mass maintenance transaction.
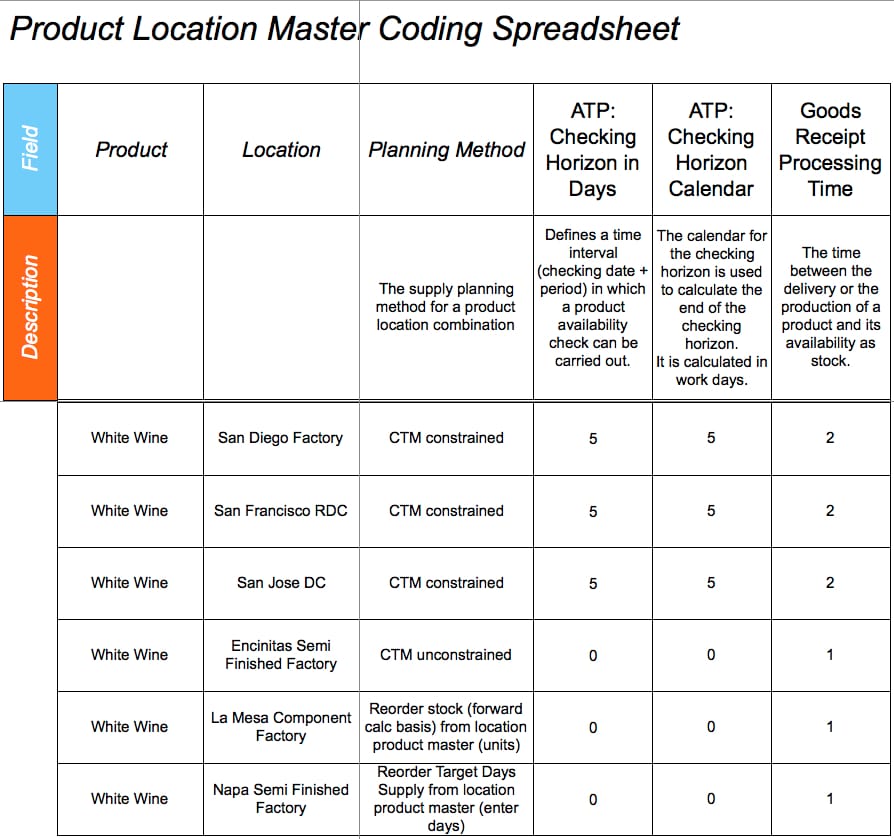
This is just a sample of the fields in the product location spreadsheet and is all that I could fit into this screenshot. There are, of course, many fields on the product location master. Not all of them are filled in, but it is beneficial to note all of them in the spreadsheet and their definitions so that planners can choose which to enable. While it can seem intimidating to fill in all the fields of a spreadsheet like this the fields are rarely filled in one-by-one. It is much more common to group the products for a specific field. Spreadsheets also allow for the applications of IF/THEN formulae, which can auto-populate some field values based upon the values of one or more other fields.
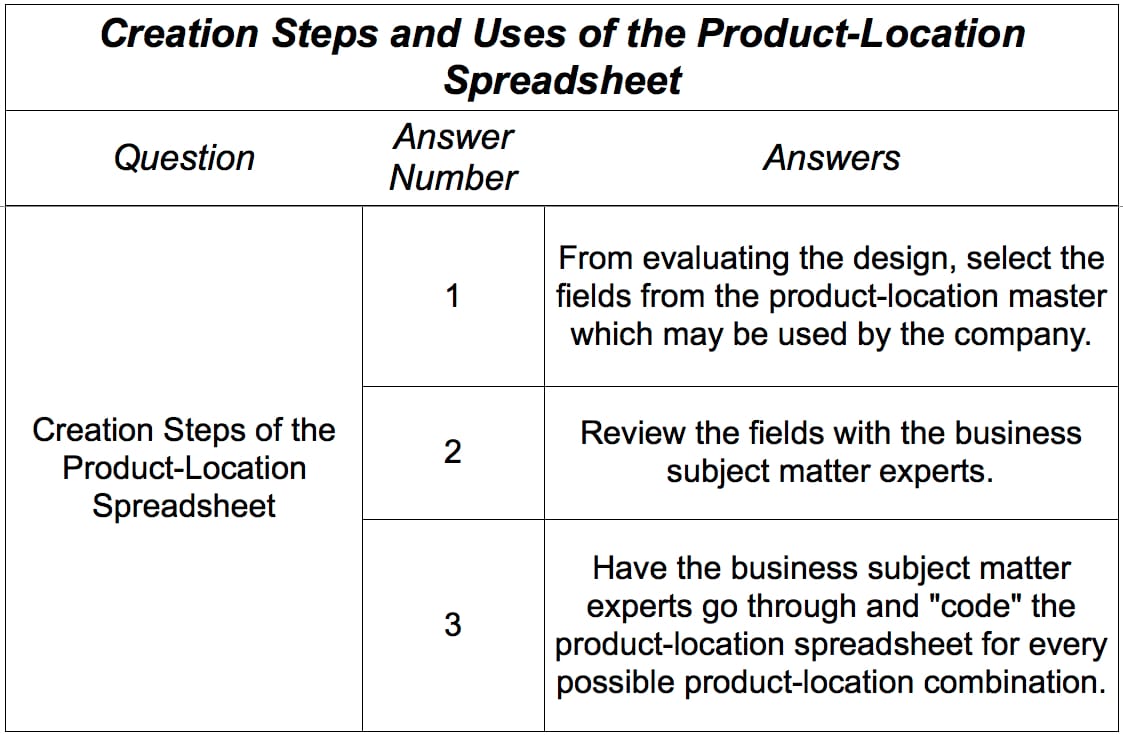
Steps to Creating the Product-Location Spreadsheet/Database
On the following page, I list the steps to creating this product location spreadsheet and the uses of the product location spreadsheet.
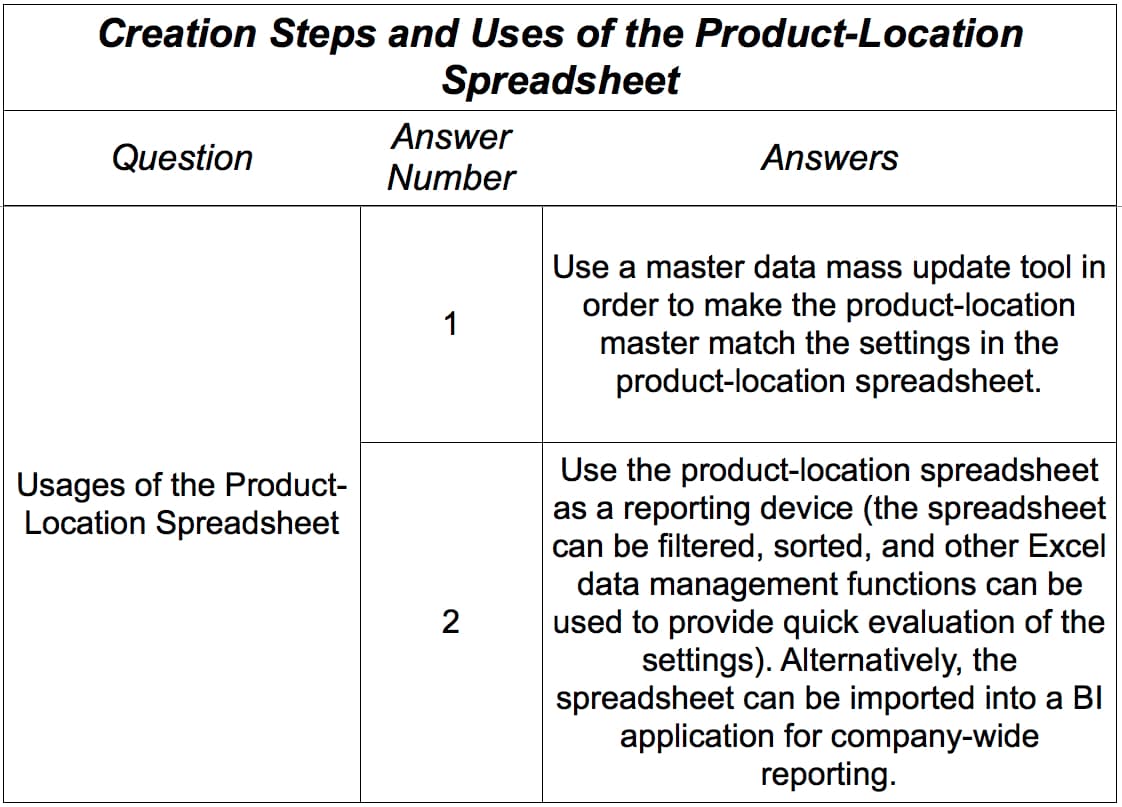
Once created, the product location spreadsheet can be reused for many purposes. The following are uses of the product location spreadsheet:
This way of managing settings for applications is quite sustainable, provides a great deal of visibility into the settings, and allows for analysts to easily compare and contrast the parameters. Some applications, such as Barloworld’s Optimiza application, build similar functionality right into the user interface, but these types of applications are few and far between. Therefore, in most cases, companies implement software that does not offer this type of functionality. This approach to application settings is quite unusual, as can be seen in the screenshot of Barloworld on the following graphic:
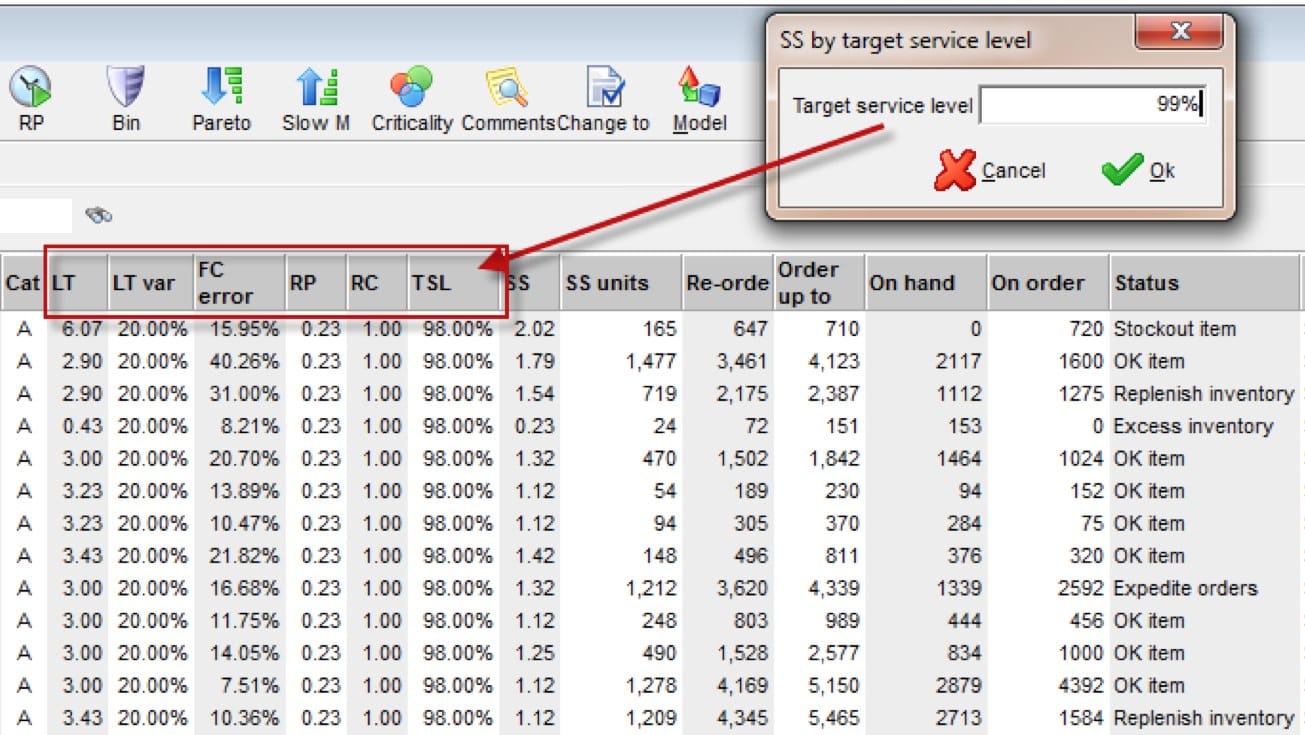
Planners are often told to keep the master data parameters up to date by finding issues and then transferring the values to the master data team for adjustment. Companies generally have no problem understanding the need to have effective planning systems. But often miss the fact that they also need applications to enable these planning parameters to be analyzed and updated, and that they need to provide an effective way for those that have this responsibility to do so. Barloworld’s applications provide the following capabilities:
- Allows planners to view the overall supply network.
- Notifies planners about what to focus their attention on.
- Allows the planners to manipulate supply planning parameters.
- Provides planners with an understanding of the relationship between different supply planning elements. Some Barloworld’s screens are examples of what I am referring to when I describe supply chain visibility. The following view highlights the apparent areas to be addressed by the planner. The categories F, M, and N on the next page are carrying far too much inventory according to what the Barloworld model recommends. Armed with this information, the planner can then go into the necessary details to determine why this is the case and take corrective action.
Conclusion
We tried to answer the question of when to use Lean versus MRP in this article.
Arriving at the right combination of supply planning methods requires a detailed study of all the requirements and data necessary to drive the method. Without that upfront effort and knowledge, a method can be selected and then perpetuated because of the strong tendency not to change decisions after making decisions. A major challenge of all application implementations is how to keep track of the settings in the application. Therefore, one of the most important steps to be performed during the implementation is to determine which fields should have values assigned to them by the business. In this chapter, I highlighted an approach that maintains many of the master data fields outside of the supply planning application.
It is a relatively simple matter in a supply planning system to convert some product location combinations to pure reorder point planning and other product location combinations to being processed with a supply planning method. Furthermore, a product may be planned in one way at one location and planned a second way at a different location.
We developed an approach where reorder points are calculated externally, which allows for a higher degree of control. And for the average inventory to be coestimated in a way that provides an observable total system inventory, holding cost, service level, and a picture of what is happening to the overall system. Calculating individual parameters like reorder points without an appreciation for the systemwide does not make any sense.