
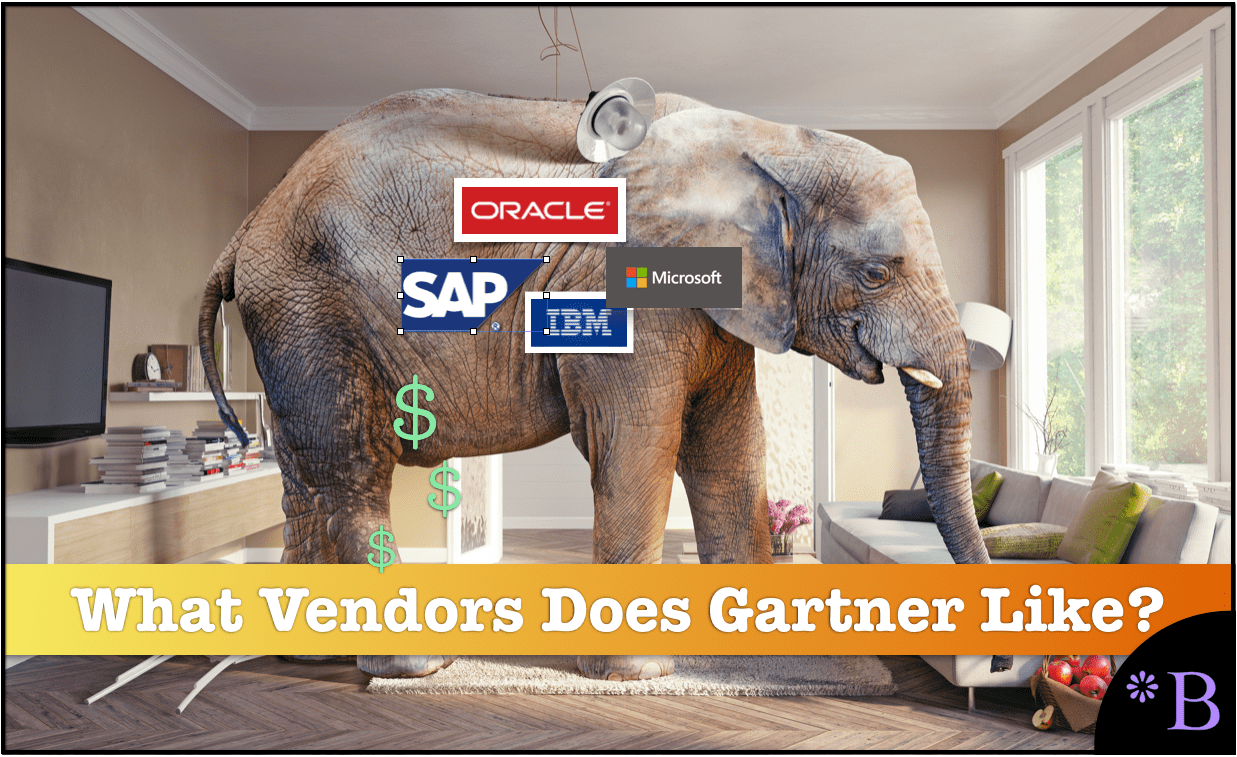
How to View Gartner’s Financial Bias in Favor of Large Vendors
Executive Summary
- Gartner proposes it has no bias, but they make the most income from the most significant vendors.
- Gartner’s content clearly shows a significant vendor bias.
Introduction
In 2006, InformationWeek wrote an article titled The Credibility of Analysts. IW brought up a fascinating point about Gartner and the overall analyst community in this article.
“Research firm executives are well aware of the questions being raised about their business models, but don’t expect changes to be fast or wide-sweeping. The financial stakes are too high — and the incentives for change aren’t compelling enough.”
Yes, research firms make great money. While some may question the absolute lack of transparency in the IT analyst industry, companies keep buying these biased reports that fail to mention where vendor funding comes from. You will learn that since few people are complaining, Gartner can conclude there is no reason to follow any standard research rules.
Our References for This Article
If you want to see our references for this article and other related Brightwork articles, see this link.
Notice of Lack of Financial Bias: You are reading one of the only independent sources on Gartner. If you look at the information software vendors or consulting firms provide about Gartner, it is exclusively about using Gartner to help them sell software or consulting services. None of these sources care that Gartner is a faux research entity that makes up its findings and has massive financial conflicts. The IT industry is generally petrified of Gartner and only publishes complementary information about them. The article below is very different.
- First, it is published by a research entity, not an unreliable software vendor or consulting firm that has no idea what research is.
- Second, no one paid for this article to be written, and it is not pretending to inform you while being rigged to sell you software or consulting services as a vendor or consulting firm that shares their ranking in some Gartner report. Unlike nearly every other article you will find from Google on this topic, it has had no input from any company's marketing or sales department.
Large Vendors Being Included in Magic Quadrants For Which They Have no Product
Alan Pelz-Sharpe made the following comment, particularly about the vendor’s size software category.
“There are other things about this report that baffle us — like why SAP is included in it, when even the report itself states that they do not have an ECM Suite — when others that do sell ECM Suites (such as those we mention above) are excluded. It may seem unfair to pick on another analyst firm — and for the record the authors of this particular report are all experts we have great respect for — but the importance of the MQ [Magic Quadrant] in the buying process is so huge that it demands a critical assessment and evaluation.”
While this may be surprising to some, it is consistent with my experience with Gartner. Their Magic Quadrant is more about the vendor, particularly the size of the vendor and how well it is established versus the application.
In defense of this approach, Gartner is not only explaining to its readers what currently is but what will be. For instance, in 2002—before Microsoft had a business intelligence product—Gartner still stated with a “.7” probability that Microsoft would emerge as having a competitive solution by 2005.
This statement signaled to buyers that they might be able to get what they need from their current vendor if they postpone purchases of software for a few years.
However, it also must be recognized that these predictions tend to be unique when a more significant vendor has some product limitations. I could not find a single instance of this type of statement made for a smaller vendor. A good indicator of bias is when a double standard like this is applied frequently. This is one example of significant company bias, but there are others that I will discuss further in this book. I will also cover bias in other analyst firms as well.
How Gartner Preferences Large Vendors by Weighing Global References
The quality and quantity of customer references are essential criteria. However, Gartner downgrades a vendor if they lack globally referenceable customers, clearly providing a bias for more significant software vendors. Usually, smaller software vendors do not sell out of their home country/region until they reach a specific size.
Selling out of the home country/region means developing reseller partnerships with foreign consulting firms or opening offices in other regions. It’s quite a big step, and—because it involves more risk—it does not make a lot of sense until a company has reached a specific size. Cloud software vendors are particularly well-positioned to grow globally with lower risk. However, at the time of this publication, cloud vendors are still only a small portion of the overall enterprise vendor marketplace. Getting back to the main point, it creates an unequal playing field if the lack of global references counts against a software vendor. I know of several smaller vendors with products far superior to those of the most prominent vendors in the world, and I would not think of letting their lack of global reach lead me to downgrade them as a vendor. Louis Columbus echoes this in his article for Commerce Times.
“It’s fairly common to see the industry’s largest IT companies in the Leader Quadrant, and that’s because these firms with the most resources have the ability to execute on a global scale. But what is lost in the Quadrant are the vendors with agility, responsiveness and close alignment with their customers’ needs.”
I completely agree with this quotation. My implementation experience has taught me that software vendor size does not lead to either quality software or higher implementation success and that most of the best applications and values reside with the smaller software vendors. But in the Magic Quadrant, vendor size counts for quite a bit.
Choosing Magic Quadrants to Analyze
In some Magic Quadrants, the product deficiency of the Magic Quadrant methodology is not addressed. However, I found the Magic Quadrant for Business Intelligence and Analytical Platforms for 2013 (which I use on several occasions in this book because of all the Gartner reports I read) to be the most thorough and to address the functionality.
Gartner’s 2013 Quotes on the Business Intelligence and Analytics Platforms MQ
“Survey data suggests that Birst is the ‘new darling’ of the Magic Quadrant (like Tableau Software and QlikTech before it). Its customers rated Birst No. 1 in product functionality and customer (that is, product quality, no problems with software, support) and sales experience, with the near-highest or highest scores across all 14 functional areas, performance and ease of use.
Although Birst is a relatively new cloud-based vendor, the platform functionality encompasses all 15 functional areas evaluated in the Magic Quadrant process. Moreover, despite targeting midsize enterprises and departments, the product offers a range of enterprise information management and governance features with integrated data connectivity for a broad range of enterprise applications, data warehouse model autogeneration. Also it has auto metadata creation for building a unified semantic layer modeled on top of Birst’s relational OLAP (ROLAP) engine and in-memory columnar database (or range of third-party databases, including Oracle, SQL Server, ParAccel, Infobright and so on).
Birst’s single front-end user interface for report, ad hoc, dashboard creation, interactive analysis and data discovery is a particularly attractive feature of the platform because it encourages broad use of the functionality. Birst customers report among the highest breadth of use of the platform’s functionality of any vendor participating in the Magic Quadrant survey. In particular, Birst customers report among the highest percentage of use of static and parameterized reporting, dashboard and interactive visualization functionality of any vendor in the survey.”
How Did Gartner Rank Birst?
However, while Gartner scores Birst exceptionally high regarding its functionality, it should be no surprise that Birst could get no higher than the Challenger quadrant.
See the Magic Quadrant graphic below:
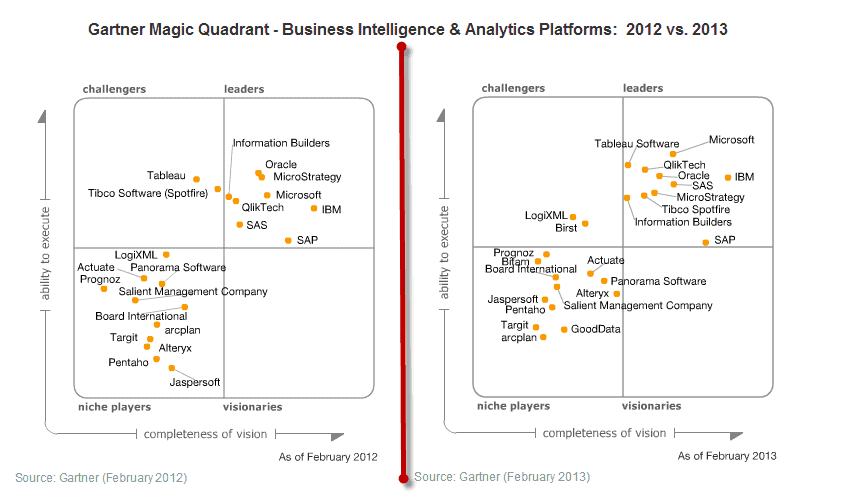
How did Birst appear from nowhere in the MQ in 2012 to its 2013 position in the MQ?
Comparing Birst to SAP
Compare Birst to SAP, which is on the opposite side of the continuum from Birst. SAP is a vast and established company. However, it has a weak product in SAP BI, and a product they acquired called Business Objects back in 2007, which was supposed to be integrated into SAP BI but never actually was integrated.
- I am very familiar with SAP’s business intelligence products because they are implemented in SAP BI’s productivity. I see Business Objects much less frequently on my projects, but SAP BI is omnipresent and never fails to meet the client’s expectations.
- SAP BI reports are so late, and the productivity of SAP BI is so low that its lack of output is shocking. If an enterprise application with lower value-added is as broadly purchased as SAP BI, I would like to know what that is…Cognos perhaps?
The Gartner “Caution Section”
Gartner acknowledges the problems in the caution section of the SAP profile for BI, where they state:
“When respondents were asked which product-specific limitations were barriers to wider deployment, more SAP respondents cited software quality than for any other vendor. Of all SAP’s references, 20.17% cited this limitation, compared with an average of 6.2% across all vendor references. When asked about problems with the software, a greater percentage of SAP references cited ‘unreliable, unstable and/or buggy’ than for any other vendor in the Magic Quadrant. Much of this poor product quality can be attributed to the challenge of integrating and supporting multiple code bases, such as BW, Web Intelligence, Crystal Reports and Dashboards.”
There are three enormous problems with this analysis. I want to be very specific here because these issues could easily be overlooked.
- SAP BI/BW[1] has all these quality problems, which have nothing to do with integrating and supporting multiple code bases, such as BW, Web Intelligence, Crystal Reports, and Dashboards.
- What Gartner is referring to here is primarily the integration of the products from the Business Objects acquisition. It is well-known in the industry that SAP has done a lousy job with Business Objects. Since SAP acquired Business Objects, the product has stagnated, prices have gone up, and customer support has declined; in other words, it has been a standard software vendor acquisition. However, this report was written in 2013. Let us remember that Business Objects was acquired in 2007. Shouldn’t SAP have ironed out the integration by this point? Why is Gartner cutting SAP such an enormous amount of slack for a confusing buyer right six years down the road? Finally, if it is not right after six years, when can we expect it to be right?
- Gartner is combining several issues, which will only confuse buyers about the nature of the problems with SAP’s Business Intelligence offerings. Buyers cannot make good decisions when such a fundamental cause and effect is obscured in this manner.
Gartner on SAP’s Lacking Support
Gartner goes on to criticize SAP for its support.
“In addition to poor product quality, customers have complained about unsatisfactory support. In our latest survey, SAP ranked last in customer experience and sales experience. Unfortunately for SAP customers, it isn’t a matter of just one bad year, because SAP has consistently ranked at or near the bottom of customer support since Gartner started this series of surveys in 2008.”
This is precisely what I have experienced during projects, so Gartner is in line with my personal experiences.
They go on to say the following:
“When compared with other vendors in the survey, SAP scored below average across all 15 BI platform capabilities evaluated during the Magic Quadrant research process.”
I agree with this, as well. BI is an extremely weak application.
Making Sense of Gartner’s Statements Verus the Magic Quadrant Result
If one looks at the items listed under the strengths area of the SAP profile in this report, most of the issues are related to either SAP’s size (they are the top deployed vendor in the world), or to optimistic predictions for the future. However, how can a vendor with SAP’s compromised quality and customer service problems in Business Intelligence be listed in this space’s leader category? Granted, they are barely a Leader, but they are still in the Leader category. On the other hand, The product’s qualities in the Business Intelligence space, so does that simple fact alone make them a Leader? Some may say the largest vendor by software sales is the leader, no matter the product’s quality. It’s not a simple question to answer. A marketing person would say SAP is the leader, but a product person like myself would choke at putting SAP high in a Magic Quadrant for Business Intelligence.
Gartner’s Large Vendor Bias
In its website and other documentation, Gartner repeatedly points that they are wholly objective. As an IT consultant with many years of experience, I can say unequivocally that the most innovative products do not come from the more significant software vendors. The most innovative vendors I know of are small, and in fact, the more significant vendors tend to focus more on marketing and sales than on software innovation. This topic is covered in the link.
When more significant software vendors are allowed to purchase smaller software vendors (often to eliminate a competitor and to acquire their customers)
However, the most prominent software vendors are consistently ranked highest by Gartner, even where the more significant vendors have marginal products and the smaller vendors have superior products.
The Specifics of a Large Vendor Bias
Let me state precisely what I mean by a “large vendor bias”. If identical software existed in two vendors, where one was more significant than the other, the more significant vendor would be rated higher in the software category than the smaller vendor.
I want to point out that I don’t think it’s possible to rank anything without having some bias. People tend to be uncomfortable around the term “bias,” but they shouldn’t be because bias is near-universal. For instance, if I look at other software’s secondary factors, my Magic Quadrant would have the vendors in very different positions from Gartner’s. This is because my bias is to focus on the application and to look at other factors as secondary. So, while being unbiased is the goal of any analyst, it’s not possible. I can say that Brightwork Research & Analysis does not have a financial bias because the articles are free, and I am not paid by vendors or anyone else to write them. However, financial bias is, of course, only one of the many types of bias.
How Large Vendor Bias Is Introduced
I am convinced that Gartner does not alter the numbers in its reports but instead selects a methodology that benefits more significant and established vendors. Repeated observations of this outcome from various Gartner reports make this conclusion unavoidable. However, it is unclear if this bias is due (either entirely or partially)to the money paid by the most prominent vendors or if Gartner represents the interests of large buyers who tend to want to buy their software from larger vendors. Gartner knows its market very well, so it may merely be that Gartner has modeled its methodology based on the criteria that large buyers themselves look for. The application’s functionality is the main focus to software-oriented people such as myself, but to large corporations, it is not the focus. Many other factors play into their decision.
The Real Story on Gartner’s Anti Small Vendor Bias
Here are some interesting comments on the topic, and these quotations give insight into Gartner’s objectivity.
“On Magic Quadrant’s perception is reality. Go look at the 40 to 50 Magic Quadrants you issue and see how few smaller, innovative vendors show up on top right. You have the data points—but with so many markets going through rapid change it rewards established vendors far longer than it should because they are more ‘viable.’ Time to question the MQ methodology. I would say… at the firm level Gartner looks like a mouthpiece for larger vendors.”– Vinnie Mirchandani
And the following quotation.
“The biggest potential trap for you with this MQ is Gartner’s continued over-weighting of ‘name’ vendors. It is only a slight overstatement to say that the bigger the software vendor, the weaker their WCM tool. It’s been that way for more than a decade. This does not mean that only small vendors and open source projects can create great Web CMS packages. Larger vendors just seem to lack the agility and interest to keep up. It’s not a big market, and their attention lies elsewhere.
This has real consequences for you if you select a tool based on putative staying power or supposed platform consistency of an IBM, Open Text, Oracle, Microsoft, or Autonomy. For some bitter history here, you have only to look at the train-wrecks that were implementations of EMC’s now deprecated WCM products. Customers bought EMC’s web content management tools for a variety of reasons: perceived platform consistency, the free licenses thrown into document management mega-deals, and last but not least: favorable analyst reviews. Many of these implementations became failures of epic proportions, sometimes with career-stifling consequences for project leaders (but alas, rarely any blowback for the people who recommended the tool). This is serious stuff, folks.” – Tony Byrne of Real Story
The Ways Gartner Shows a Large Vendor Preference Enumerated
How Gartner shows a preference for large vendors are listed below:
- A number of the criteria in the Magic Quadrant explicitly give an advantage to prominent vendors over smaller vendors.
- Gartner prefers software vendors that are diversifying their portfolio and have broad offerings. Gartner places “suites” of products into Magic Quadrants, making it impossible for smaller vendors to perform well. For example, no Magic Quadrant exists for production planning software. If a vendor only made production planning software, how could they ever perform well in a general supply chain planning Magic Quadrant when competing against a software suite? I have also seen buyers make enormous mistakes buying production and demand planning software because the products were part of a large vendor’s suite. The supply chain planning Magic Quadrant score led these buyers to complete suites-specific software applications in the suite. Gartner may say that these companies should have spent more time and money leveraging Gartner analysts to get a fuller picture of the specific software within the suite.
- Gartner sometimes places revenue cutoffs, which exclude many smaller vendors from the Magic Quadrant. The revenue cutoff sometimes meets their clients’ needs and reduces the number of companies for which a complete analysis must be performed. Still, it shows a preference for the larger vendors in a category. I know some fantastic software companies with great software buys but low revenues.
- Gartner will rate vendors in categories for which they do not have products under the logic that they will have a product.
- Gartner focuses some analytical products on small vendors and emerging technologies (Magic Quadrants are for stable technologies), most notably cool vendors; however, these are not anywhere close to as influential with decision-makers as the Magic Quadrant. The most likely explanation for the existence of these types of awards is to maintain the technology advisor services revenue that it receives from smaller vendors.
- A vendor can have the lowest quality software and overall support in a software category (as with SAP with the BI Magic Quadrant) and still find itself in the Leader quadrant (although not highly rated in the Leader quadrant) based on software revenues and vendor size.
- As with most business media, Gartner writes articles on acquisitions of smaller vendors by more prominent vendors that are primarily positive. Gartner essentially writes from the perspective of the acquiring vendor. Anti-competitive issues or the reduction in innovation (both have repeatedly been demonstrated as the natural consequences of acquisitions in the software area) are not Gartner’s focus. I have never read a report by Gartner on acquisitions that also explains that costs tend to rise while support tends to decline, as the acquired product tends to stagnate. Gartner does not point out to its readers that many acquisitions have nothing to do with acquiring software but are about acquiring customers and knocking out a competitor. For Gartner, size means more financial resources and more stability. Either Gartner has an exceedingly simplistic understanding of the broader competitive issues brought to the enterprise software area by mergers or the influence of more significant vendors, so it captures them that expressing a more nuanced analysis is of no interest to them. For example, I have written articles stating that it is clearly past the time when the Federal Trade Commission (FTC) investigates SAP for anti-competitive market practices. I have also provided a large pool of evidence that the FTC could work from to assist in these regards (see the article link). However, Gartner will never publish this type of article.
Reasons for the Large Vendor Bias
Three main reasons can be reasonably given for Gartner’s significant vendor bias.
- Large vendors can pay more for consulting fees and events than smaller ones.
- Larger vendors can allocate more people to work with Gartner and know how to present the vendor’s products to Gartner. The book Up and to the Right shows software vendors how to get high rankings—is at least some evidence that a high ranking is not based merely on the quality of a vendor’s software or “vision.”
- Most of the smaller software vendors are also much younger than the large ones and are not savvy to the analysts’ game.
- Gartner appears to base its research upon the preferences of the large buyers that are its core market, causing it to design its methodologies such that larger vendors perform better, independent of the actual software.
How much each factor plays into this significant vendor bias is unknown and would be difficult to determine. However, for those seeking to adjust the ratings, the main point is that bias occurs and is noticeable. Therefore, when reviewing a Gartner report or a Magic Quadrant, it is a logical practice to “adjust” the more significant vendors down from where Gartner has them ranked. How much precisely is difficult to say; it’s not a perfect science. If Gartner published the specific ratings per criteria, removing the criteria that are unimportant to buyers and more relevant for investors and vice versa would be easier. However, Gartner does not do that, so all that can be stated reliably is that Gartner overrates the prominent vendors. However, through evolution, humans have developed sense organs that perceive some stimuli and not others. Depending upon the breed, dogs have a nose that is between 1,000 to 10,000 times more powerful than a human’s; however, their eyesight is considerably less powerful. Bias begins at the sensory organs and reflects what evolution decided to develop for that organism, choosing some capabilities over others.
Conclusion
Gartner’s evidence that they are unbiased is simple. Trust Gartner. Trust that an ombudsman will control all the analysts at Gartner. Trust that allowing Gartner to make money off technology investments while its analysts can’t lead to unbiased outcomes. It all comes down to blindly trusting Gartner.
And the Yankee Group, Aberdeen, Forrester, IDC, and others follow the same approach. They are not as prominent as Gartner, but they all refuse to declare who pays them while swearing that none of these payments affect how they write about the vendors or their products.