
How Valid is the Method Used by Transparency International’s Corruption Perception Index?
Executive Summary
- The Corruption Perception Index is widely quoted as ranking countries’ corruption levels.
- What is less discussed is the method used.

Introduction
Having some type of corruption index is not only a very imporant idea; Transparency International has done a very nice job of promoting its Corruption Perception Index. Transparency International appears to have good intentions in producing its index and is focused on reducing corruption. But the critical question is the method used by Transparency International, which is what we will cover in this article.
What Wikipedia Says About the Corruption Perception Index
Wikipedia has the following to say about the Corruption Perception Index.
The Corruption Perceptions Index (CPI) is an index which ranks countries “by their perceived levels of public sector[1] corruption, as determined by expert assessments and opinion surveys.”[2] The CPI generally defines corruption as an “abuse of entrusted power for private gain”.[3] The index is published annually by the non-governmental organisation Transparency International since 1995.
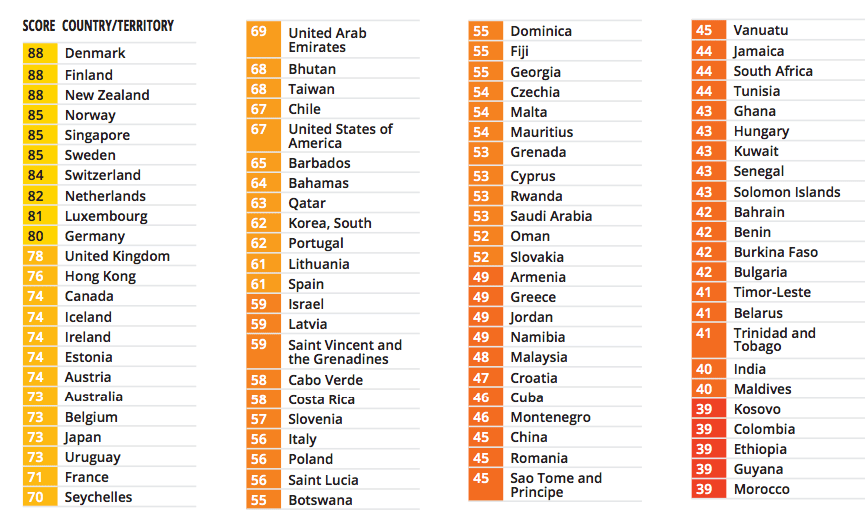
The 2021 CPI, published in January 2022, currently ranks 180 countries “on a scale from 100 (very clean) to 0 (highly corrupt)” based on the situation between May 2020 and May 2021.
The 2012 CPI takes into account 16 different surveys and assessments from 12 different institutions. – Wikipedia
And the problem is that Transparency International does not publish this method. Typically, one would have a table with a score for each component that makes up the method, and then each component could be independently evaluated. However, there is no publication of this information that we could find anywhere in the report.
Another problem is what is the weight of the different components? TI states that it is an “average.” However, is an average — which means all components are given an equal weight reasonable?
Probably not.
Some measurements of corruption must be weighted higher than others, representing a value judgment of the component. If the table were published, other people could apply different weights, resulting in multiple indexes. However, this cannot be done as the components are not published.
The problem is explained very well in the following quotation.
Therefore it is unclear what exactly the CPI is measuring, when sources which
measure such different aspects of corruption are averaged together. It is a bit like adding,
or in the CPI’s case averaging, apples and oranges. To give a rough example, suppose
that in city A there were 5 murders and 95 incidents of shopplifting, whereas in city B,
there were 95 murders and 5 incidents of shopplifting. The size of the population is the
same in both cities. Then, the total crime rate is the same in the two cities. But no one
would venture to say that they are equally safe cities to live in. This is an exaggerated
example of what happens in the CPI, where grand embezzlement and petty corruption are
treated as the same entity. Transparency International asserts that since the different
sources are highly correlated, then either people answer questions about corruption the
same way regardless of what exactly is asked, or that most countries suffer the types of
corruption. – Transparency International’s Corruption Perceptions Index: Whose Perceptions Are They Anyway?
Reliability of the Index From Year to Year
This issue is explained well in the following quotation.
Inspection of the corruption scores published in the Asian Intelligence Issues might make one suspect of their validity due to the large jumps
in scores over short time horizons (see Table 2). According to PERC’s ratings, Japan
became almost 2.4 times as corrupt (an increase of 138%) between 1996 and 1997.
China, India, and Malaysia also jump up almost two points each between 1998 and 1999.
The reason why one might doubt the reliability of these numbers is that corruption is
deep-rooted in a country, the result of a combination of factors, including weak
institutions (such as the judiciary and property rights), over-regulation, entrenched
bureaucracy, and an under-developed civic society and media. These factors are unlikely
to change so dramatically in a one-year period. That the scores display such unrealistic and dramatic variation is particularly troublesome for the CPI since up to three years of
Asian Intelligence survey data is included, giving it a particularly high weight. – Transparency International’s Corruption Perceptions Index: Whose Perceptions Are They Anyway?
The Problem With the People Filling in the Surveys
The first type of potential bias (as described by Transparency International) is
derived from the fact that when residents were surveyed about the prevalence of
corruption, they do not have experiences with other countries to which they might
compare their country. The assessment of a country is only useful in creating an index
like the CPI when that respondent’s appraisal is the result of comparisons with other
countries. Therefore, in surveys of residents, there was no benchmark to which residents
were comparing their home country, which suggests the possibility that cultural
background may have been a factor in survey responses. – Transparency International’s Corruption Perceptions Index: Whose Perceptions Are They Anyway?
Other criticisms of the index are as follows.
The Index was methodologically criticized in the past, i.e. questioned based on its methodology.
According to political scientist Dan Hough, three flaws in the Index include:
Corruption is too complex a concept to be captured by a single score. For instance, the nature of corruption in rural Kansas will be different from that in the city administration of New York, yet the Index measures them in the same way. – Wikipedia
This issue could be significantly addressed by publishing the method that we just discussed.
By measuring perceptions of corruption, as opposed to corruption itself, the Index may simply be reinforcing existing stereotypes and cliches.
The Index only measures public sector corruption, ignoring the private sector. This, for instance, means the well-publicized Libor scandal or the VW emissions scandal are not counted as corrupt actions. – Wikipedia
Only Measuring Corruption of the Government
When we first started using the CPI, we first thought that the method must be published, but second, we thought it measured the overall corruption of each country — so both public and private. However, upon reviewing the method, we found the following.
The CPI focuses on corruption in the public sector and defines corruption as the abuse of public office for private gain. The surveys used in compiling the CPI ask questions that relate to the misuse of public power for private benefit, with a focus, for example, on bribe-taking by public officials in public procurement. The sources do not distinguish between administrative and political corruption or between petty and grand corruption. – Internet Center for Corruption Research
This means it is not the overall corruption of the country. The index should be renamed to reflect what it is measuring.
More Explanation on the Method
The following quote provides more important information.
The Corruption Perceptions Index (CPI) is derived by aggregating 13 different perception surveys. There is a striking commonality in the people whose perceptions are actually assessed: “a group of country economists,” “recognized country experts,” “two experts per country,” “experts based primarily in London (but also in New York, Hong Kong, Beijing and Shanghai) who are supported by a global network of in-country specialists,” “staff and consultants,” “over 100 in-house country specialists, who also draw on the expert opinions of in-country freelancers, clients and other contacts,” “4,200 business executives,” “100 business executives … in each country,” “staff,” “100 business executives from 30 different countries/territories,” “staff (experts),” “100 business executives per country/territory,” and finally “over 2,000 experts and 66,000 other individuals from around the world have participated [to date].” – CGDev
This explains the large number of people involved in the process.
Reality Check: Evaluating the Ranking for One Country – The UK
The United Kingdom is another example that raises legitimate questions about the accuracy of the CPI. The UK is currently ranked eighth on the CPI with a score of 82. The British capital London, one of the world’s biggest and most important financial hubs, however, is paradisiac for money launderers. The National Crime Agency estimates roughly 117 billion US dollars of illicit funds are laundered through the UK each year. Recent developments show that the UK is slowly acknowledging corruption problems and are taking the first steps towards combating it. One of these measures is, for instance, this year’s newly established Unexplained Wealth Order which allows British courts to ask for the sources of wealth of suspicious individuals. – Gain Integrity
This quote brings up an interesting point — can a country with such a large banking industry, which is known for money laundering, actually score as the 8th least corrupt country in the world?
I have a few questions myself regarding the ranking.
Question #1
How can the United Arab Emirates score above the US, Qatar score just below the US, with Portugal being below Qatar?
These countries have massive quantities of slaves or pseudo-slaves, which are part of the “kafala system.” Let us review this system because it makes the countries with this system impossibly high versus reality.
The Kafala System
The lack of regulations and protections for migrant workers’ rights often results in low wages, poor working conditions, and employee abuse. Racial discrimination and gender-based violence are endemic.
Because the system falls under the jurisdiction of interior ministries, rather than labor ministries, workers have no protection under the host country’s labor law. This leaves them vulnerable to exploitation and denies them such rights as the ability to enter a labor dispute process or join a union.
In most situations, workers need their sponsor’s permission to transfer jobs, end employment, and enter or exit the host country. Leaving the workplace without permission is an offense that results in the termination of the worker’s legal status and potentially imprisonment or deportation, even if the worker is fleeing abuse.
The system has produced massive demographic changes: the Gulf region’s population increased tenfold in fifty years, and foreigners now outnumber locals [PDF] in all GCC states but Saudi Arabia.
Critics have called the system “modern slavery,” saying mistreatment arises from the sponsor-worker power imbalance and sponsors’ legal impunity. Moreover, the Middle East lags behind other regions in ratifying international agreements that protect workers.
Racism often magnifies the inhumane treatment of darker-skinned African and South Asian workers. A 2020 UN report on racism in Qatar found that foreign workers of all income levels reported that their salaries depended on their countries of origin, and that “despite possessing professional degrees, some migrant workers reported being relegated to low-income jobs most commonly linked to and occupied by workers of their racial or ethnic group.”
Gender-based discrimination is also rampant. Domestic workers, usually women, face the most abuse, including sexual violence. But victims often choose not to report, afraid to upset their sponsors or even be charged with a crime themselves. – Council of Foreign Relations
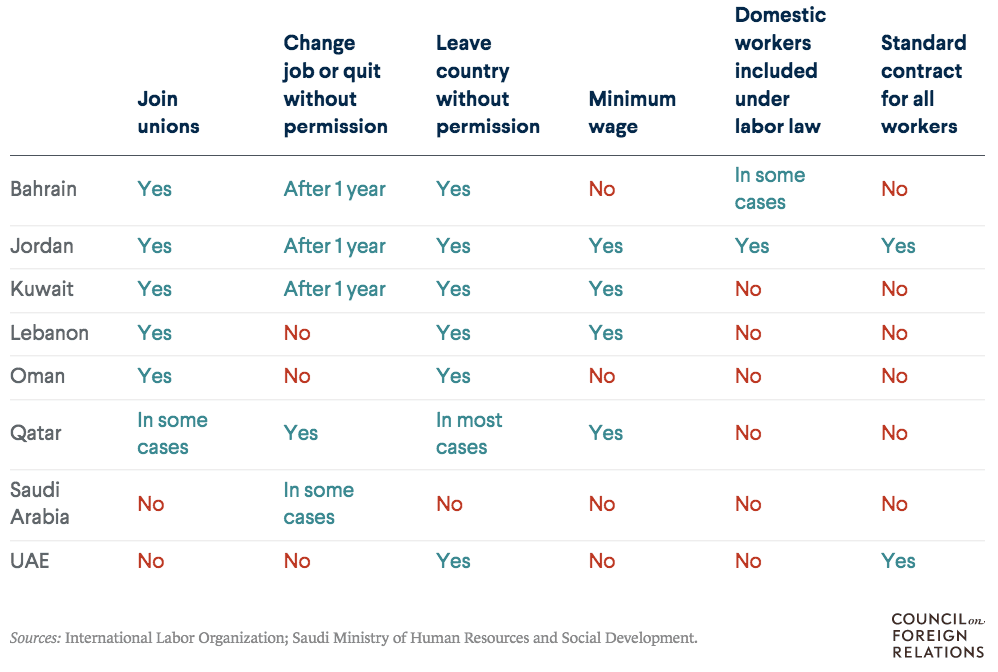
This graphic shows the many countries that practice the kafala system.
Furthermore, in all of these countries but Saudi Arabia, more people live in the country as kafala workers than those not.
How can countries that have more inhabitants living under the extraordinarily corrupt kafala system be ranked close to or higher than countries that do not have this system?
How Lawyers Overlook the Method Problems With Corruption Indexes
Lawyers use things like the Corruption Perception Index, but they tend not to analyze the method used in the CPI. This is expressed in the following quotation.
It has been said that “most lawyers went to law school because they did not like math as a subject.”185 It is therefore unsurprising that some lawyers overlook the intricacies of the statistical debate over measuring corruption and instead
endorse the use of perception data for FCPA compliance purposes. The popularity of corruption perception data in the legal community is exemplified by a recent Council of Foreign Relations corporate program meeting where one international law partner felt the need to give a “shout–out” to Transparency International for creating the CPI.186 Lawyers advise businesses subject to the FCPA to consult corruption perception data without warning them about the distinction between corruption perception and actual corruption or otherwise discussing the limitations of the data.187 One international lawyer and former U.S. Attorney said “Transparency International’s report is useful in evaluating the playing field around the world in terms of ethical business practices.”188 A recent article went so far as to claim that “TI and other web–based reports by groups and law firms focusing on the FCPA also assist firms in gauging the extent of the risk of corruption problems they will encounter doing business abroad.”189 Even scholars who still favor the limited use of corruption perception data agree that corruption perception data cannot form a valid basis for a transnational comparison of actual corruption and that attempting to do so is a serious misuse of the resource. The endemic misuse of corruption perception data in the legal community underscores the legal profession’s need for a better tool for evaluating and comparing country corruption compliance risk. At a minimum, lawyers must understand and explain the limitations of existing corruption data before
advising clients to use it for FCPA compliance purposes. – Perception is Not Reality: The FCPA, Brazil, and the Mismeasurement of Corruption
How The Index Functions As a Sanction on Countries That Score Poorly
We had no idea we would find this observation when we began researching the CPI.
A business leader, discussing anti–corruption regulations, stated that, “It’s very, very difficult to distinguish between the potential for corruption (or corruption risk) and actual corruption.”191 This comment is suggestive of this article’s thesis: It is hard for business leaders to measure actual
corruption, so their adversity to potentially massive FCPA liability risk induces them to avoid business in countries that are seen as corrupt.192 American businesspeople in corrupt markets are forced to either violate the FCPA and face
potential prosecution or behave ethically and lose business to Chinese or Russian competitors whose governments do not punish companies for acts of overseas bribery. 193 University of
Chicago–Kent College of Law Professor Andrew Spalding argues that the FCPA deters American companies from investing in developing countries, making it essentially function as an economic sanction. – Perception is Not Reality: The FCPA, Brazil, and the Mismeasurement of Corruption
And this goes to the heart of the problem of the CPI.
Unfortunately it is impossible to accurately measure corruption itself, and the most popular
proxy to date is the aggregation of a number of surveys of opinions. The aggregation of opinion is still nothing more than opinion — and in this case there is little observed correspondence between perception and reality. In spite of these flaws some members of the legal profession have
wholeheartedly endorsed the use of perception data for anti–corruption compliance, which is problematic since existing data suggests that some companies completely avoid countries that
they perceive to be an anti–corruption compliance risk. – Perception is Not Reality: The FCPA, Brazil, and the Mismeasurement of Corruption
How China and Russia Are Black Knights
We had never heard the term black knight before, but this is common in international investing.
As previously noted, “black knights” like China and Russia are generally thought to fill any gaps left by American businesses that are too risk–averse to invest in countries perceived to be corrupt.203 Some Brazilian policymakers might consider it
tempting to let Chinese investors fill the gap left by American businesses too afraid of FCPA liability to invest in Brazil. – Perception is Not Reality: The FCPA, Brazil, and the Mismeasurement of Corruption
Conclusion
Having some type of measurement of corruption is extremely important. However, a very tiny amount of effort has gone into ranking and analyzing corruption. Transparency International has well-developed content and has gotten the word out about corruption and the importance of focusing on it. The problem comes in that the method used by Transparency International is not apparent, and this is a sign of weakness with the index.
If Transparency International thought publishing the table that makes up the index would increase their credibility, they would publish it. They don’t mean that the table would expose problems with the index and therefore reduce its credibility. It is also a research standard that the method’s data be published.
Furthermore, the CPI is being used to determine investments. And as it has substantial implications, it needs to be more public and follow research rules, which means providing the details of the method and the numbers used for each component.
Further Interesting Quotes
three major composite indicators of corruption are used extensively in this analysis: (1) Transparency International’s ‘Corruption Perceptions Index’ (CPI), which focuses on overall political corruption; (2) the World Bank’s ‘Control of Corruption’
(CC) dimension of governance, which is a broader measure of public sector corruption;
and (3) the World Bank’s ‘Government Effectiveness’, a dimension of governance
much more focused on the non-elected public sector. – World Bank
This is curious because the World Bank is just an extension of the US Treasury and, therefore, an extension of US foreign policy. Such an index produced and controlled by the World Bank would invariably be used to reward those countries that are friendly to US foreign policy and punish those that are not.