
Introduction to SAP APO DP
Executive Summary
- Demand Planning or DP covers forecasting is SAP APO’s most popular application.
- We cover the basic functionality and concepts of SAP DP.
Introduction
In this article, you’ll get a high-level overview of the entire SAP APO DP.
For some time, the main area of differentiation between forecasting software was the algorithm used to drive the results. However, over the past few years, software companies began using more sophisticated databases that allowed fast response times for looking and forecasting at different levels in the product, location, and time dimensions.
How SAP DP Can be Implemented
SAP Demand Planning (DP) in SAP APO offers forecasting and database capabilities that integrate with SAP APO Supply Network Planning (SNP). SAP DP can also be implemented at very different levels; for example, it can be used to model at a high or detailed level. It can quickly roll up forecasts at various levels in the hierarchy. Companies also find SAP DP convenient because it uses the same underlying database as SAP NetWeaver Business Warehouse (BW), the SAP data warehousing solution.
For some time, SAP DP was the only SAP APO application that used the Data Warehouse Workbench, but this changed with the introduction of SAP Service Parts Planning (SAP SPP), which uses the Data Warehouse Workbench the same way as SAP DP. However, SPP does this for service parts, while SAP DP is used to forecast finished goods. The forecasting methodologies for service parts benefit from a custom service solution. But if a company hasn’t implemented SAP SPP or doesn’t intend to, SAP DP can be used for service parts forecasting, though with a less effective and less accurate result. More specifically, with the same demand history, SAP DP tends to forecast a higher unit quantity.
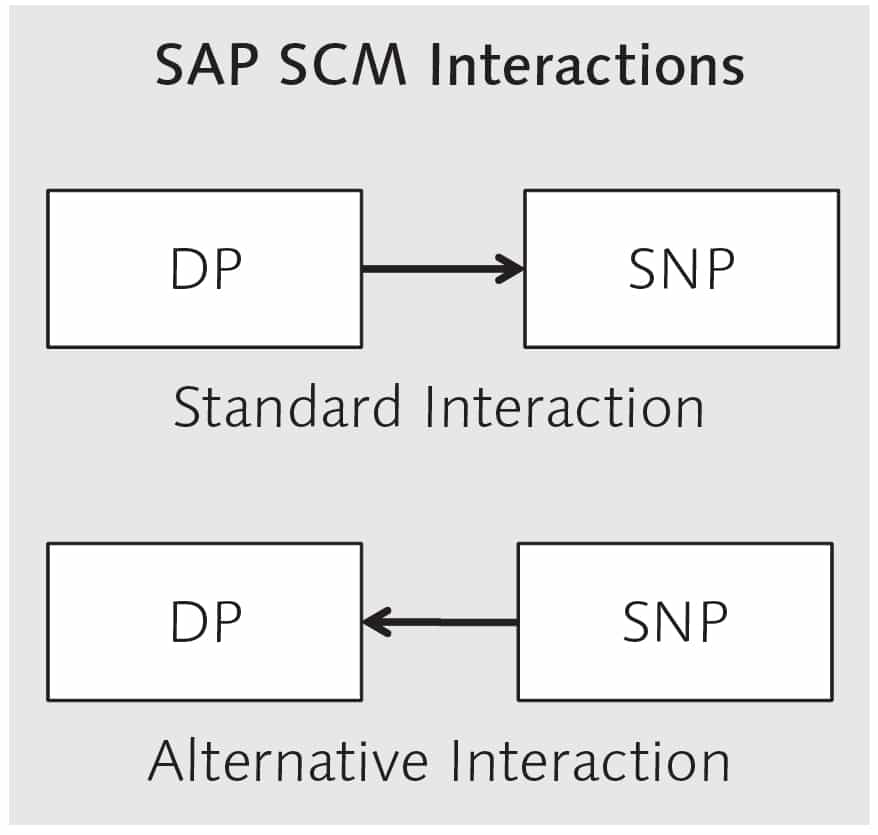
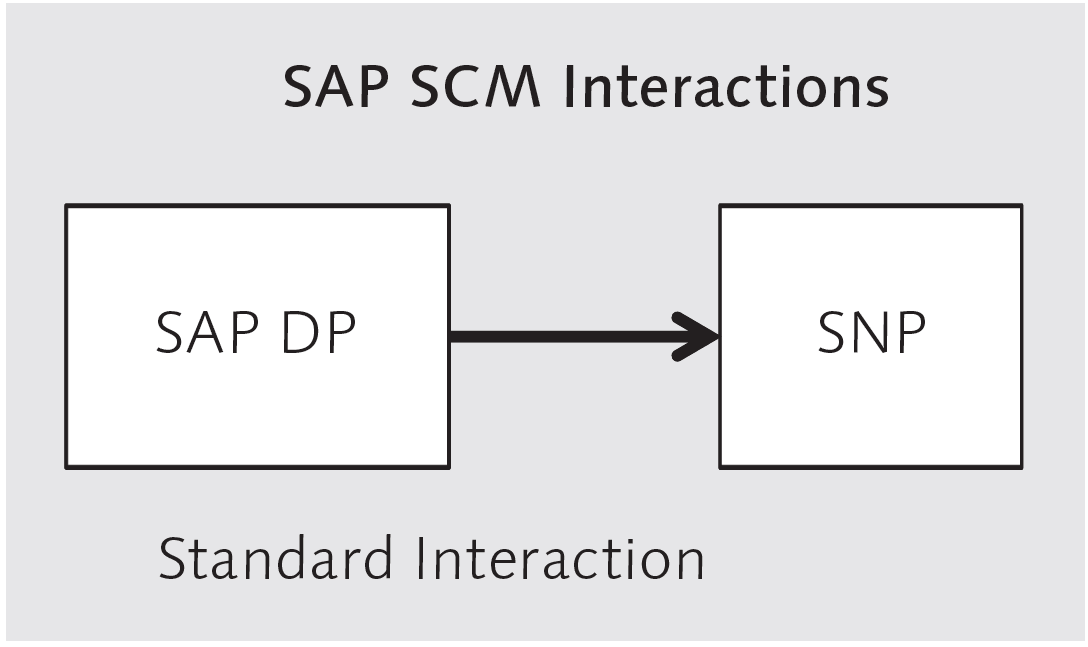
One of the most common workflows in SAP SCM is for DP to produce the demand plan and be sent to SNP. However, this example is only one of a few possible workflows between the systems. The supply plan, which SNP created, can also be sent from SNP to SAP ERP, and it can also be sent to DP, as you can see in.
Demand Planning as SAP APO’s Most Popular Application
SAP DP is the most widely installed of the SAP APO applications. Along with Supply Network Planning (SNP) and Production Planning and Detailed Scheduling (PP/DS), SAP DP is one of the original applications introduced with SAP APO. SAP DP has been popular because many businesses are interested in forecasting and are typically striving for continuous improvement in the quality of their forecasts. And while SAP ERP has some basic forecasting functionality, SAP DP’s forecasting capability is far more advanced. SAP DP fills a need for clients who are already SAP ERP customers.
For those customers who don’t have SAP ERP or SAP APO, DP offers several advantages over other offerings, including integrating the forecasting system into the rest of the enterprise. SAP ERP can be run with its internal forecasting capability, or this functionality can be disabled, and SAP DP can be used to send the demand plan directly to SAP ERP. It can also be used along with SNP, allowing SNP to perform the supply planning and communicating the purchase requisitions to SAP ERP.
Forecasting in SAP APO is performed in SAP DP and several other places, including SAP SPP and F&R. For example, Expected Goods Receipt functionality can be seen as a forecast in SAP EWM, and SAP SNC manages forecasts.
Basic Functionality and Concepts of SAP DP
There is a natural, common process flow to SAP DP that many companies
use, as illustrated in Figure 3.2:
- Receive data from different sources.
- Perform forecasting.
- Manually check the forecast.
- Release the forecast to SNP.
Two Halves of Demand Planning
SAP DP has two major components that require two very different skills.
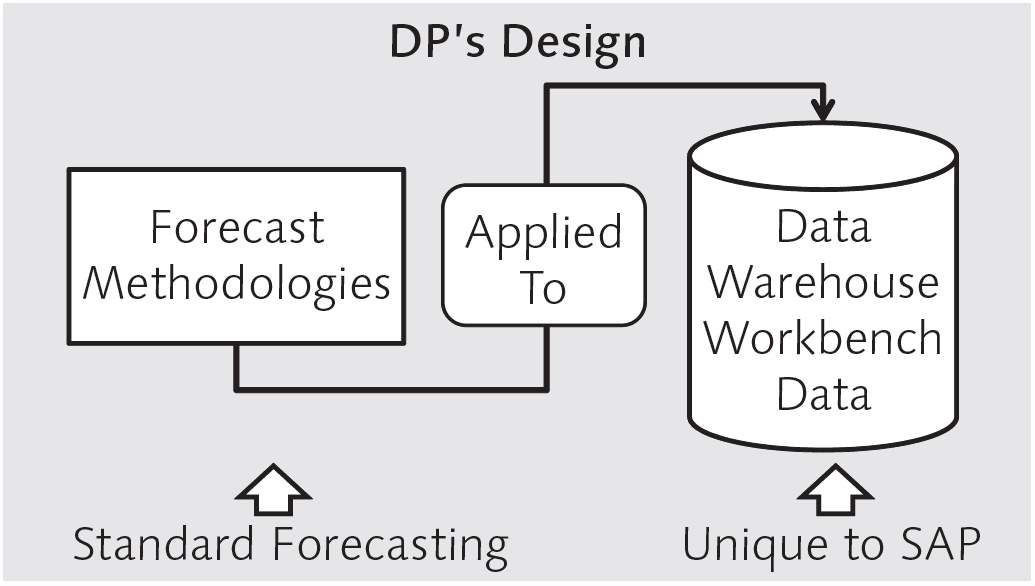
- One-half of SAP DP is the Data Warehouse Workbench, which sets up all data structures and transfers rules from other systems to populate the model with data. And because SAP DP deals with large amounts of historical data, it (along with SAP Service Parts Planning [SPP], which uses the same data tools) has the greatest data emphasis of any SAP SCM application.
- The second half of SAP DP is the actual forecasting portion. If you have been exposed to forecasting, SAP DP will be very familiar. All of the same forecasting techniques you’ve used in the past with other tools can be found in SAP DP. Figure 3.1 illustrates how the two halves of the SAP DP come together.
This is the most common interaction between SAP DP and any other application. However, not all implementations of SAP DP also implement
SNP, so when SNP isn’t used, SAP DP can pass the demand plan to another supply network application, or the demand plan can be sent to SAP ERP.
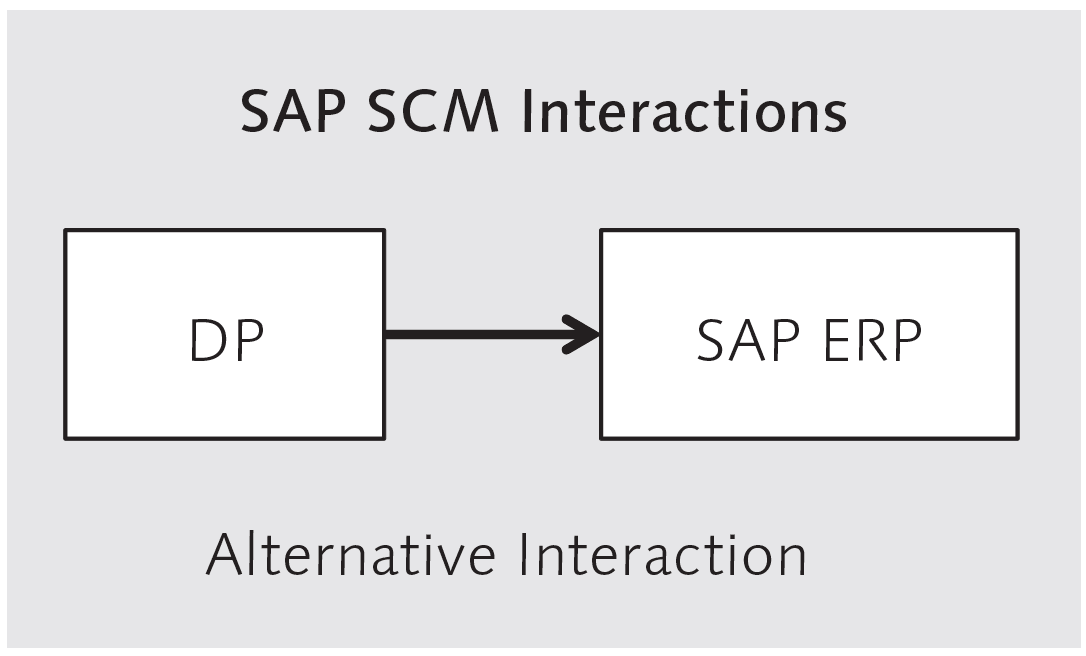
You can then use this demand plan to create planned independent requirements in SAP ERP. However, this isn’t the only alternative way to set up SAP DP to run in a process workflow. Another option is to send the forecast to Production Planning and Detailed Scheduling (PP/DS) to procure or produce individual components based upon the characteristic-based forecast. But the most common way of running SAP DP is in the background. It’s also the most efficient from a processing perspective. However, when a planner is trying to see how the forecast reacts to changes or is trying to break in a new forecast method, interactive planning is more desirable because interactive planning allows the planner to quickly observe how changes they make affect the forecast.
But the most common way of running SAP DP is in the background. It’s also the most efficient from a processing perspective. However, when a planner is trying to see how the forecast reacts to changes or is trying to break in a new forecast method, interactive planning is more desirable because interactive planning allows the planner to quickly observe how changes they make affect the forecast.
Demand Planner
In virtually every industry, companies are challenged by increasing customer expectations, stricter regulations, changing market dynamics, and the Web’s ongoing impact, all of which are compelling them to re-examine and refine how they forecast and manage demand. Supply chain planning is considered one of the more, if not the most critical processes. For some time, the main area of differentiation between forecasting software was the algorithm used to drive the results. However, over the past few years, software companies began using more sophisticated databases that allowed fast response times for looking and forecasting at different levels in the product, location, and time dimensions. SAP Demand Planning (DP) in SAP SCM offers robust forecasting and database capabilities that integrate very strongly with SAP SCM Supply Network Planning (SNP). SAP DP can also be implemented at very different levels; for example, it can be used to model at a high or detailed level. It can quickly roll up forecasts at various levels in the hierarchy. Companies also find SAP DP convenient.
DP Interactive Demand Planning
Interactive planning works best when the planner works with a more narrow set of data, so the planner can apply the necessary analysis to understand the impact of forecast changes. Interactive SAP DP has its view, which allows forecast comparison and aggregation and disaggregation. The Data Warehouse Workbench supports the flexibility in aggregation along the dimensions of the product, location, and time. A person with a good background in forecasting can understand the forecasting methodologies in SAP DP quickly. However, using the Data Warehouse Workbench is a specialized skill that takes time to acquire and a good deal of time to master.
In SAP DP, because the key figures are numerical values, you edit them in the Data Warehouse Workbench because it uses the same underlying database as SAP NetWeaver Business Warehouse (BW), which is the SAP data warehousing solution.
Demand Planning as SAP SCM’s Most Popular Application
SAP DP is the most widely installed of the SAP SCM applications. Along with Supply Network Planning (SNP) and Production Planning and Detailed Scheduling (PP/DS), SAP DP is one of the original applications introduced with SAP APO. SAP DP has been popular because many businesses are interested in forecasting and are typically striving for continuous improvement in the quality of their forecasts. And while SAP ERP has some basic forecasting functionality, SAP DP’s forecasting capability is far more advanced. SAP DP fills a need for clients who are already SAP ERP customers. For those customers who don’t have SAP ERP or SAP SCM, DP offers several advantages over other offerings, including integrating the forecasting system into the rest of the enterprise. SAP ERP can be run with its internal forecasting capability, or this functionality can be disabled, and SAP DP can be used to send the demand plan directly to SAP ERP. It can also be used along with SNP, allowing SNP to perform the supply planning and communicating the purchase requisitions to SAP ERP.
Two Halves of Demand Planning
SAP DP has two major components that require two very different skills. One half of SAP DP is the Data Warehouse Workbench, which sets up all of the data structures and transfer rules from other systems to populate the model with data. And because SAP DP deals with large amounts of historical data, it (along with SAP Service Parts Planning [SPP], which uses the same data tools) has the greatest data emphasis of any SAP SCM application.
Most clients use forecasting systems that are designed for finished goods systems to perform forecasting for service parts. The reason for this has to do with several factors. One is that many companies do not know that service parts have different forecasting requirements. For example, service parts are forecasted using a different probability distribution (Poisson or Negative Binomial rather than the Normal distribution used for finished goods). A second reason is that service parts planning forecasting as part of a differentiated software product is still relatively new and still gaining acceptance. SPP provides far more appropriate forecasts for service parts over SAP DP.
The second half of SAP DP is the actual forecasting portion. If you have been exposed to forecasting, SAP DP will be very familiar. All of the same forecasting techniques you’ve used in the past with other tools can be found in SAP DP. Figure 3.1 illustrates how the two halves of the SAP DP come together.
For some time, SAP DP was the only SAP SCM application that used the Data Warehouse Workbench, but this changed with the introduction of SAP Service Parts Planning (SAP SPP), which uses the Data Warehouse Workbench the same way as SAP DP. However, SPP does this for service parts, while SAP DP is used to forecast finished goods. The forecasting methodologies for service parts benefit from a custom service solution. But if a company hasn’t implemented SAP SPP or doesn’t intend to, SAP DP can be used for service parts forecasting, though with a less effective and less accurate result. More specifically, with the same demand history, SAP DP tends to forecast a higher unit quantity.
InfoObjects
Several types of InfoObjects are used, but the two most important are characteristics and key figures, as described in Table 3.1 and illustrated in Figure 3.4.

Key figures are numerical values because they represent the actual values to be forecasted. Characteristics, on the other hand, are the text headings for what is forecasted.
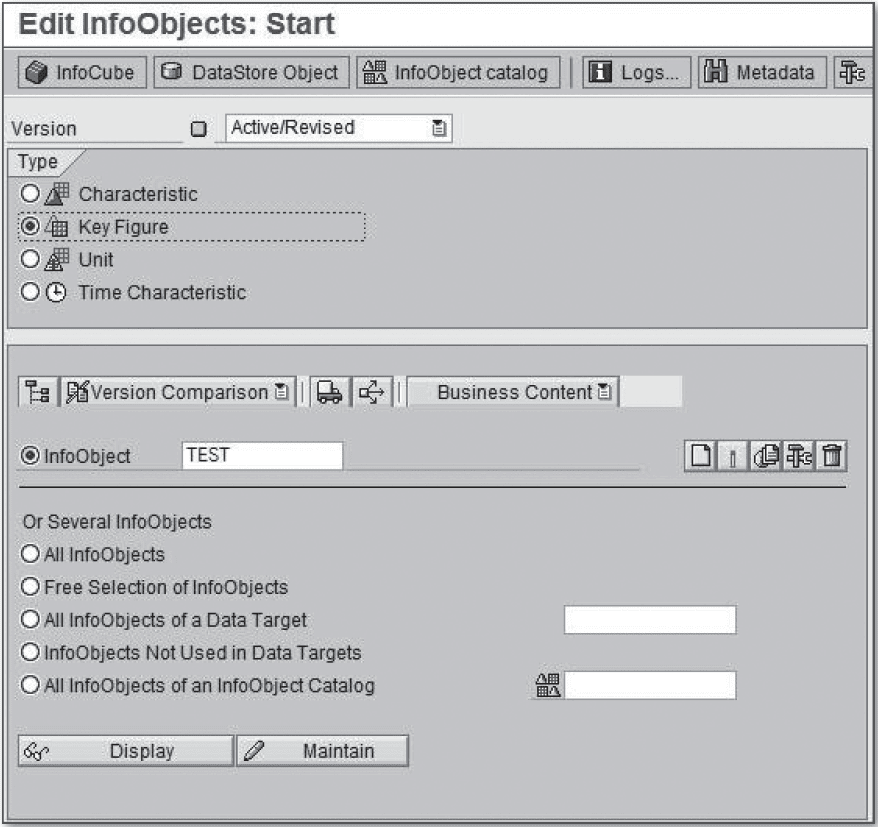
In SAP DP, because the key figures are numerical values, you edit them in the Data Warehouse Workbench (Figure 3.5).
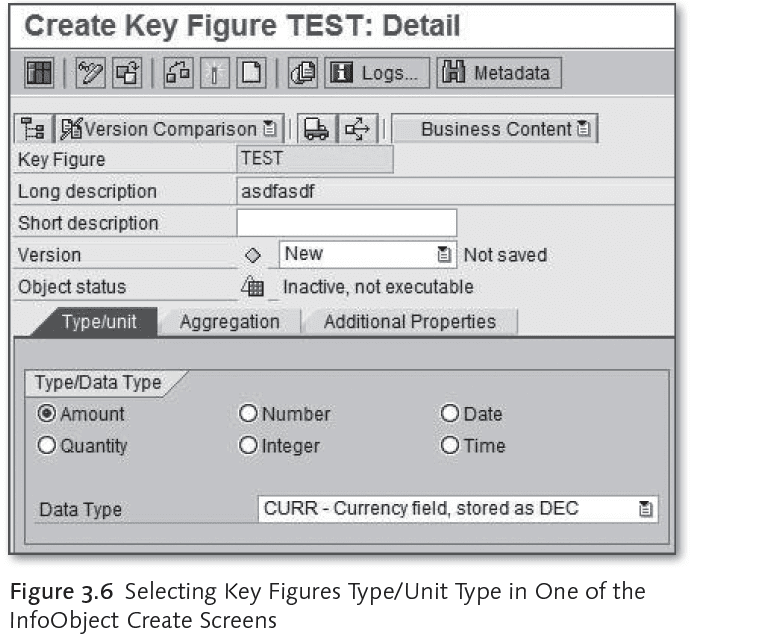
 This shows the different data types selected for creating key figures: Amount, Quantity, Number, Integer, Date, or Time. You’ll notice that all of the alternatives are numerical values. The actual process of setting up the InfoObjects is easy and can be set up very flexibly. The main issue is how to get the InfoObjects to represent the business.
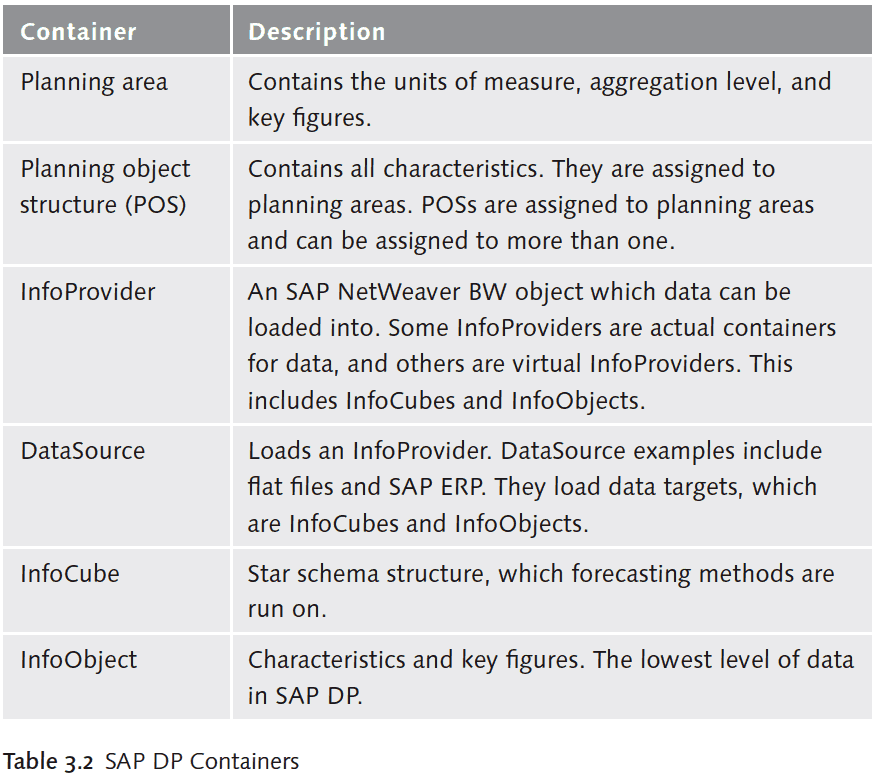
All of the InfoObjects used for forecasting must be configured in the Data Warehouse Workbench; however, the actual data to populate the InfoObjects are fed from other systems, such as from the history of sales orders in SAP ERP. Characteristic InfoObjects are placed in another container called a planning object structure (POS) (covered in Chapter 1). POS is one of the two main planning structures within SAP SCM; the other is the planning area. POS contains the characteristics, while the planning area contains the key figures. These two structures work in conjunction with one another to support SAP SCM. Sometimes, it seems the SAP DP objects are much like a Russian nested or Matryoshka doll, where one layer hides another, which reveals another. Similarly, there are many containers in SAP DP. A significant part of understanding SAP DP is simply learning which containers do what and which containers reside inside other containers. Table 3.2 provides a brief list of the most prominent SAP DP containers.
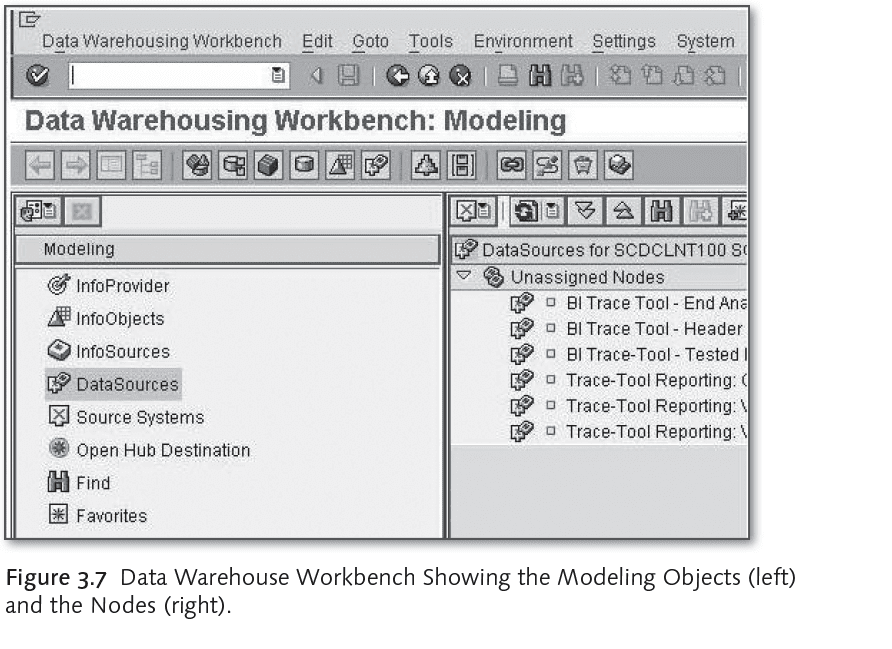
Many of the objects listed in Table 3.1 may be viewed in the Data Warehouse Workbench, where the objects are built and manipulated (Figure 3.7).
InfoCubes are built from several intermediate objects but incorporate the InfoObjects described in the previous paragraphs. InfoCubes InfoCubes are multidimensional structures that provide analytical capabilities such as drill-up and drill-down navigation.
They are “multidimensional” because the product, geography, and time dimensions are combined in an interrelated manner in the database. Several activities must happen to InfoObjects before they become InfoCubes, and most of the activity in the Data Warehouse Workbench is intended to move data into InfoCubes eventually. However, the SAP InfoCube is actually a misnomer. InfoCubes aren’t “data cubes” but instead star schemas. The distinction goes beyond simple nomenclature and has important implications.
TechTalk: Data Cubes Versus Star Schemas
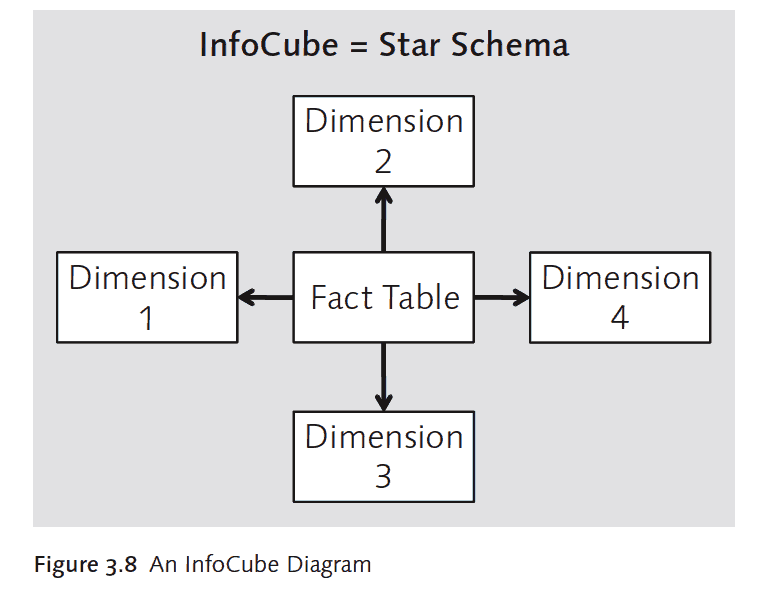
Data cubes are particular multidimensional data objects. One of the main features of data cubes is that they take time to build. While being built, the data cube isn’t accessible. However, the advantage of multidimensional data objects is their speed of query or report generation. On the other hand, star schemas are relational structures that are slower to query but have the advantage of a higher uptime percentage than data cubes. One mechanism isn’t better than the other; they have different advantages and disadvantages. However, SAP InfoCube is a star schema.
A star schema is a relational structure that has a fact table surrounded by dimension tables. Figure 3.8 shows the structure of an InfoCube, and Figure 3.9 shows how they appear in the Data Warehouse Workbench.
Forecasting
If you are familiar with forecasting, this should be easy to understand because forecasting methods for supply chains have been standardized for some time now. SAP DP’s forecasting methods can be selected from the Model tab of the planning book, discussed in detail in Chapter 1. However, the methods don’t necessarily have to be selected manually. SAP DP also provides best-fit functionality that allows it to choose from the different forecasting methodologies to pick the one that “best fits” with the historical trend line. This is a handy feature for automating the forecasting selection process and is activated by selecting Auto Model Sel 1 or 2 from the planning book’s Model tab. However, when SAP DP is implemented, it often, although not always as the case study in this chapter demonstrates, replaces the existing software-forecasting solution, so any new results provided by SAP DP’s best-fit calculations must be reconciled with what has been done up to the time of the new implementation.
This is part of the normal migration process. It is particularly true if the system that is being replaced doesn’t have best-fit functionality, or the best-fit functionality was not accessed or used. The use of the best-fit functionality may result in an extremely similar or identical inventory forecasting method to what has historically been used. However, either way, running the best-fit functionality can provide beneficial observations, and the best-fit functionality can be run repetitively. Additionally, there are factors in running the best-fit functionality that must be performed appropriately and fully documented to understand the best-fit selection.
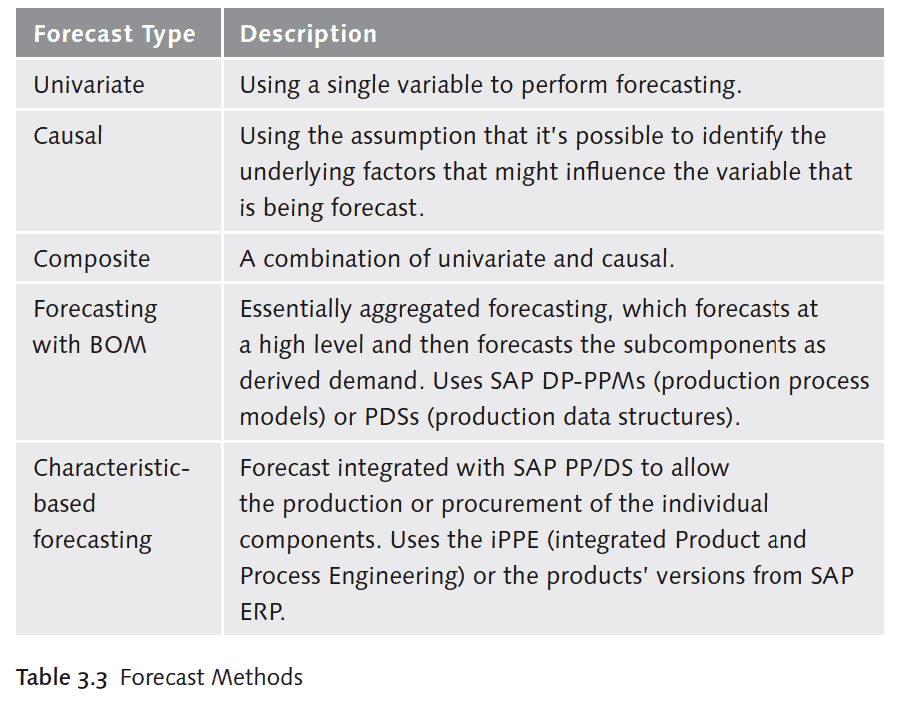
Forecasting Methods
The methods available within SAP DP and their descriptions are listed in Table 3.3.
Characteristic Value Combinations
Characteristic value combinations (CVCs) are one of the most important features of SAP DP — they are the master data of SAP DP. CVCs are used to create relationships between fields. For instance, the combination of the characteristic of sales with the region’s characteristic allows the model to show sales by region. And because forecasts are performed for all sold units (except at the highest levels, e.g., a financial forecast), CVCs are critical to creating complex multidimensional forecasts. CVCs are the combinations that are eventually displayed in the planning books to users. CVCs in an InfoCube can be as small as just two characteristics or as large as hundreds of CVCs. The ability to see more relationships is desirable but only up to a certain point. A large number of CVCs will negatively affect performance, so they must be added with a view toward the economy.
Several questions must be answered on SAP APO projects, including the right level of detail to model and how many CVCs to model. SAP DP provides significant capabilities in terms of the number of CVCs; however, each CVC takes up resources to manage. Again, the deciding factor is what is appropriate for the specific business need.
Realignment
CVCs aren’t stagnant because they represent business activities that aren’t stagnant. So CVCs must reflect the current configuration of the business and must change through time with the business. As new products are brought out and the organizational structure is altered, the CVCs must change because they represent the products. For instance, if an item is offered in new regions, this must be reflected in SAP DP. Some CVCs must be deleted, and some new CVCs added, as well as copying planning data between the CVCs. The procedure for doing this in SAP DP is called realignment. If you are experienced with data warehousing, this term will be familiar because it is used in other data warehousing solutions. Because you need to update the CVCs with the business continually, realignment is a critical housekeeping function for SAP DP.
There is another process connected to realignment called the copy function. Realignment for this process is complex and detailed, but for this book, you need to understand that realignment is the main activity to adjust the SAP DP data to changes in the business.
This concludes our look at some of the underpinnings of SAP DP, so now we’ll move on to a discussion of the more business-oriented functionalities of SAP DP.
Promotion
Forecasting Promotions forecasting is closely related to collaborative forecasting (discussed in Chapter 13, SAP Forecasting and Replenishment [F&R]) because when companies focus on promoting specific items, the forecasting system must reflect this, or the forecast will be in significant error. This adjustment to both the promoted item and items whose demand is related to the promoted item is called promotion forecasting. The promotion functionality in SAP DP allows historical sales data to be adjusted for the timing of previous promotions, so the promotion doesn’t erroneously influence future forecasts. There are several settings for promotional forecasting in interactive planning; however, some of the more interesting are listed in Table 3.4.

Releasing the Plan
Managing aggregation in SAP DP is a significant issue because forecasting at the right level has important implications for system performance. Forecasts are often aggregated both by product group and duration.
Plan Release and liveCache
SAP DP data are stored in liveCache, which is a combination of hardware memory and memory management software that allows planning calculations to be performed to meet the performance needs of SAP SCM. LiveCache is one of the components that allow users to interact with the data in memory through the planning book interface. After manual review and approval, the forecast is released from liveCache.
Plan Destination
When the demand plan is released to SNP or SAP ERP, the plan is most often disaggregated because SAP DP has the longest time horizon and is the most aggregated planning application in the SAP SCM suite. So while this is necessary and works for SAP DP, the other applications aren’t aggregated in this way, so a disaggregation process is necessary. This disaggregation is controllable by users and can be performed based on the equal measure, manual adjustment, or the averages of the level below the higher aggregation level. This is necessary for making the forecasting performed at a higher level usable for subsequent planning processes. This concludes our look at the core functionality of SAP DP. If you’ve used SAP DP in the past, you may recognize a few of the changes, but we’ll summarize the main improvements and wrap up with a real-world case study for those of you who are new.
SAP DP Release
History Recent improvements to SAP DP include the following:
- Point of sale data to create short-term statistical forecasting
- Re-initialization of forecast parameters and trend depending (placing limits on the values of the forecast)
- Configuration relevance for characteristic-dependent planning
- Customer forecast management (where customers regularly send forecasts data to the vendor, and where this is used as the basis for replenishment planning) These improvements provide extra functionality at the SAP DP margin and extend existing functionality by improving its maintainability.
Issues with DP
To perform effective forecast modeling, it is necessary to have SAP DP working properly. To do this, it is beneficial to know what are some common issues with SAP DP. This can prepare a company before implementation for what areas on which to focus, the common solutions, or what is often found to work for each of these issues. Preparing for each of these allows a company to do a better job of forecasting modeling.
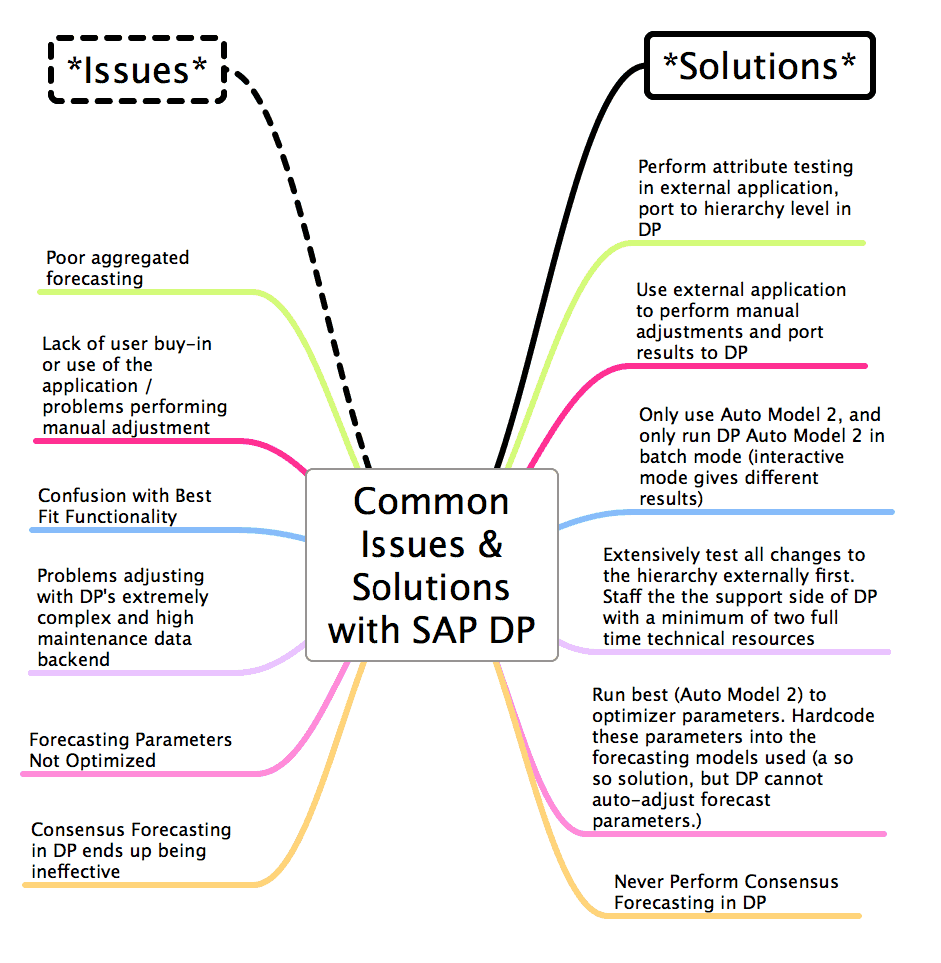
Notice how the colors are correlated to one another, and that is the color coding of the relationship between the issue and the solution.
Common Solutions to SAP DP Infographic
This graphic should help organize the areas to check to issues and where to begin.
Introduction
SAP DP is the most common of the SAP SCM application suite to be implemented. Companies that implement DP are often in for a surprise. DP has a tough to master data workbench. It also has a statistical and causal forecasting front end that is complicated to troubleshoot or even understand.
The result of all these limitations is that companies do not end up with the forecasting capabilities they thought they would have.
This means that it is common for SAP DP implementations around the world to enable the business to do the forecasting they want and should be able to do. In fact, after visiting eight clients with DP installed, we have yet to see a client use DP to support their forecasting process adequately. This article describes the issues of statistical forecasting and DP.
How Clients Respond
Many clients can be at a loss when this happens. They think that SAP is a well-established software company, and their implementation partner recommended SAP DP, as well as the fact that so many other companies have implemented DP. They take this all as evidence that they must have personally done something wrong in the implementation, or their users are resistant to change. While the consulting advice on DP implementations is, in fact, pretty poor, some of these issues are related to the product itself. Companies need advice on how to improve their DP implementation, but this information is not available from either the large consulting companies or from SAP. In fact, we have found most of the information provided by SAP to our clients not to be genuine and to contain multiple errors. One company was told by SAP that DP was not designed for their volumes. Interestingly, the client did not have a high SKU count.
Problems Fixed in the Later Version?
For years many companies have been hoping that problems with DP would be fixed with 7.0. After extensively analyzing 7.0, it turns out that there is little that addresses the main issues that clients have with DP. In fact, most development in SCM has moved to newer modules such as SPP and EWM.
This usually comes as a disappointment because SAP uses the promise of future releases to defend against fundamental design limitations of their products. SAP sells the vision of a future that never comes, and we are in the position of giving the news that the next release will not solve all of their problems.
Most SAP consultants who work in the DP can’t see its limitations and have no experience with other applications. They focus on maximizing their income and don’t have any room for accuracy about a product they specialize in. DP maximizes their income; ergo, DP is the best forecasting system in common usage. Most SAP consultants see their incentives to get you to use and keep using DP and only to accept its limitations and adjust your business to DP rather than developing the best solution. Most companies are using DP in such a limited way and lack the information to improve DP that we have yet to see a DP implementation that cannot be substantially improved.
Conclusion
SAP DP uses a complex data infrastructure to support standard forecasting techniques. This infrastructure is controlled through the Data Warehouse Workbench. SAP DP can send its demand plan to other SAP SCM applications such as SNP or SAP ERP. As the most implemented SAP SCM application, SAP DP has a large number of implementations behind it. Because companies tend to place significant forecasting resources, SAP DP is one of the most desirable of the SAP SCM applications to implement and is often the first application implemented. In the next chapter, we’ll cover Supply Network Planning (SNP).
References
My book on forecast parameters explains how to adjust Forecast Profiles in SAP DP.