
Executive Summary
- This is the Brightwork Research & Analysis software rating series.
- We both rate the software and estimate the risk of implementing each application.
MUFI Rating & Risk for Demand Works Smoothie
MUFI: Maintainability, Usability, Functionality, Implement ability
Vendor: Demand Works (Select For Vendor Profile)
Introduction
Demand Works is a highly innovative small software vendor. Their level of innovation is entirely disproportionate to the size of their company. Beyond just ranking their software along with their vision and implementation approach highly, Demand Works is one of the vendors that we use as evidence that most of the innovation in enterprise software comes not from the most prominent vendors, but the smaller vendors.
Application Detail
Smoothie is one of the value leaders in the demand planning space. In an area where applications attempt to outdo each other concerning the complexity of forecasting algorithms, Demand Works focuses on the parts of forecasting that most forecasting software vendors ignore, which are the following areas:
- The user interface and graphics
- Collaborative forecasting
- Auto parameter setting and the ease of use of best-fit forecasting
- File import and export
- Overall usability
- Attribute-based forecasting (both for top-down forecasting and navigation)
Some application have attribute-based forecasting (where attributes of the product are added to the product database – and these attributes can reflect the product, geographic or company characteristics) however, Smoothie is the best at it. If a company were to use Smoothie and not use attributes, they would be missing out on some great functionality. These attributes can be used to both perform what is referred to as top-down forecasting. This is where a forecast is performed at one level in the hierarchy and then pushed down to lower levels of hierarchy. But the attributes are also amazingly effective at allowing the user to navigate through the product/location database. This will enable groups of products to be highly efficiently managed and manipulated within the application. This type of functionality is traditionally much overlooked by corporate buyers.
Smoothie has multiple areas that make doing things in the application highly productive. For one, Smoothie will perform a best-fit procedure on products without requiring anything to be done by the user. A best-fit procedure matches the product’s demand history to the most appropriate forecasting method. Any product can have this best fit overwritten by through a manual override, but each product begins with being the best fit to a system selected forecasting method. This is so because a Smoothie’s best fit is automatically as soon as the data is loaded into the application.
Smoothie has robust promotional management capabilities, as well as the ability to quickly adjust history so that there is something called a resultant history as well as the actual history. The forecast goes off of the resultant history – meaning the altered history. Several demand planning applications in the market cannot do this, and many ERP systems also cannot do this, and this means that these companies cannot hold multiple “versions” of demand history in the application — which is an enormous liability for forecasting. However, with Smoothie, this functionality is not only standard but very easy to use. So during one project, we need to compare the forecast generated in one system with the manually adjusted forecast. This was easy to do because we added two reference rows, and then named these rows “Baseline Forecast,” and “Manual Forecast.” We could then very easily compare these two forecasts with the Smoothie forecast.
We rate each application separately per a business process category. However, Smoothie offers demand planning, collaborative demand planning, supply planning, inventory planning, finite capacity planning and S&OP, from the same user interface. If used like this, it would reduce the total cost of ownership even more as the software price goes up only incrementally and a company would receive an implementation and maintenance benefit of just having to manage one application. Unlike SAP products, where the advantage of using more applications from a single suite is mostly illusory because SAP applications are so different from one another, supply and demand planning within Smoothie use the same user interface. This allows one to transition from supply to demand and vice versa very smoothly, and drastically reduces training costs and has a corresponding increase in adoption. This is one of the major selling points of this application is that it is exceedingly easy to use. The following section shows one random area of functionality within Smoothie.
Lifecycle Planning (and Other Adjustments) in Demand Works Smoothie
There are several ways to manage lifecycle planning in Smoothie. The first is more of a “one-off” approach, while the second is a systematic way of applying lifecycle changes to groups of products. Both methods are explained below:
Method 1: Copy and Paste Spreadsheet Functionality in Smoothie for Lifecycle Planning
The steps for this method are:
- Place the SKUs of the forecast you want to increase or decrease in value into a group, and then copy the time series to a spreadsheet.
- The percentage decrease or increase is then applied in the external spreadsheet (Excel, for instance).
- Copy the changed values back to Smoothie’s internal spreadsheet in the application datasheet view.
An example of this is shown in the two screenshots below:
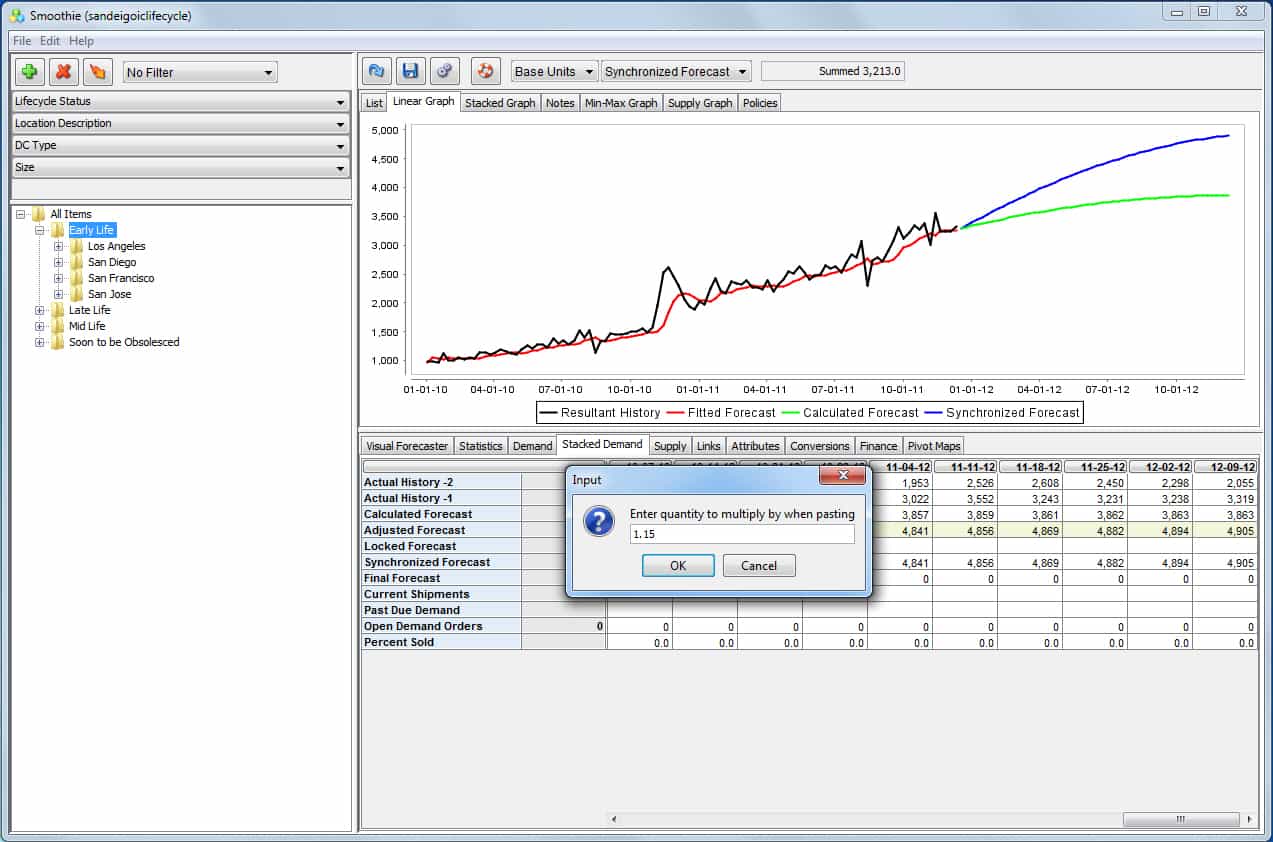
In Smoothie, values in a single field or an entire row can be adjusted and imported from a spreadsheet. Data can be copied back as modified or can be increased by a certain value with the “Paste Multiply” function. Smoothie then asks for a value by which to multiply the copied values. To increase the values by 15 percent, one would type in 1.15 (for 115 percent) in this entry box. This is just one of the options available for performing a paste to forecast measure in Smoothie.
Method 2: Setting Lifecycle as an Attribute
Smoothie’s flexible attribute-based forecasting capabilities can be used for multiple purposes. Attributes are an adjustable mechanism for any type of grouping, and lifecycle planning is just another form of grouping— you are choosing to treat a group of products differently from the rest of the product database. An attribute can be created very easily in Smoothie by merely adding a column to the import file and titling it something like “Life Cycle.” Then, populate it with the different lifecycle categories that the company wants to apply to the product. The examples I have created below could be set up as attributes:
- Early-life
- Mid-life
- Late-life
- Soon to be obsolesced
However, any number of lifecycle categories is possible. These could be assigned to each product. Once a product is grouped in this way, it can be increased or decreased in as part of the group.
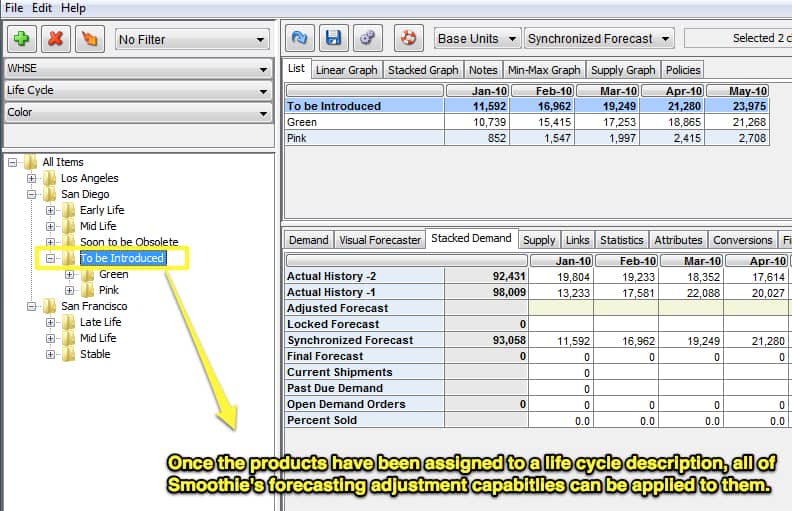
Once placed into a group or attribute, the groupings of products can be increased or decreased by moving the sliders at the bottom of the screen. This can be done interactively without affecting the final forecast. When the change to be made has been agreed upon, the forecast can be saved. The forecast will have then been adjusted.
Smoothie also provides an application that can be used as a prototype environment, which can be used to validate other demand planning applications. We use it to troubleshoot habitually problematic applications like SAP DP. Its low cost can allow it to be purchased as a second demand planning application for any number of purposes.
Smoothie comes in a desktop, server and also has cloud options. The server option is what differentiates Smoothie from the lower cost vendors in the demand planning space. I demonstrated the desktop version in these screenshots. Demand Works gets most of its sales from its server version.
Smoothie has low training costs because the application is so easy to use.
MUFI Scores
All scores out of a possible 10.
MUFI Scores
- Ma. = Maintainability
- Us. = Usability
- Fu. = Functionality
- Im. = Implementability
| App | Ma. | Us. | Ft. | Im. | Cat. |
|---|---|---|---|---|---|
| Average Score for Big ERP | 5.1 | 4.8 | 5.2 | 5.4 | Big ERP |
| Average Score for CRM | 6.2 | 6.2 | 5.1 | 5.9 | CRM |
| Average Score for Small and Medium ERP | 8.3 | 8 | 6.7 | 8.5 | Small and Medium ERP |
| Average Score for Finance | 8.8 | 8.8 | 8 | 8.8 | Finance |
| Average Score for Demand Planning | 7.6 | 7.2 | 7 | 7.1 | Demand Planning |
| Average Score for Supply Planning | 6.7 | 6.9 | 7 | 6.8 | Supply Planning |
| Average Score for Production Planning | 6.8 | 6.9 | 7 | 6.9 | Production Planning |
| Average Score for BI Heavy | 5.5 | 5.3 | 6.9 | 5.3 | BI Heavy |
| Average Score for PLM | 7 | 7.2 | 6.8 | 7.3 | PLM |
| Average Score for BI Light | 7.7 | 8.7 | 9 | 8.3 | BI Light |
| Arena Solutions Arena PLM | 10 | 10 | 10 | 10 | PLM |
| AspenTech AspenOne | 4 | 8 | 10 | 7 | Production Planning |
| Birst | 8 | 8.5 | 10 | 8 | BI Light |
| ERPNext | 10 | 10 | 7.5 | 10 | Small and Medium ERP |
| Delfoi Planner | 8 | 6 | 6.5 | 7 | Production Planning |
| Demand Works Smoothie SP | 9 | 10 | 7 | 10 | Supply Planning |
| Hamilton Grant RM | 10 | 9 | 8.5 | 9 | PLM |
| IBM Cognos | 2.7 | 3 | 1.5 | 3 | BI Heavy |
| Infor Epiphany | 7 | 8 | 6 | 5 | CRM |
| Infor Lawson | 8 | 7 | 6 | 7 | Big ERP |
| Intuit QuickBooks Enterprise Solutions | 9 | 9 | 5 | 9 | Finance |
| JDA DM | 9 | 7.5 | 8 | 8 | Demand Planning |
| Microsoft Dynamics CRM | 2 | 3 | 2 | 2 | CRM |
| NetSuite CRM | 6 | 4 | 3 | 3 | CRM |
| Netsuite OneWorld | 7 | 7 | 8 | 8 | Big ERP |
| OpenERP | 7 | 8 | 8.5 | 8 | 7 |
| Oracle BI | 4 | 4 | 3 | 6 | BI Heavy |
| Oracle CRM On Demand | 4 | 5 | 3 | 5 | CRM |
| Oracle Demantra | 5 | 3 | 3.5 | 4.5 | Demand Planning |
| Oracle JD Edwards World | 4 | 1 | 3 | 6 | Big ERP |
| Oracle RightNow | 6 | 7 | 4 | 5 | CRM |
| PlanetTogether Galaxy APS | 10 | 10 | 10 | 10 | Production Planning |
| Preactor | 8 | 7 | 3 | 7 | Production Planning |
| QlikTech QlikView | 9 | 9 | 10 | 9 | BI Light |
| Rootstock | 9 | 8 | 9 | 9 | Small and Medium ERP |
| Sage X3 | 8 | 8 | 7 | 8 | Big ERP |
| Salesforce Enterprise | 8 | 8.5 | 9 | 7.5 | CRM |
| SAP APO DP | 3 | 4 | 3 | 2 | Demand Planning |
| SAP APO PP/DS | 2 | 2 | 4 | 3 | Production Planning |
| SAP APO SNP | 3 | 4 | 8 | 4 | Supply Planning |
| SAP BI/BW | 1.5 | 2 | 4 | 2 | BI Heavy |
| SAP Business Objects | 3 | 2.5 | 7 | 3 | BI Heavy |
| SAP CRM | 4 | 3 | 6 | 4 | CRM |
| SAP ECC | 3 | 3 | 6.5 | 3 | Big ERP |
| SAP PLM | 1 | 2.5 | 2 | 3 | PLM |
| SAP SmartOps | 4 | 4 | 7 | 5.5 | Supply Planning |
| SAS BI | 6.5 | 7 | 9 | 6 | BI Heavy |
| SAS Demand Driven Forecasting | 7 | 8 | 9 | 7 | Demand Planning |
| Tableau (BI) | 9 | 10 | 10 | 10 | BI Light |
| Tableau (Forecasting) | 10 | 8 | 5 | 9 | Demand Planning |
| Teradata | 8 | 6.3 | 9.7 | 6 | BI Heavy |
| ToolsGroup SO99 (Forecasting) | 7 | 8 | 9 | 7 | Demand Planning |
| ToolsGroup SO99 (Supply) | 5 | 6 | 10 | 7 | Supply Planning |
Vendor and Application Risk
Demand Works Smoothie has one of the lowest combined vendor and application risks in the demand planning space. Smoothie’s consulting tends to be remote but for larger clients, but they also offer one site consulting.
Demand Works provides expert support and will work with consulting partners to offer training and integration. Several options can speed the implementation time of Smoothie and can provide quality forecasts. Either way, Demand Works provides some options that can allow for a very low-risk implementation.
Likelihood of Implementation Success
This accounts for both the application and the vendor-specific risk. In our formula, the total implementation risk is application + vendor + buyer risk. The buyer specific risk could increase or decrease this overall likelihood and adjust the values that you see below.
Likelihood of Application Implementation Success and Failure
Search for the application in this table using the search bar in the upper right of the table.
| Application | Prob of Implementation Success | Prob of Implementation Failure |
|---|---|---|
| Actuate | 0.77 | 0.23 |
| SAP Smartops | 0.39 | 0.61 |
| NetSuite CRM | 0.46 | 0.54 |
| Sugar CRM | 0.62 | 0.48 |
| Base CRM | 0.91 | 0.09 |
| SAP CRM | 0.35 | 0.65 |
| Salesforce Enterprise | 0.72 | 0.28 |
| QlikTech QlikView | 0.82 | 0.18 |
| Tableau (BI) | 0.98 | 0.02 |
| SAP Crystal Reports | 0.46 | 0.54 |
| Brist | 0.83 | 0.17 |
| MicroStrategy | 0.7 | 0.3 |
| SAS BI | 0.76 | 0.24 |
| Oracle BI | 0.35 | 0.65 |
| IBM Cognos | 0.23 | 0.77 |
| Infor Epiphany | 0.58 | 0.42 |
| Microsoft Dynamics CRM | 0.26 | 0.74 |
| Oracle RightNow CRM | 0.41 | 0.59 |
| Oracle CRM On Demand | 0.36 | 0.64 |
| Teradata | 0.76 | 0.24 |
| SAP Business Objects | 0.32 | 0.68 |
| SAP BI/BW | 0.25 | 0.75 |
| SAP PLM | 0.29 | 0.71 |
| Hamilton Grant RM | 0.89 | 0.11 |
| Arena Solutions | 0.96 | 0.04 |
| Delfoi Planner | 0.7 | 0.3 |
| Preactor | 0.64 | 0.36 |
| PlanetTogether Galaxy APS | 0.96 | 0.04 |
| AspenTech AspenOne | 0.55 | 0.45 |
| SAP APO PP/DS | 0.27 | 0.73 |
| Demand Works Smoothie SP | 0.93 | 0.07 |
| ToolsGroup SO99 (Supply) | 0.82 | 0.18 |
| Demand Works Smoothie | 0.96 | 0.04 |
| Tableau (Forecasting) | 0.9 | 0.1 |
| SAS Demand Driven Forecasting | 0.82 | 0.18 |
| ToolsGroup SO99 (Forecasting) | 0.86 | 0.14 |
| JDA DM | 0.57 | 0.43 |
| Oracle Demantra | 0.33 | 0.67 |
| SAP APO DP | 0.28 | 0.72 |
| FinancialForce | 0.92 | 0.08 |
| Intacct | 0.98 | 0.02 |
| Intuit QB Enterprise | 0.8 | 0.2 |
| ERPNext | 0.9 | 0.1 |
| OpenERP | 0.78 | 0.22 |
| Rootstock | 0.91 | 0.09 |
| ProcessPro | 0.93 | 0.07 |
| Microsoft Dynamics AX | 0.4 | 0.6 |
| SAP Business One | 0.49 | 0.51 |
| Sage X3 | 0.62 | 0.38 |
| Infor Lawson | 0.58 | 0.42 |
| Epicor ERP | 0.4 | 0.6 |
| Oracle JD Edwards World | 0.31 | 0.69 |
| Oracle JD Edwards EnterpriseOne | 0.36 | 0.64 |
| SAP ERP ECC/R/3 | 0.32 | 0.68 |
| NetSuite OneWorld | 0.65 | 0.35 |
Risk Definition
See this link for more on our categorizations of risk. We also offer a Buyer Specific Risk Estimation as a service for those that want a comprehensive analysis.
Finished With Your Analysis?
To go back to the Software Selection Package page for the Demand Planning software category. Or go to this link to see other analytical products for Demand Works Smoothie.
Part of the Following Software Categories
Select the following link(s) if you have subscribed to the following analytical product(s).