
Executive Summary
- This is the Brightwork Research & Analysis software rating series.
- We rate both the software and estimate the risk of implementing each application.
MUFI Rating & Risk for SAP Crystal Reports
MUFI: Maintainability, Usability, Functionality, Implement ability
Vendor: SAP (Select For Vendor Profile)
Introduction
Crystal Reports is the small market solution offered by SAP through its acquisition of Business Objects, which in turn acquired Crystal Reports in 2004. Crystal Reports began as an independent company in 1991.
Application Detail
This application is well regarded for its ability to pull from any data source, but the way the Crystal Reports has redundant data connection settings illustrates that this area of the application could be cleaned up. It merely becomes challenging to keep the various data connections straight, and this is both a quality and development productivity issue.
Even though Crystal Reports has been owned by SAP since 2007, Crystal Reports still looks and feels surprisingly modern considering the fact it has not received a minor development since its acquisition. This is true far more so than with Business Object, which is at this point is showing it age.
Within the BI community Crystal has a bit of a stodgy reputation, however, when looked at concerning other newer BI Light applications, Crystal Reports was ahead of its time. It provided relatively self-serve BI combined with the ability to easily read multiple data sources (although not to change the data sources as is explained in the fourth bullet point below).
A long-term issue with Crystal Reports is that it has some idiosyncrasies that make it for low development productivity. Some of the most commonly sighted issues are listed below:
- Manual Rework: Individual fields require too much manual intervention.
- Formatting Issues: Reports that are created differ in their formatting. This means report developers have to check formatting options between reports continually, and this is because even at this late date Crystal Reports does not have WYSIWYG report editor. Another issue is that too often when there is a reporting error, there is no error message, and this inhibits effective troubleshooting.
- Error Handling: Reports will work fine for some time and come to be relied upon by some users, and then will simple cease working. The time to get the reports back up is lengthy because the report developer themselves is not able to determine precisely what went wrong due to the limited Error handling capabilities in Crystal Reports.
- Data Source Hardcoding: Crystal Reports is consistently marked poorly for its confusing data connection settings, in addition to the fact that once set, Crystal Reports has a strong tendency to maintain the initial data source setting, even after it has been changed.
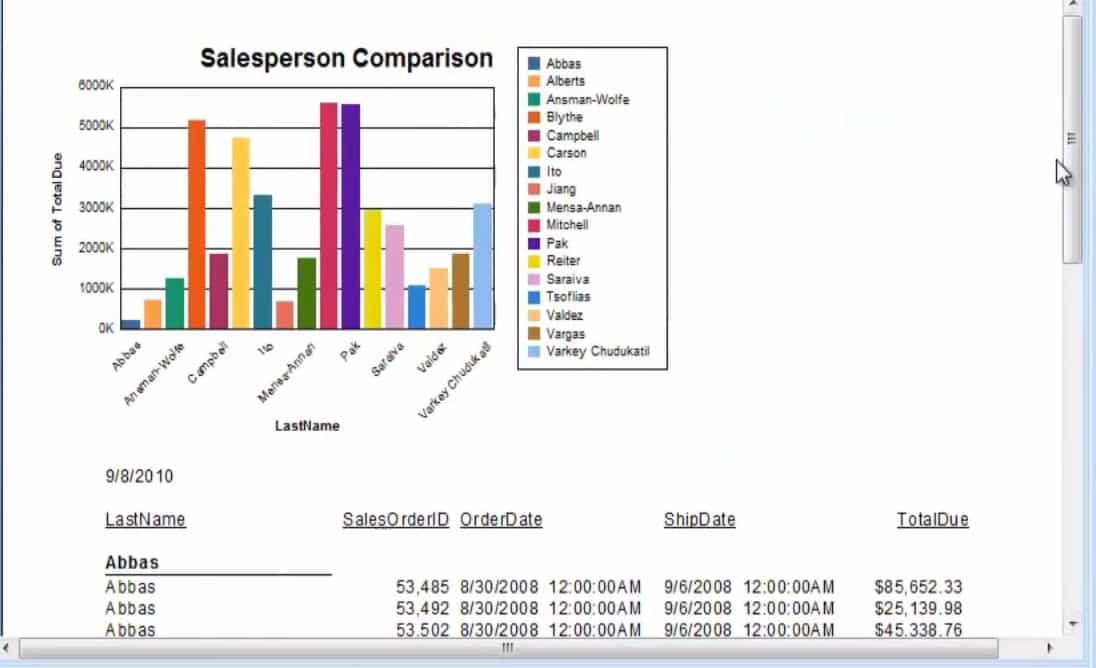
Reports like this are dated compared to what can be had from the younger and nimbler BI software vendors. A promotional video for Crystal Reports states that one can create visually stunning reports using Crystal Reports, and they use this report as evidence of this fact. Except, but modern standards this is not stunning. If SAP would like to see a remarkable report, see the MicroStrategy report below.
Crystal Reports are often justified by being a low-cost option. Per-user licenses are the lowest of any of the applications in the BI space. However, due to the low level of productivity of Crystal Reports, this low purchase price should not tantalize or confuse buyers, yet sometimes this occurs. In fact, the overall enterprise software market is heavily focused on the initial purchase price, which ordinarily is a very bad way to make purchasing decisions as the software price averages 10% of the overall TCO for a typical enterprise application.
However, it is a particularly poor approach when analyzing Crystal Reports as we the application’s software cost tends to be roughly 1 to 2% of the TCO — the only other applications which approach this are open source. In fact, the cost differential is so high with Crystal Reports that SAP may as wall give the software away for free. There are apparently better applications on the market that do what Crystal does, but not at the initial purchase price of Crystal Reports. However, even with its low purchase price, Crystal Reports is still not the TCO cost leader among BI Light applications. Because of the issues that were listed previously, Crystal Reports does not scale well – that is as it grows it requires consistent increments of input.
One upside is that it is that because the application has been around for so long that it is easy to find Crystal Reports resources, independent consultants and so on. The other applications in the BI Light category are proliferating, and resource availability is an issue. Regarding available documentation, one argument proposed by Crystal Reports proponents is that the application has a great deal of documentation written for it, including many books. That is true. However, in the BI Light category, all of the options available have quite a bit of material written for them.
A final consideration should be the buyer’s time and investment into Crystal Reports – which is not likely to bring the ROI of either QlikView or Tableau. These other applications in this category are not only superior currently, but we predict will develop to a much greater degree than Crystal Reports.
MUFI Scores
All scores out of a possible 10.
MUFI Scores
- Ma. = Maintainability
- Us. = Usability
- Fu. = Functionality
- Im. = Implementability
| App | Ma. | Us. | Ft. | Im. | Cat. |
|---|---|---|---|---|---|
| Average Score for Big ERP | 5.1 | 4.8 | 5.2 | 5.4 | Big ERP |
| Average Score for CRM | 6.2 | 6.2 | 5.1 | 5.9 | CRM |
| Average Score for Small and Medium ERP | 8.3 | 8 | 6.7 | 8.5 | Small and Medium ERP |
| Average Score for Finance | 8.8 | 8.8 | 8 | 8.8 | Finance |
| Average Score for Demand Planning | 7.6 | 7.2 | 7 | 7.1 | Demand Planning |
| Average Score for Supply Planning | 6.7 | 6.9 | 7 | 6.8 | Supply Planning |
| Average Score for Production Planning | 6.8 | 6.9 | 7 | 6.9 | Production Planning |
| Average Score for BI Heavy | 5.5 | 5.3 | 6.9 | 5.3 | BI Heavy |
| Average Score for PLM | 7 | 7.2 | 6.8 | 7.3 | PLM |
| Average Score for BI Light | 7.7 | 8.7 | 9 | 8.3 | BI Light |
| Arena Solutions Arena PLM | 10 | 10 | 10 | 10 | PLM |
| AspenTech AspenOne | 4 | 8 | 10 | 7 | Production Planning |
| Birst | 8 | 8.5 | 10 | 8 | BI Light |
| ERPNext | 10 | 10 | 7.5 | 10 | Small and Medium ERP |
| Delfoi Planner | 8 | 6 | 6.5 | 7 | Production Planning |
| Demand Works Smoothie SP | 9 | 10 | 7 | 10 | Supply Planning |
| Hamilton Grant RM | 10 | 9 | 8.5 | 9 | PLM |
| IBM Cognos | 2.7 | 3 | 1.5 | 3 | BI Heavy |
| Infor Epiphany | 7 | 8 | 6 | 5 | CRM |
| Infor Lawson | 8 | 7 | 6 | 7 | Big ERP |
| Intuit QuickBooks Enterprise Solutions | 9 | 9 | 5 | 9 | Finance |
| JDA DM | 9 | 7.5 | 8 | 8 | Demand Planning |
| Microsoft Dynamics CRM | 2 | 3 | 2 | 2 | CRM |
| NetSuite CRM | 6 | 4 | 3 | 3 | CRM |
| Netsuite OneWorld | 7 | 7 | 8 | 8 | Big ERP |
| OpenERP | 7 | 8 | 8.5 | 8 | 7 |
| Oracle BI | 4 | 4 | 3 | 6 | BI Heavy |
| Oracle CRM On Demand | 4 | 5 | 3 | 5 | CRM |
| Oracle Demantra | 5 | 3 | 3.5 | 4.5 | Demand Planning |
| Oracle JD Edwards World | 4 | 1 | 3 | 6 | Big ERP |
| Oracle RightNow | 6 | 7 | 4 | 5 | CRM |
| PlanetTogether Galaxy APS | 10 | 10 | 10 | 10 | Production Planning |
| Preactor | 8 | 7 | 3 | 7 | Production Planning |
| QlikTech QlikView | 9 | 9 | 10 | 9 | BI Light |
| Rootstock | 9 | 8 | 9 | 9 | Small and Medium ERP |
| Sage X3 | 8 | 8 | 7 | 8 | Big ERP |
| Salesforce Enterprise | 8 | 8.5 | 9 | 7.5 | CRM |
| SAP APO DP | 3 | 4 | 3 | 2 | Demand Planning |
| SAP APO PP/DS | 2 | 2 | 4 | 3 | Production Planning |
| SAP APO SNP | 3 | 4 | 8 | 4 | Supply Planning |
| SAP BI/BW | 1.5 | 2 | 4 | 2 | BI Heavy |
| SAP Business Objects | 3 | 2.5 | 7 | 3 | BI Heavy |
| SAP CRM | 4 | 3 | 6 | 4 | CRM |
| SAP ECC | 3 | 3 | 6.5 | 3 | Big ERP |
| SAP PLM | 1 | 2.5 | 2 | 3 | PLM |
| SAP SmartOps | 4 | 4 | 7 | 5.5 | Supply Planning |
| SAS BI | 6.5 | 7 | 9 | 6 | BI Heavy |
| SAS Demand Driven Forecasting | 7 | 8 | 9 | 7 | Demand Planning |
| Tableau (BI) | 9 | 10 | 10 | 10 | BI Light |
| Tableau (Forecasting) | 10 | 8 | 5 | 9 | Demand Planning |
| Teradata | 8 | 6.3 | 9.7 | 6 | BI Heavy |
| ToolsGroup SO99 (Forecasting) | 7 | 8 | 9 | 7 | Demand Planning |
| ToolsGroup SO99 (Supply) | 5 | 6 | 10 | 7 | Supply Planning |
Vendor and Application Risk
Buyers of Crystal Reports have a low risk concerning access to good value consultants (although not through SAP), but the buyer pays the price regarding implement ability and maintainability. This is why even at a meager price; Crystal Reports is not the low-cost leader for BI Light applications.
Likelihood of Implementation Success
This accounts for both the application and vendor-specific risk. In our formula, the total implementation risk is application + vendor + buyer risk. The buyer specific risk could increase or decrease this overall likelihood and adjust the values that you see below.
Likelihood of Application Implementation Success and Failure
Search for the application in this table using the search bar in the upper right of the table.
| Application | Prob of Implementation Success | Prob of Implementation Failure |
|---|---|---|
| Actuate | 0.77 | 0.23 |
| SAP Smartops | 0.39 | 0.61 |
| NetSuite CRM | 0.46 | 0.54 |
| Sugar CRM | 0.62 | 0.48 |
| Base CRM | 0.91 | 0.09 |
| SAP CRM | 0.35 | 0.65 |
| Salesforce Enterprise | 0.72 | 0.28 |
| QlikTech QlikView | 0.82 | 0.18 |
| Tableau (BI) | 0.98 | 0.02 |
| SAP Crystal Reports | 0.46 | 0.54 |
| Brist | 0.83 | 0.17 |
| MicroStrategy | 0.7 | 0.3 |
| SAS BI | 0.76 | 0.24 |
| Oracle BI | 0.35 | 0.65 |
| IBM Cognos | 0.23 | 0.77 |
| Infor Epiphany | 0.58 | 0.42 |
| Microsoft Dynamics CRM | 0.26 | 0.74 |
| Oracle RightNow CRM | 0.41 | 0.59 |
| Oracle CRM On Demand | 0.36 | 0.64 |
| Teradata | 0.76 | 0.24 |
| SAP Business Objects | 0.32 | 0.68 |
| SAP BI/BW | 0.25 | 0.75 |
| SAP PLM | 0.29 | 0.71 |
| Hamilton Grant RM | 0.89 | 0.11 |
| Arena Solutions | 0.96 | 0.04 |
| Delfoi Planner | 0.7 | 0.3 |
| Preactor | 0.64 | 0.36 |
| PlanetTogether Galaxy APS | 0.96 | 0.04 |
| AspenTech AspenOne | 0.55 | 0.45 |
| SAP APO PP/DS | 0.27 | 0.73 |
| Demand Works Smoothie SP | 0.93 | 0.07 |
| ToolsGroup SO99 (Supply) | 0.82 | 0.18 |
| Demand Works Smoothie | 0.96 | 0.04 |
| Tableau (Forecasting) | 0.9 | 0.1 |
| SAS Demand Driven Forecasting | 0.82 | 0.18 |
| ToolsGroup SO99 (Forecasting) | 0.86 | 0.14 |
| JDA DM | 0.57 | 0.43 |
| Oracle Demantra | 0.33 | 0.67 |
| SAP APO DP | 0.28 | 0.72 |
| FinancialForce | 0.92 | 0.08 |
| Intacct | 0.98 | 0.02 |
| Intuit QB Enterprise | 0.8 | 0.2 |
| ERPNext | 0.9 | 0.1 |
| OpenERP | 0.78 | 0.22 |
| Rootstock | 0.91 | 0.09 |
| ProcessPro | 0.93 | 0.07 |
| Microsoft Dynamics AX | 0.4 | 0.6 |
| SAP Business One | 0.49 | 0.51 |
| Sage X3 | 0.62 | 0.38 |
| Infor Lawson | 0.58 | 0.42 |
| Epicor ERP | 0.4 | 0.6 |
| Oracle JD Edwards World | 0.31 | 0.69 |
| Oracle JD Edwards EnterpriseOne | 0.36 | 0.64 |
| SAP ERP ECC/R/3 | 0.32 | 0.68 |
| NetSuite OneWorld | 0.65 | 0.35 |
Risk Definition
See this link for more on our categorizations of risk. We also offer a Buyer Specific Risk Estimation as a service for those that want a comprehensive analysis.
Risk Management Approach
The main risk with respect to Crystal Reports is the relatively low productivity of the application. This generally must be mitigated by staffing the project and the maintenance of a Crystal Reports project towards the heavier side for a BI Light implementation. We address this adjustment in our Project Planning Package for SAP Crystal Reports.
Finished With Your Analysis?
To go back to the Software Selection Package page for the BI Light software category. Or goto this link to see other analytical products for SAP Crystal Reports.