
Reviewing Investing Backtesting Software
Executive Summary
- Backtesting software allows one to review and test how a strategy would have performed.
Introduction
Backtesting is testing a strategy against historical data. The concept is simple, however, in order to perform backtesting, it is necessary to use software. In this article, I will go over a few different applications. This article is written from the perspective of a person who has performed analysis, but who is not experienced with backtesting applications. So it is not written from the perspective of a person who has all the answers, but rather from the perspective of a person who is learning.
The Issues of the Topic of Backtesting
I learned quickly that explanations around performing backtesting is generally poor in quality. This is also given the fact that I have been performing backtesting of forecast accuracy for over 11 years (not continuously, but on different projects). One would think that it would be easier to understand the explanations of financial backtesting.
Places to Find Sources
The website Quantipedia had a comprehensive listing of options. The only problem was that the list is so extensive, it takes a very long time to review the options. Quantipedia is not only a reference but also offers a backtesting product. I will review Quantipedia’s offering at the end of this article. The reason that Quantipedia offers this index is that they sell access to their ideas, not the data to perform the backtesting analysis.
TradingView
One of the applications is called TradingView. I have several ETF funds charted in this application.
NASDAQ
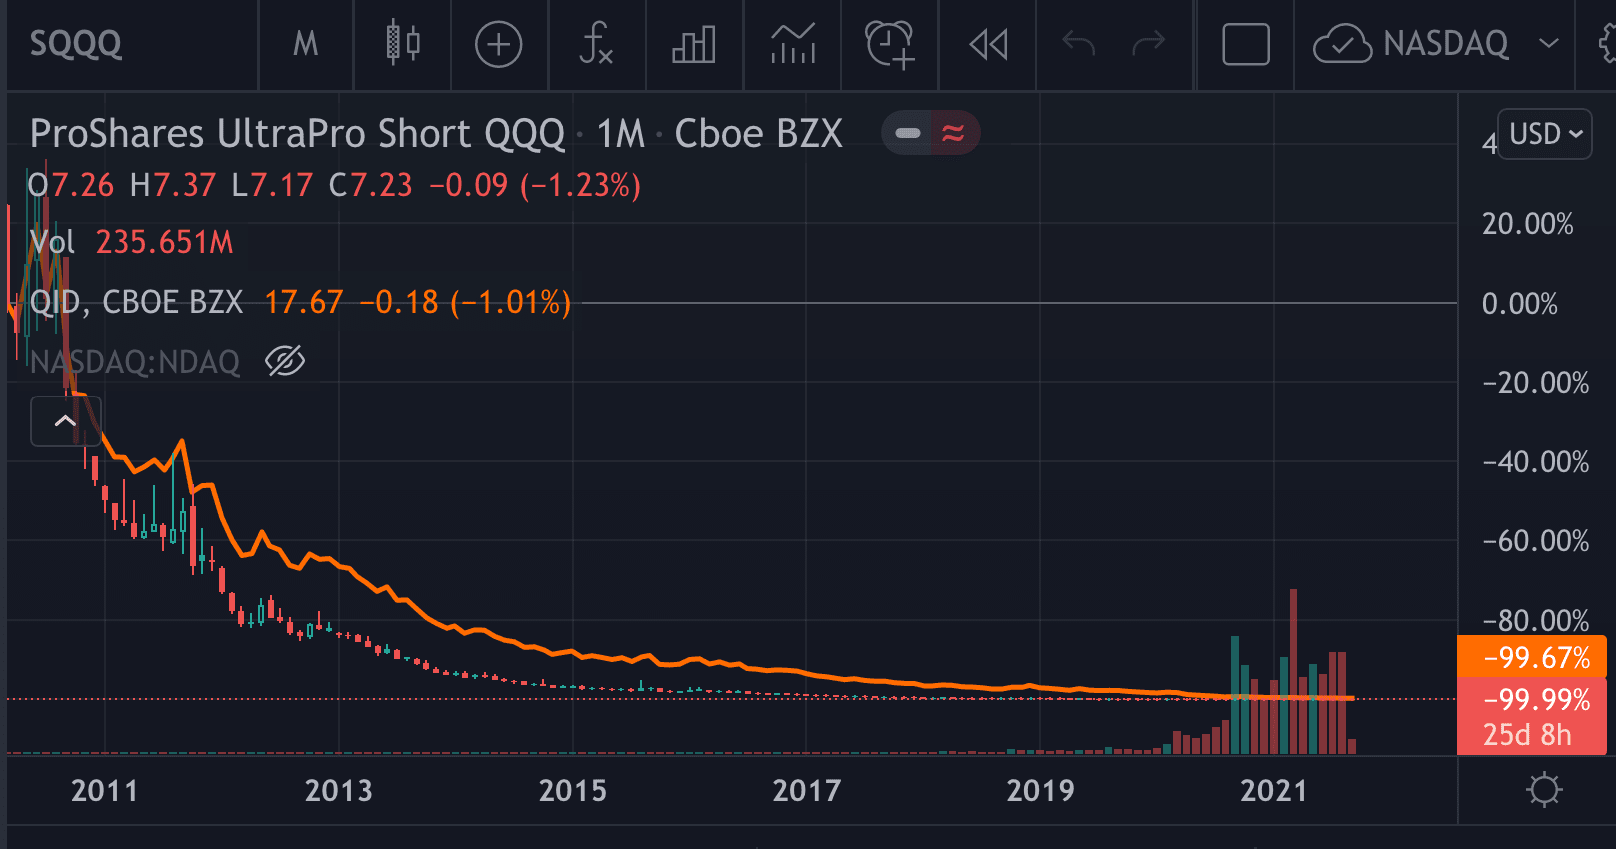
This is the NASDAQ chart showing shorts. I cannot tell exactly what the lowest bars are.
Switch Screens
You can switch saved screens by going to the upper right hand corner where the different views that you have created are saved.

One can create as many of these views or screens as one wants.
S&P 500
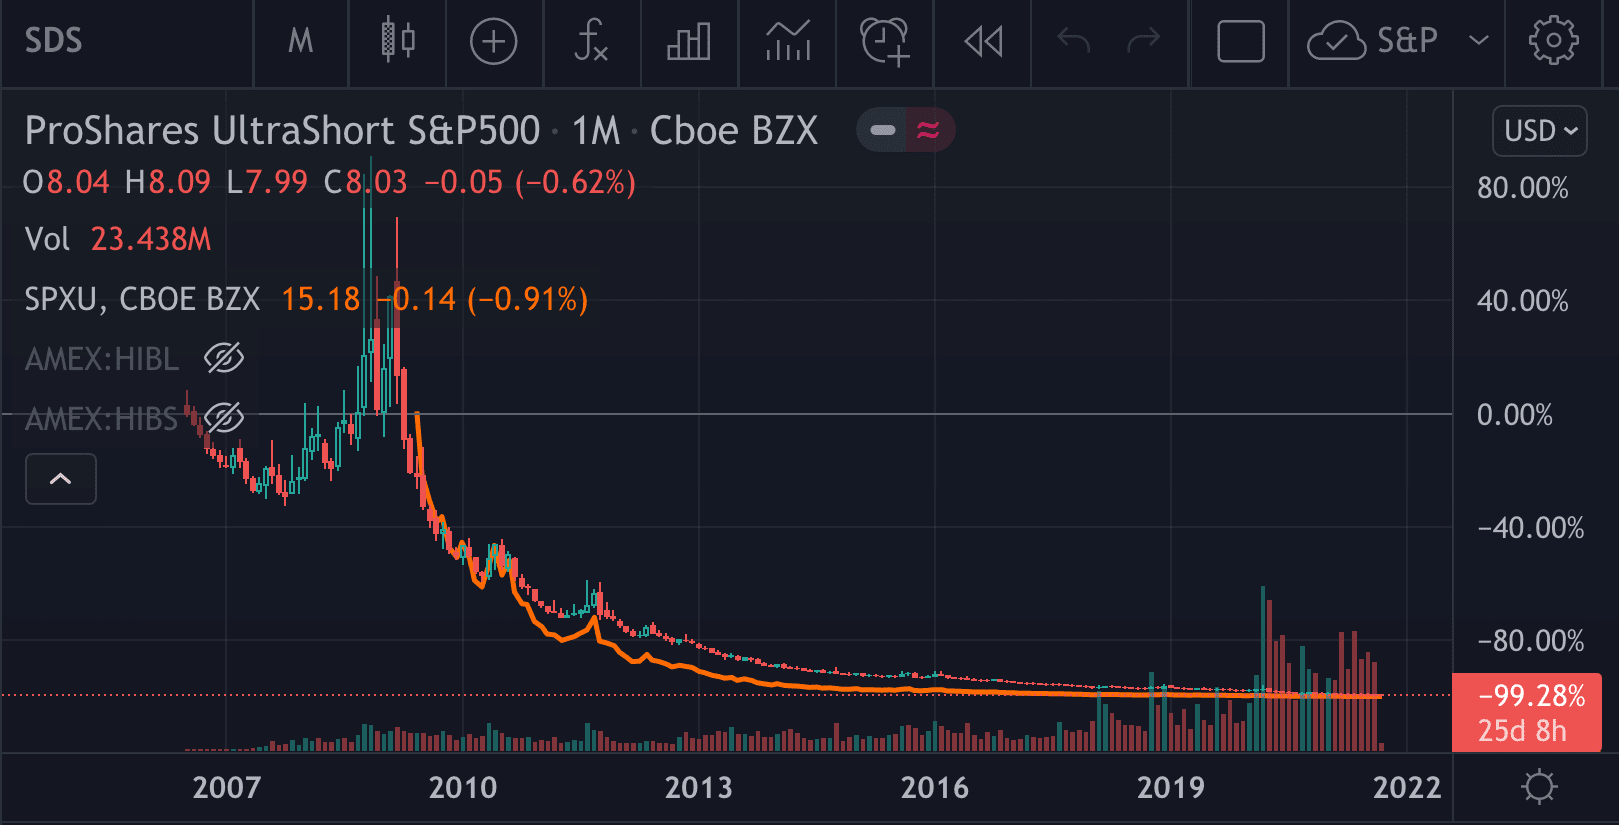
These are the inverse ETF funds for the S&P 500.
Real Estate

This is the Real Estate inverse ETFs. One thing that is apparent is that the decline in the real estate EFTs is much less or more gradual than the decline in the NASDAQ or S&P inverse ETFs. This shows us that while the real estate market is very overpriced, or at least historically high, it is less exaggerated than the stock indexes.
Tesla

This is an ETF on Tesla. This chart is difficult to read.
Backtesting With Replay Mode
One is supposed to be able to perform backtesting by engaging replay mode.

I did not really get this functionality. It appears to show the change over time in “real time” but I have no interest in backtesting in this way. I just want to know the gain and loss. But I can see this by just looking at the chart.
Observations
This is an effective charting software. It has all the data for all the symbols available and that makes it very convenient to add symbols. I like to add multiple similar ETFs into a single view, which allows me to perform comparisons and to organize the ETFs.
There is all manner of advanced functions I have not scratched the surface of, such as alerts, etc.. The US is very slick and the functions are made as easy as possible to use.
Cons
The problem is that aside from showing me the pattern I don’t really see how I can backtest by using the software.
Metastock
I found this software a bit too complex for my needs.
Wealth Lab
I found Wealth Lab to also look too complex and have too much of a learning curve.
Polygon
Polygon is a service that allows users to connect to data through an API.
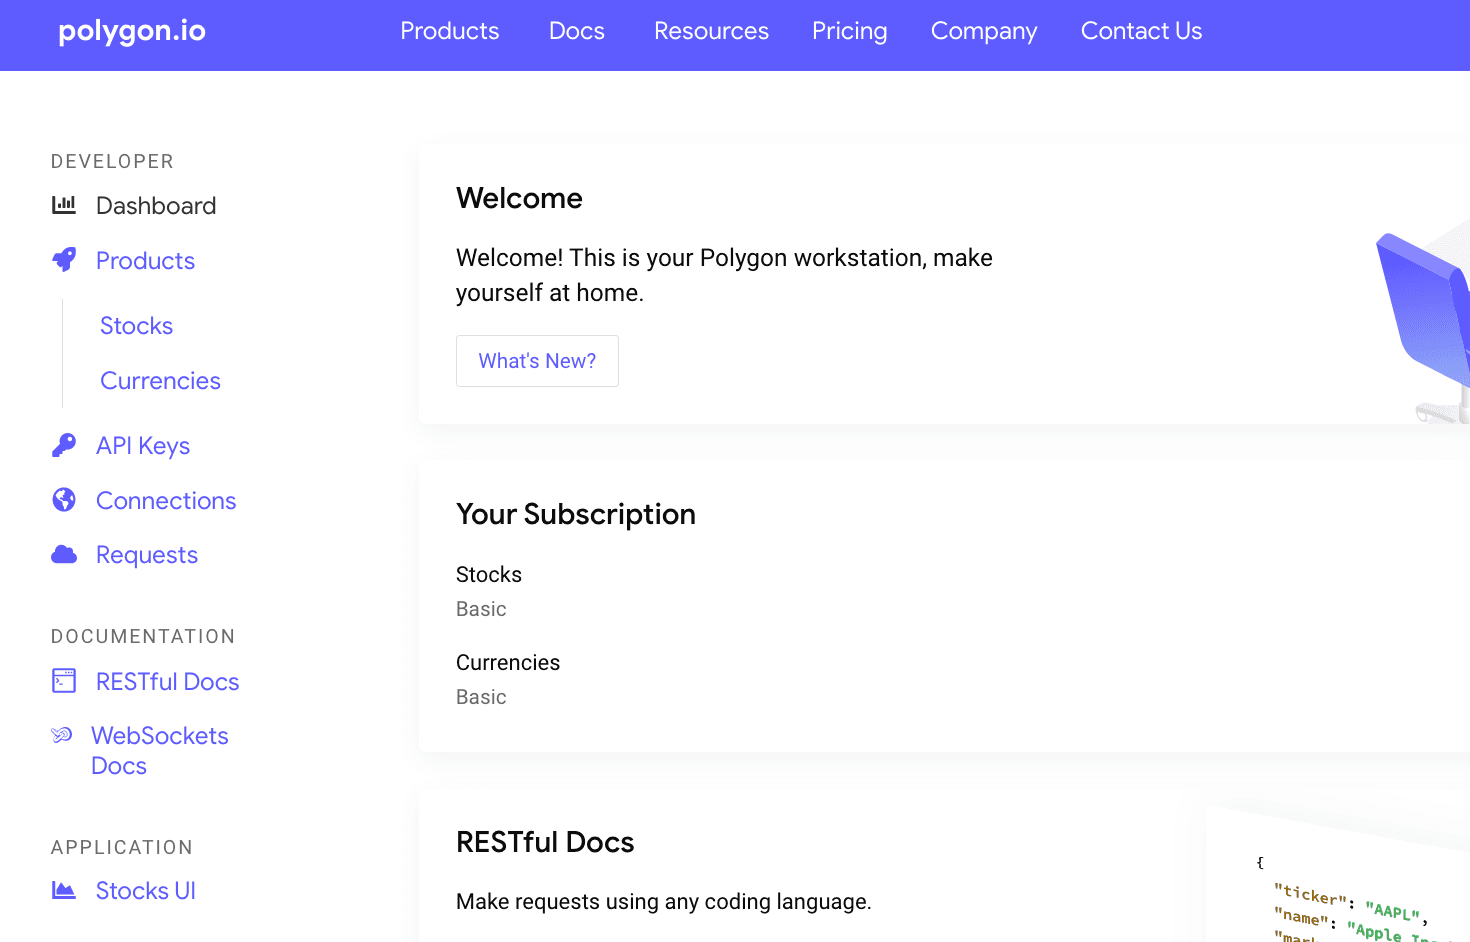
This is one of the lowest-priced options, but requires technical skill to figure out.
Quantipedia
Quantipedia describes itself as follows.
We are a database of ideas for quantitative trading strategies. We sift through financial academic research and search for new interesting articles and papers. Once we find an attractive strategy, we add it into our database, extract description, fundamental reason, risk and return characteristics from the source research paper and describe trading rules in a plain language.
Users can then screen through our database of manually curated ideas for trading strategies. We do not offer trading signals. Performance and risk characteristics for all strategies are extracted out of source financial research papers. The subset of our strategies have out-of-sample backtest (with a source code+equity curve chart+statistics) written in QuantConnect – check Screener – Quantipedia
Conclusion
This area is extremely confusing. It takes a very large amount of time to review and test the different options.
References
*https://quantpedia.com/pricing/