
Introduction
- We are known for one of the largest databases of articles and calculators on enterprise software.
- We now offer the same type of documentation that you see on our site, but for internal projects at companies.
About Our SAP Documentation Service
- Are you happy with you current SAP documentation?
- Here is one of the most important questions, do your users actually rely upon the documentation you have to augment their knowledge of the SAP systems you have installed.
- Is the current documentation you have consistent with how the system is currently used, or is it out of date with those practices?
Don’t be surprised if the answers to all of the questions is “No.”
SAP documentation is a problem at the majority of clients that we see. This is true whether we are brought in to work on documentation, or to work on troubleshooting SAP systems — that is to work on things unrelated to creating new SAP documentation.
Poor quality SAP documentation leads to all types of problems — that all roll up to one thing — a lower ability to gain value from SAP investments.
Reasons SAP Documentation Problems
The following are reasons are what we see:
- Documentation Capabilities?: Many consulting companies may provide the application expertise, but the documentation quality is sorely lacking.
- ESL Resources?: A majority of the implementation consultants at the larger consulting companies are (ESL) or English as a second language resource. This greatly reduces the quality of documentation created.
- Incentives of Consulting Companies?: A number of consulting companies and individual resources simply do not have the incentive to provide complete documentation. Complete documentation allows the client to “ride solo” and will often reduce the amount of time that the consultants spend on the project.
- Priorities?: As you know when timelines get tight towards the go-live, documentation is one of the first things to get cut down. However, projects can be very effectively documented post go-live. In the short term cutting the effort for documentation helps meet the deadline, but longer term it reduces the uptake of the system and means the systems will be used at a lower level.
What We Do
We produce excellent SAP documentation. Whether it is a new implementation or an existing implementation, it makes much more sense, and is a far better value to get documentation from resource that are both SAP experts and professional writers.

See a Sample of Our Documentation?
The sample below is a sanitized version of documentation prepared for a client. This is a lengthy document, so feel free to just scan the document as you see fit, and when you have read your fill just scroll to the very bottom.
_______________________________________________________
TITLE: Demand Planning Changes, Roles and Workflow in SAP DP
- Author: Shaun Snapp
- Date: November 5 2014
- Document Intent: To explain DP functionality will be used in the future as well as the roles and user authorization changes due to the Demand Planning Improvement Project.
- Version: Version 2
- Location: This document is considered a companion document to the Forecast Profile Master List. Therefore these two documents are to be located together in the shared drive and eventually in SharePoint.
This is the second version of this document, however, more people will read this second version than read the first. Therefore, there are expected to be more opportunities to improve the document, adding more explanations or even new sections. Please provide feedback that can improve how useful the document is and will increase the likelihood that it can be used as a reference document for demand planning into the future.
Secondly, there are more changes that are planned to be rolled out due to the Demand Planning Improvement Project; therefore there will be more versions of this document.
GLOSSARY
- Forecast Profile: This is the object in SAP DP that is controls the forecast model. It is assigned to the forecasted item. The Forecast Profile is a combination of a specific forecast model (e.g. trend, exponential smoothing, Holt, etc..) with a series of control parameters which control items such as how many previous periods are fed to the forecasting model, statistical forecast parameters, and other items which influence the behavior of the forecast model.
- The Forecast Profile Master List: This is the list of all assignments between the Forecast Profiles and the products. This list can be filtered in order to show all of the products that are assigned to a particular Forecast Profile.
- MAPE: Mean Absolute Percentage Error: Probably the most common an the easiest to understand measurement of forecast error. MAPE takes the absolute error between the forecast and the actual and divides this result by the actual.
- Selection Profile: A filtering device in DP used to show various combinations of characteristics in the Key Figures of the Planning Books. They are also used extensively in running batch jobs by allowing a job to point to a specific Selection Profile.
TABLE OF CONTENTS
TITLE: DPI Changes, Roles and Workflow in SAP DP…………………………… 1
GLOSSARY……………………………………………………………………………………………………………………….. 2
TABLE OF CONTENTS…………………………………………………………………………………………………………… 3
CHAPTER 1: INTRODUCTION AND BACKGROUND……………………………………………………………………… 5
Assigning Forecast Profiles to Products………………………………………………………………………………. 5
Creating New Forecast Profiles………………………………………………………………………………………….. 6
The Forecast Profile Naming Convention………………………………………………………………………………. 6
History Correction Guidelines……………………………………………………………………………………………. 6
The Two Step Process of Historical Adjustment………………………………………………………………….. 7
The Flexibility of Historical Adjustment…………………………………………………………………………… 8
The Univariate View………………………………………………………………………………………………………….. 8
CHAPTER 2: The Current DPI Forecasting Profiles……………………………………………………………… 9
Examples and Explanation of Each Forecast Profile…………………………………………………………………. 9
DPI Trend Drop (Product 198)………………………………………………………………………………… 10
DPI Conversion Model (Product 187)……………………………………………………………………….. 10
DPI Copy History (Product 156)………………………………………………………………………………. 11
DPI Crostons’ (Product 123)…………………………………………………………………………………… 12
DPI High Seasonal Less Recent (Product 119)…………………………………………………………….. 12
DPI High Seasonal Trend Dampening (Product 108)……………………………………………………. 13
DPI Level Model (Product 102)……………………………………………………………………………….. 14
DPI Level Seasonal Model (Product 109)…………………………………………………………………… 15
DPI Level Trend Model (Product 103)……………………………………………………………………….. 15
DPI Level Trend Seasonal Model (Product 105)…………………………………………………………… 16
DPI Linear Regression Model (Product 102)………………………………………………………………. 17
DPI Moving Average Model (Product 102)………………………………………………………………… 18
DPI Seasonal Less Recent Model (Product 100)…………………………………………………………… 19
DPI Recent 6 Months History Model (Product 101)……………………………………………………… 19
DPI Recent 12 Months Model (Product 102)………………………………………………………………. 20
The Correspondence Between the Forecast Profiles and the Selection Profiles……………………………… 20
Understanding the Settings in the Forecast Profile………………………………………………………………… 21
Forecast Profile Parameters…………………………………………………………………………………………….. 23
CHAPTER 3: Using the Univariate View……………………………………………………………………………. 25
Creating Forecast Error/MAPE Alerts………………………………………………………………………………… 25
Changing Forecast Profile Parameters……………………………………………………………………………….. 26
Forecast Parameter Default Values………………………………………………………………………………. 26
Outlier Removal……………………………………………………………………………………………………………. 27
Changing Forecasting Parameters and Creating New Forecast Profiles………………………………………. 29
Creating a New Forecast Profile by Copying an Old Forecast Profile within the Forecast Profile Transaction 30
Creating a New Forecast Profile with the Compare Version Functionality…………………………….. 30
Simulating Forecast Changes from the Univariate View…………………………………… 33
Using Best Fit Forecasting Interactively in the Univariate View…………………………………………………… 35
Forecast Profile Reassignment in the Univariate View……………………………………… 37
CHAPTER 4: Decentralization of Some IT Demand Planning Batch Jobs……………………………. 39
CONCLUSION………………………………………………………………………………………………………………….. 41
REFERENCES……………………………………………………………………………………………………………………. 42
APPENDIX A: Forecast Error in the Univariate View………………………………………………………… 43
APPENDIX B: Re-initialization…………………………………………………………………………………………. 45
APPENDIX C: Forecast Parameter Ranges……………………………………………………………………….. 46
CHAPTER 1: INTRODUCTION AND BACKGROUND
Significant changes are being made to how the planners work as part of the Demand Planning Improvement Project (DPI). This includes accessing new functionality within DP, and new ways of working for XYZ COMPANY Demand Planning. The DPI project determined that there were a number of areas of DP which demand planning was not leveraged that should help improve forecast accuracy. This document explains these changes as well as the configuration adjustments, associated roles and user authorization changes that will be required. This chapter will provide a quick overview of a number of topics that will be fleshed out in more detail in the following chapters. Don’t be concerned that there is no enough detail in each topic area, as this is just the introductory chapter.
Assigning Forecast Profiles to Products
Many of the Forecast Profiles prior to the DPI project were both not the best fit for the products that XYZ COMPANY forecasts, and the assignments were out of date with both changes to existing products, and to new products as well. These Forecast Profiles had been developed a number of years ago, and secondly XYZ COMPANY has quite significantly grown its product database since that time.
Because of this, a comprehensive forecast model analysis was undertaken and new Forecast Profiles were created during the DPI project. The DPI forecast study performed the following analyses:
- Best-Fit Procedure: A best fit forecasting procedure to determine the match between the existing products and the Forecast Profiles.
- Comparative Forecast Accuracy: A comparison of forecast accuracy produced by the previous DP statistical Forecast Profiles, the best fit assigned forecast models, and the final forecast (that is incorporating manual adjustments from planners, consensus input, etc…)
The DPI forecasting study found that creating more Forecast Profiles, and eliminating some of the Forecasting Profiles that were currently being used could improve forecast accuracy. This was done and all the necessary settings were changed in DP in order to apply these new Forecast Profiles to the appropriate products. In the next section we will review these Forecast Profiles and when they should be applied. Chapter 2: The Current DPI Forecasting Profiles will cover how Forecast Profiles will be assigned to products.
Creating New Forecast Profiles
- Transaction: /SAPAPO/MC96B/
- Applies To: SMEs, Sr Manager of Demand Planning
It is recognized that more Forecast Profiles, as well as improvements to existing Forecast Profiles will be necessary in the future. In the current design, both SMEs and the Sr. Manager of Demand Planning will have the ability to create new Forecast Profiles. How to this is explained in Chapter 2: The Current DPI Forecasting Profiles.
The Forecast Profile Naming Convention
All Forecast Profiles that came out of DPI are named for what they actually do statistically – which is different from the previous iteration of Forecast Profiles with the prefix XYZ. This was done in order to make the Forecast Profiles and the identically named Selection Profiles easy to understand, and self-describing. Along with this document, it should be clear to the demand planners what the Forecast Profiles are doing, and in what circumstances they apply.
All Forecast Profiles that have been part of the Demand Planning Improvement project have the prefix “DPI,” so they can be easily identified. It is recommended to name new Forecast Profiles with this naming convention so that the Forecast Profiles can be easily found in the Planning Books. New Forecast Profiles that are not yet tested can be named with the prefix “Test” or some other prefix that is not DPI. DPI should only be applied to Forecast Profiles that are tested and ready for the application to products. New DPI Forecast Profiles should also be added to this document.
History Correction Guidelines
Forecasting is generally not performed upon exactly what happened in the past. This is because companies are constantly in flux with regards to their products, and therefore there are adjustments that are necessary in order to account for changes in the business. For instance, a product that is sourced out of one location may not be sourced out of the same location going forward. In this case the company will want to move the demand history to a new location, rather than produce a forecast out of a location where the product will no longer be sourced. One of the best-known ways to do this is with an adjustment to history. This type of functionality is built into many forecasting applications.
The following reasons have been identified as reasons for performing historical adjustment at XYZ COMPANY.
- Excess Retail Inventory
- Allocation
- Production Issues
- New Products
A specialized Planning Book already exists in DP, which can allow a planner to make these adjustments, and this is called the Historical Adjustment Planning Book. A screen shot of this planning book is shown below.
Deleted Screen Shot
This is a very simply planning book in that it only contains 4 Key Figures. This is a special purpose-planning book that is only used to adjust or correct the shipment history. Here two adjustments have been made that increase the Corrected Shipment History by 100 and 150 units.
The Two Step Process of Historical Adjustment
Adjusting history is often a two-step process. It can mean removing the demand history from one location – which is one historical adjustment and then relocating the demand history to a new location, which is the second historical adjustment. Notice in all of this movement that the actual demand history does not change, that is the official record of demand history stays the same, but a separate Key Figure allows for demand history to be adjusted, and the forecast is based upon the adjusted demand history, not the actual demand history. Having these two separate and constant Key Figures is the trick to being able to move demand history, without becoming confused as to what actually happened in the past.
The Flexibility of Historical Adjustment
Historical adjustment can be performed at any level in the hierarchy. Its most common usage at XYZ COMPANY may be to move demand between locations. This would allow for XYZ COMPANY to move demand around the supply network as changes are made to sourcing. If the change is permanent, the change can be made one time. However, if the change is temporary, the demand must be moved back again once the sourcing change is reversed. However, this would be part of a comprehensive change at XYZ COMPANY, as the current approach is to us an external Ship-To mapping table that allows XYZ COMPANY to accomplish the same goal, although could argue at higher cost and effort. The external Ship-To mapping table is a customized process and system customization, the historical adjustment functionality using the Corrected History Planning Book is standard DP functionality.
The Univariate View
One of the major changes to be rolled out to XYZ COMPANY Demand Planning is access and training on the Univariate View. A very large amount of the functionality that is available to the user/planner in DP is contained within the Univariate view. This allows the planner to become more knowledge-able in the products they are forecasting, to perform comparisons between various forecast simulations, apply Phase-In and Phase-Out profiles for lifecycle planning, to adjust Forecast Profiles, among a number of other functions. This is explained in detail in Chapter 3: Using the Univariate View.
CHAPTER 2: The Current DPI Forecasting Profiles
Now that we have discussed the fact that new Forecast Profiles were created as a result of the DPI forecasting study, lets get into detail as to what the Forecast Profiles are. The current Forecast Profiles are the following:
- DPI Trend Drop
- DPI Conversion Model
- DPI Copy History Model
- DPI Crostons’ Model
- DPI High Seasonal Less Recent
- DPI High Seasonal Trend Dampening
- DPI Level Model
- DPI Level Seasonal Model
- DPI Level Trend Model
- DPI Level Trend Seasonal Model
- DPI Linear Regression Model
- DPI Moving Average Model
- DPI Seasonal Less Recent Model
- DPI Recent 6 Months History Model
- DPI Recent 12 Months History Model
- DPI Zero Forecast
Examples and Explanation of Each Forecast Profile
Examples of each Forecast Profile, along with the product that they are currently assigned to as well as scenarios where the Forecast Profile would apply are listed for each Forecast Profile below.
DPI Trend Drop (Product 122)
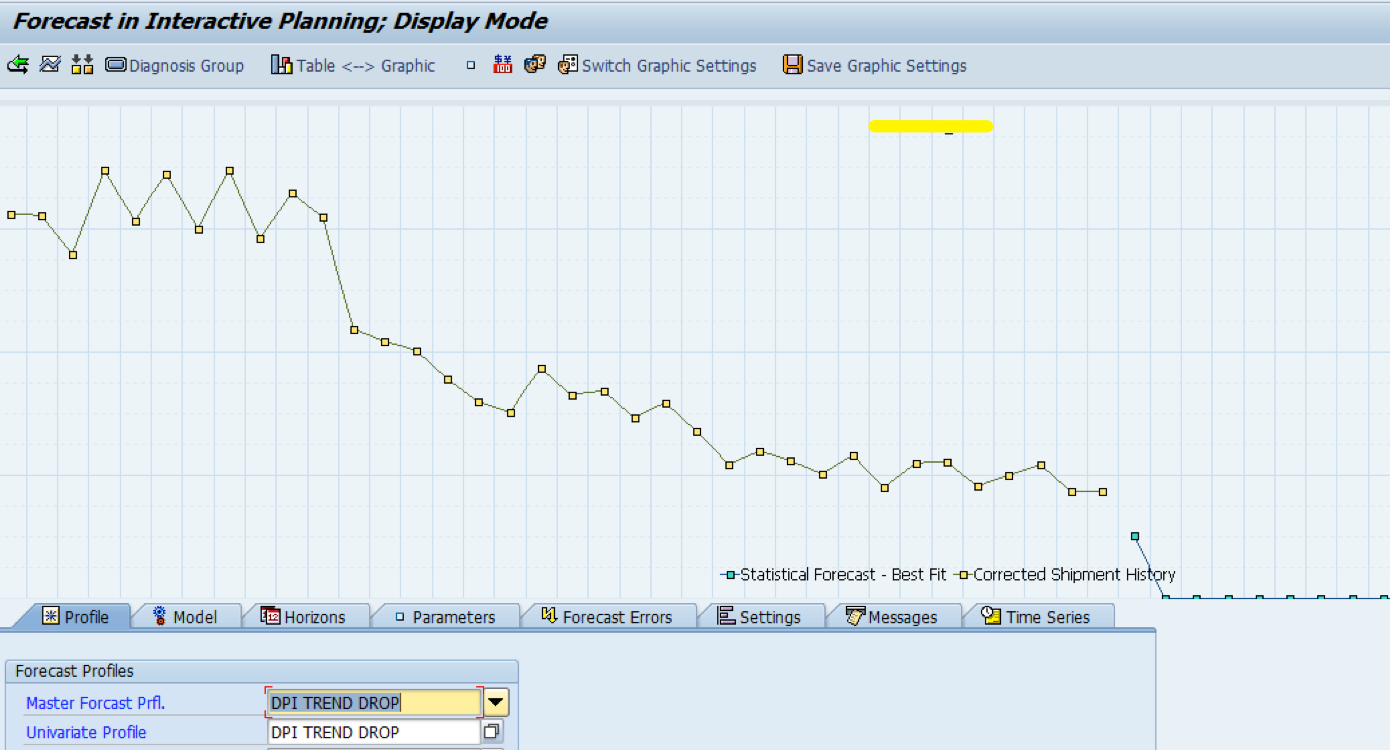
This Forecast Profile was designed for products that are nearing the end of their lifecycle, but are not yet ready for a zero forecast to be applied. This is a downward trend model with a high emphasis on more recent history – rather than the preceding history, which would create a forecast that, is too high.
DPI Conversion Model (Product 105)
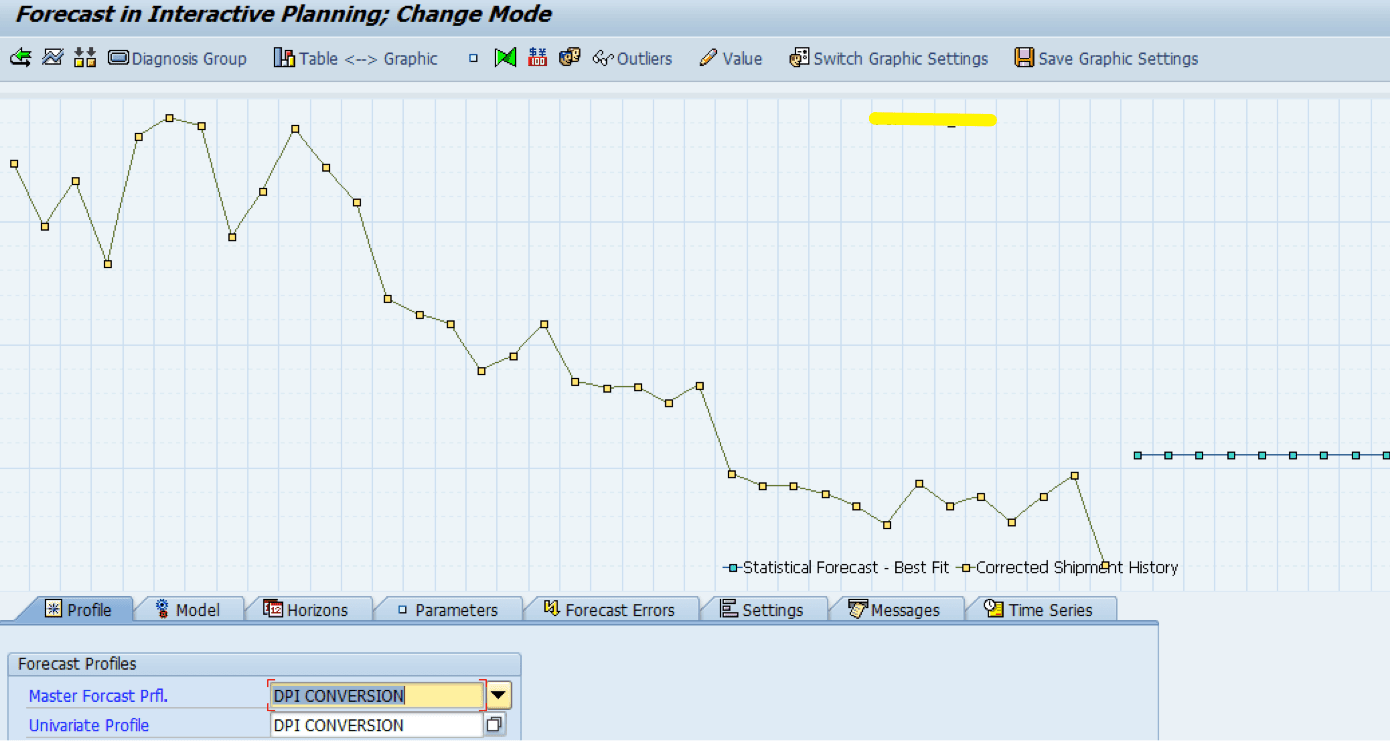
This is a special Forecast Profile designed for products that have gone through a unit of measure change. In this particular case, a product that was offered in a six-pack was changed to a 12 pack. Therefore, the same number of units sold would actually be double the volume. This Forecast Profile will work for a unit of measure change in either direction, because it simply extrapolates the most recent trend with a very high emphasis.
DPI Copy History (Product 402)
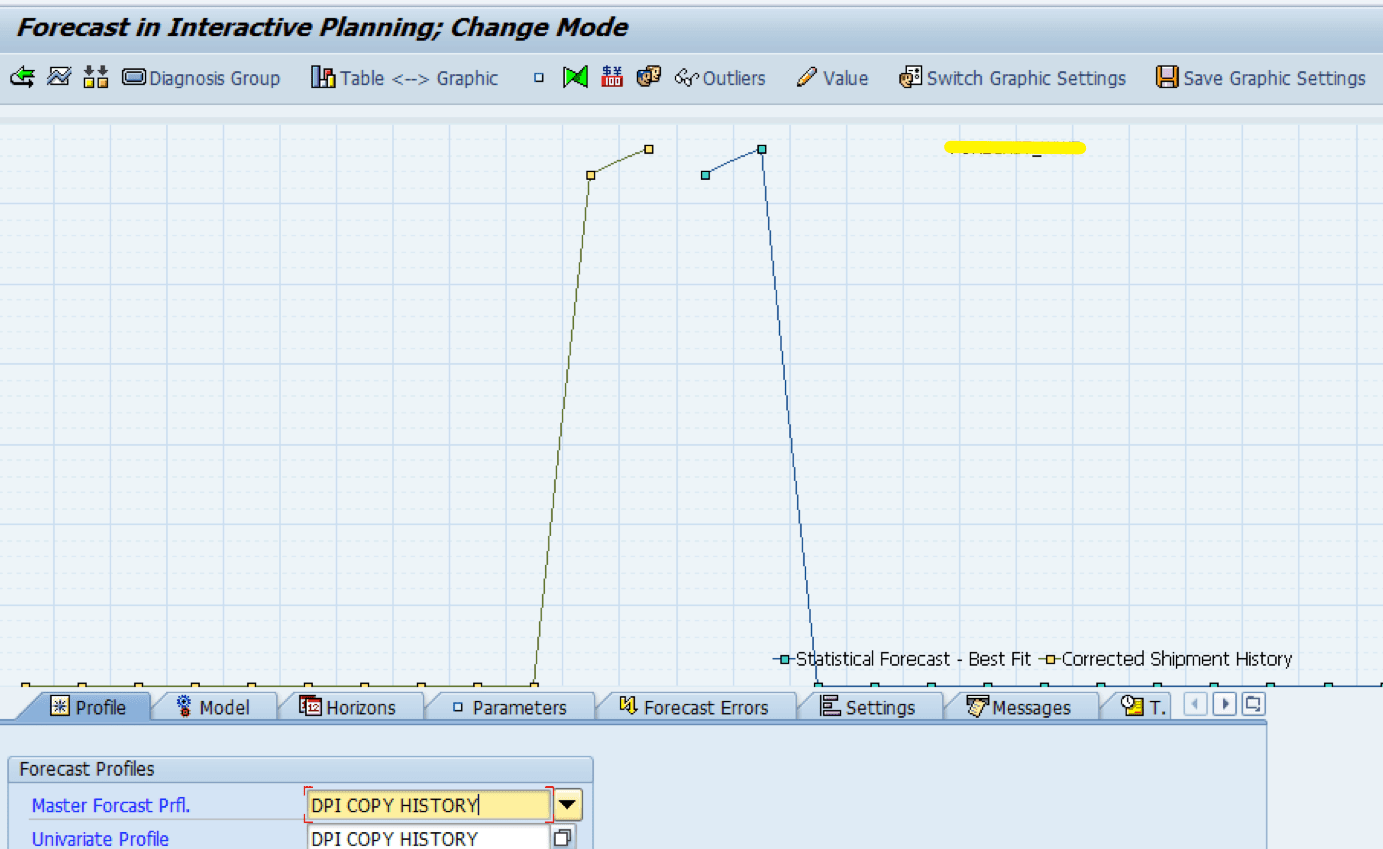
The Copy History Forecast Profile is one of the simplest of forecasting models as it simply copies forward the demand history. This Forecast Profile is used for what the author refers to as “binary seasonal” products. This is seasonal items that are only offered by XYZ COMPANY during specific times of year, and not offered at all at other times of year.
DPI Crostons’ (Product 400)
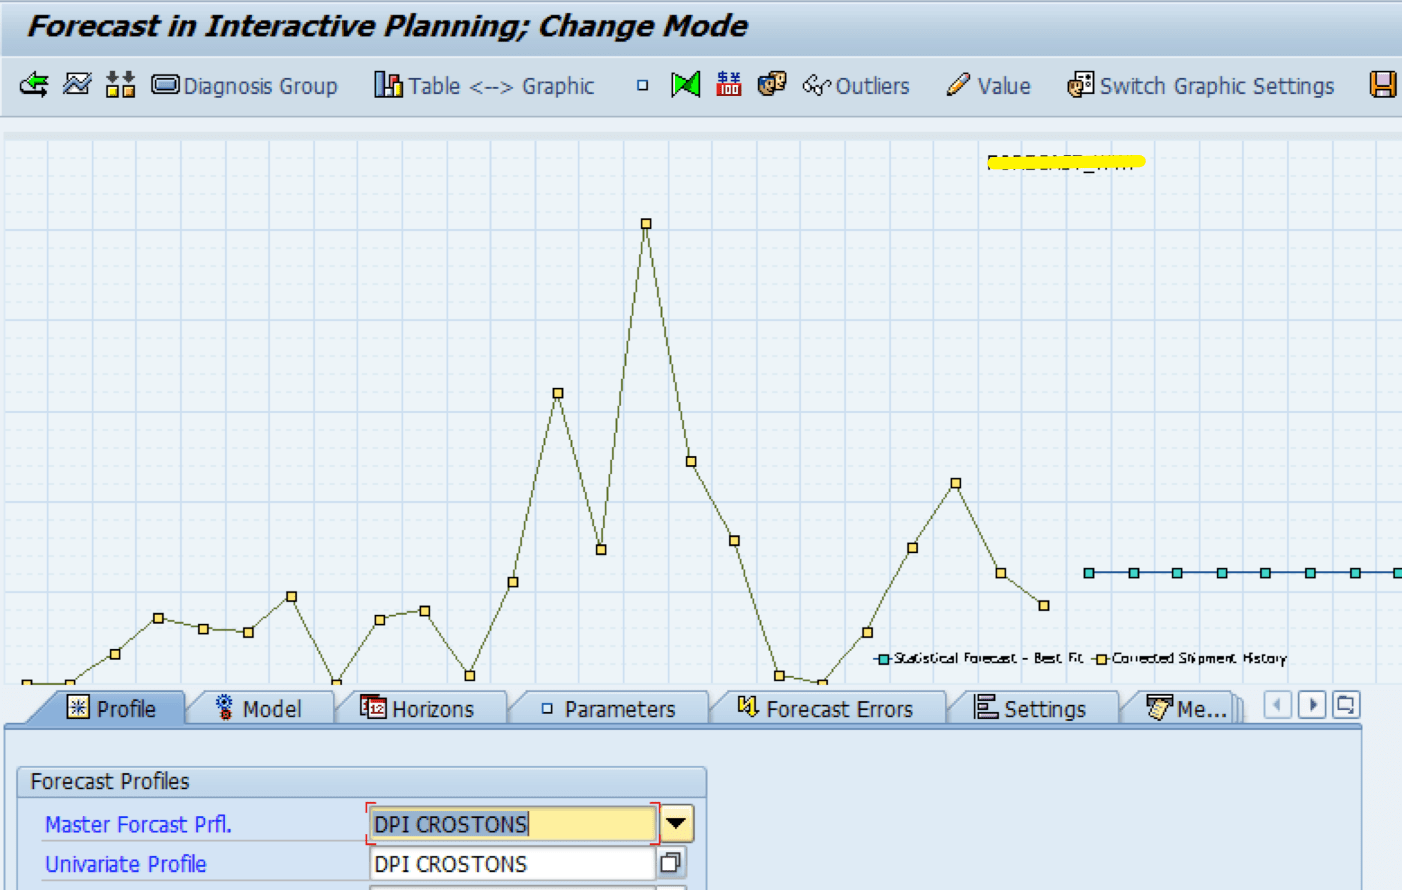
Crostons’ is a specialized Forecast Profile that is designed for intermittent products. Intermittent products always have a high forecast error regardless of the Forecast Profile used. Because of the types of products that XYZ COMPANY sells, Crostons’ should only ever apply to a small segment of the XYZ COMPANY product database.
(Note to Reader: There were many more forecast models, but they have been removed from this document sample)
The Correspondence Between the Forecast Profiles and the Selection Profiles
Each Forecast Profile has an identically named Selection Profile in the Planning Books, which is the group of forecasted items that are assigned to the named Forecast Profile in the batch job. This makes it as clear as possible that any product that is assigned to, say the DPI Level Model Selection Profile, will have the DPI Level Model Forecast Profile assigned to it and will automatically have that Forecast Profile applied when the forecasting batch job runs.
Here are the named Selection Profiles in the DEMAND_XYZ Planning Book. Notice they match the name of the Forecast Profile to which each of the forecasted items within the Planning Book is assigned. The primary flexibility in terms of using the Forecast Profiles is in the assignment of the products to the different Selection Profiles.
Understanding the Settings in the Forecast Profile
Returning to the topic of the Forecast Profiles, access to create new Forecast Profiles is being provided to both the Sr. Manager of Demand Planning, as well as the Demand Planning SMEs. This way, more Forecast Profiles can be created in the future as required. What follows is several screen shots of the Forecast Profile. Those who are given access can even make slight adjustments to existing Forecast Profiles.
This is the first tab in the Forecast Profile. It does the following:
- Connects the Forecast Profile to the Planning Area
- Tells the Forecast Profile which Key Figure in the Planning Book to overwrite
- Determines which periodicity the forecast should be created (weekly, monthly, etc..), as well as how far forward the forecast should be created, and how far back the forecast method should sample in creating its forecast.
This is the second tab of the Forecast Profile, and is the Univariate Profile – which is assigned to the Master Profile. The original purpose of the Master Profile was to allow one of three “sub-profiles” to be assigned. That is the Univariate Profile, the MRL Profile or the Composite Profile. However, Company XYZ, as with most other companies that use DP, only the Univariate Profile is used. Therefore, the existence of the Master Profile is just an unnecessary complexity – although one that must be considered when creating new Master Profiles and new Forecast Profiles.
The Univariate Profile tab tells the Forecast Profile what Key Figure in the Planning Book to use as the basis for the forecast. It also is where the Forecast Strategy is assigned, and where the Forecast Strategy is modified in its parameters.
Forecast Profile Parameters
The Forecast Profile is a combined object. It combines the forecast model along with a variety of settings. I will not list all of the settings, but I will list some of the most important ones, that is the settings or parameters that have the greatest effect on controlling the forecasting output, and are the most commonly used on DP projects.
- Forecast Horizon (Periods): How many periods a forecast is created.
- History Horizon (Periods): How many periods are used in order to created the forecast. The forecasting model ignores everything except what it is explicitly told to look at. This setting can have a similar effect as the Alpha value, in that it determines how recent or how far back information is used.
- Period Indicator: Determines the period increment or planning bucket of the forecast that is generated. Forecasts can be generated in weekly, monthly or daily planning buckets. At Company XYZ all forecasts are generated in a monthly period increment.
- Alpha: Determines how much the forecasting model should emphasize recent history versus preceding history.
- Beta: Determines how much the forecasting model looks at the recent trend versus the preceding trend.
- Gamma: This determines how much the forecasting model looks at the recent seasonality versus the preceding seasonality.
- Periods (Repeating Seasonality): This is the periodicity of the when seasonality repeats. This value is typically set to 12 (MO), which means the seasonality repeats every 12 months. However, seasonality does not have to be limited to this periodicity. It can be set to any periodicity. For instance, seasonality could repeat every 4 months or every 2 years.
- Trend Dampening: This is used to reduce the effect of the trend of the Shipment History on the forecast. Its most frequent application is for a product that has a recent uptick in demand that should not be extrapolated into the future.
CHAPTER 3: Using the Univariate View
Most of the functionality in DP that is not performed in the background resides within the Univariate view. All of the values listed in the previous chapter can be altered and then the effect checked in the Forecast Error tab in the Univariate View to show the results of the change.
SAP DP has a number of forecast error measurements. For consistency, Company XYZ has centered on MAPE, which is one of the most commonly used measurements of forecast error. MAPE has the added benefit of being very easy to compare between the application of changes to a Forecast Profile, or a new Forecast Profile being assigned.
An important issue to consider is that forecast error measurements are not 100% reliable. This is explained in Appendix A of this document.
Creating Forecast Error/MAPE Alerts
One of the questions asked in an earlier version of this paper is whether alerts can be set which will alert the planner when the MAPE is above a certain threshold.
While greatly promoted by SAP, alerts do not have much of an impact on APO projects in real implementations. One reason is that alerts are time consuming to setup and to change and most often they swiftly become out of date with the needs of the business.[1] If alerts were to be setup, experience shows that there should be only a smaller number of them. Secondly, in reviewing a number of APO implementations, using alerts will mean training a business user to update the alerts as things change, and to do things like apply the alert to new products as they are introduced. Also, alerts have their own overhead, as this SAP note will attest. https://scn.sap.com/thread/1780263
Given the other needs in terms of making changes to DP, it is the view of the author that alerts should come later after other areas of DP has improved.
Changing Forecast Profile Parameters
Forecast parameters control the forecast output. Different forecast models use different forecast parameters. The well-known Alpha, Beta and Gamma factors are considered the primary, but they are not the only forecast parameters, and as is discussed in Appendix D: Forecast Parameter Ranges, the available forecast parameters change depending upon which forecast model is being used.
Forecast Parameter Default Values
In DP, forecast parameters have default settings and if they are not set, or that is if they are left blank, they will still have these default values. The defaults are the following:
- Alpha: Weighing the recentness of the base of the forecast: Default = 0.2
- Alpha Factor 2: The Alpha factor for second order exponential smoothing = 0.3
- Beta: Only used in forecast models that use trend: Default = 0.1
- Gamma: Only used in forecast models that actually use seasonality: Default = 0.3
The higher these forecast parameters are set, the more recent versus preceding history is emphasized, and vice versa. Forecast parameters are a way of adjusting the sampling of the time series.
- Sigma: DP has functionality, which will remove outliers. The Sigma setting defines when a data point is identified as an outlier and therefore removed. Its unit of measure is standard deviations from the mean. SAP uses a Sigma factor of 1.25 as its default value. So if a data point is more than 1.25 standard deviations away from the mean (either negative or positive) that data point will be removed and not used to create the forecast. 25 standard deviations means that 80% of the observations are not classified as outliers and roughly 20% are classified as outliers. This is a low default setting compared to other forecasting applications. For instance, a more common setting is 2 standard deviations from the mean.
Outlier Removal
Outlier removal is not an automatic function, but must be setup in the Forecast Profile. This is activated in the Control Parameter of the Univariate Profile tab. Therefore; some Forecast Profiles can use outlier removal, while others do not.
Set at 1.25 standard deviations, most demand histories will have a number of outliers. However, the outlier removal threshold declares which data points should be removed from being used in the forecast. In the example above, all of the rows with an “X” would be removed from being used to create the forecast.
By changing the Sigma Factr to 2.0 fewer outliers are to be removed. However, an outlier should be a value that is truly not applicable for generating a forecast. Another term for an outlier is a “one time event.”
Removing outliers has real effects on the forecast accuracy, as is apparent from the way forecast accuracy changes as different Sigma Factrs are tested. However, one should not attempt to remove outliers in an attempt to reduce the forecast error as this is referred to as overfitting. Instead, real one-time events should be removed from the Shipment History.
Company XYZ uses outlier removal for the Forecast Profile DPI Low Seas Less Recent, however, it could be added to more Forecast Profiles, although the Sigma Factr will need to be customized per Forecast Profile for the Forecast Profiles where outlier removal is desired to be used.
Changing Forecasting Parameters and Creating New Forecast Profiles
The most effective way to set the forecast parameters, and in fact any other change is to copy over a pre-existing Forecast Profile that has been custom created during the DPI project to match the demand histories of Company XYZ.
This can be accomplished in two different ways, one is to copy over a Forecast Profile in the Forecast Profile transaction, and the second is to use the Compare Version functionality within the Univariate view to do the same thing but in a different pathway.
Creating a New Forecast Profile by Copying an Old Forecast Profile within the Forecast Profile Transaction
- Going into the Forecast Profile transaction selecting the pre-existing Master Profile (that is DPI LEVEL SEASONAL, DPI LEVEL TREND, DPI LINEAR REGRESSION)
- Giving the Master Profile a new name. The new name should begin with DPI, to differentiate it from other Forecast Profiles. Next save the new Forecast Profile.
- As soon as the new Master Profile is saved with a new name, any change can be made to it without affecting the Master Profile that it was copied from, which of course is quite important. Any change made to a Master Profile without saving it as a new name will affect every item that is assigned to the Master Profile. For example, if we make a copy of the DPI LEVEL SEASONAL Forecast Profile, we can rename it to DPI LEVEL SEAS RECENT.
- Next we will want to save the new Master Profile.
- In order to make the Forecast Profile different from the original Master Profile that we copied from, we will move to the second tab and bring up the Gamma parameter. This will emphasize more recent seasonality.
When a new Forecast Profile is created it can then be assigned to various items in by creating a new Selection Profile in the Planning Book. In order to keep this consistent with how the rest of the Forecast Profiles assignment Selection Profiles are setup the new Selection Profile should also be named “DPI ***.” After this is created, new items can be added to it, and any items that are added must be removed from the Selection Profiles where they are currently assigned.
- Finally, any new Forecast Profile must be added to the Forecast Profile Master List. This is the external list that is kept that is sortable and allows all the people that work in demand planning to keep track of which Forecast Profiles are assigned to which forecasted items. This Forecast Profile Master List is discussed in more detail further on in the document.
Creating a New Forecast Profile with the Compare Version Functionality
In the first version of this document the following question was asked.
Question 1. “The Univariate view tracks all forecast iterations used and records the forecast error for each of the parameters used for each run.”
Answer 1: This functionality is called the Compare Versions, and is triggered by the double down arrow button in the Univariate View. Compare Versions shows how the error changes depending upon the forecast, as well as the parameters between the various forecasts. We will combine answering this question with both how this functionality can be used to track and compare forecasts versions, as well as how the functionality can create a new Forecast Profile from these saves forecast versions.
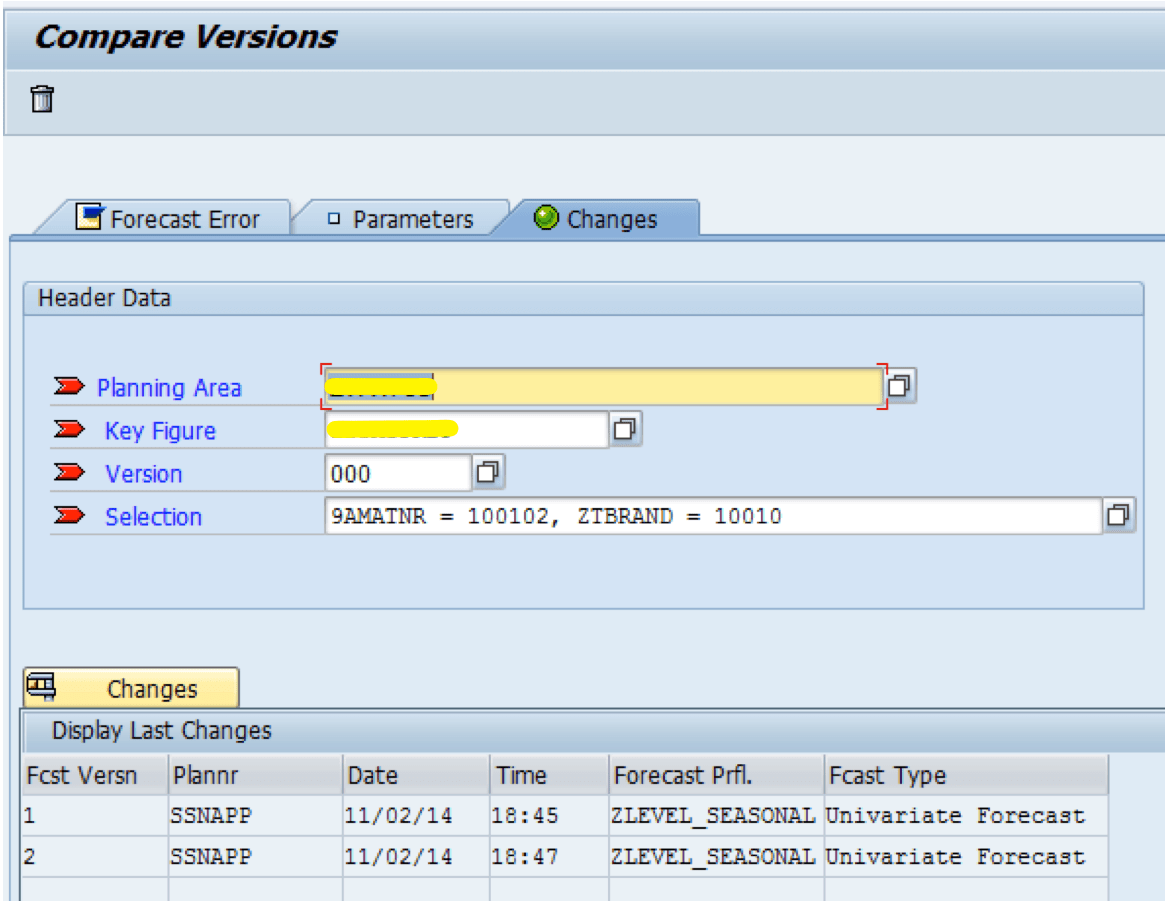
Here is one of the screens of Compare Versions. It records the Planner that made the change, the date and time the change was made, the Forecast Profile as well as the type of forecast that was run.
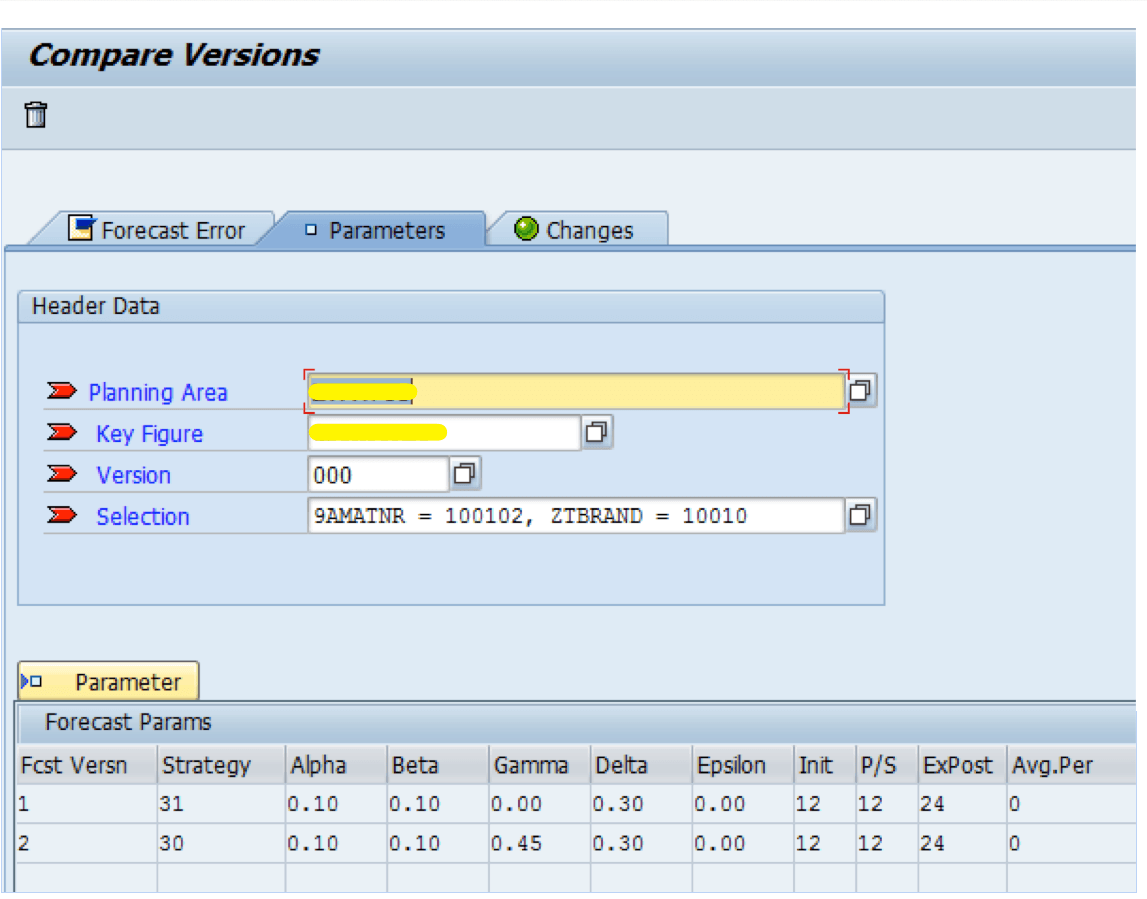
In this tab, all of the parameters are recorded. Notice that Compare Versions records that all of the parameters stayed the same, except my change to Gamma between the first and second forecast version.
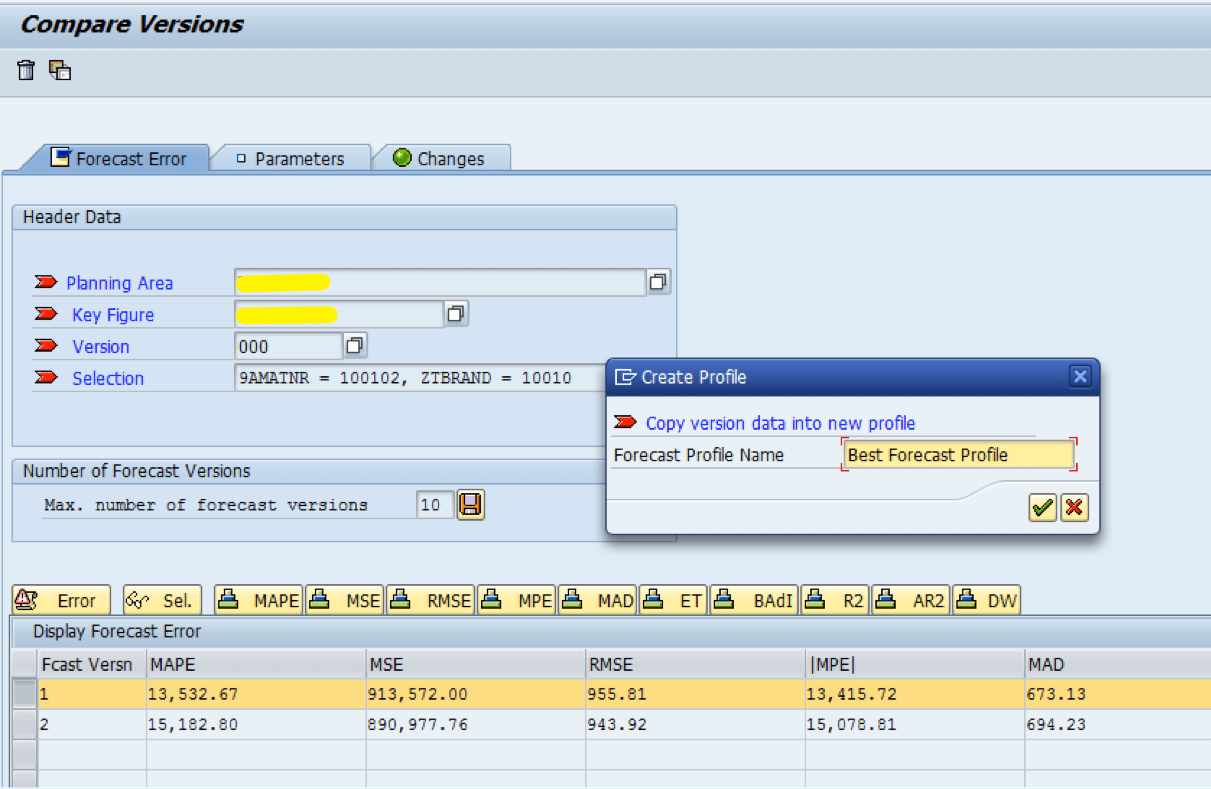
Another interesting feature of this functionality is that any forecast version can be selected and a new Forecast Profile can be generated. This can be seen in the following screen shot.
 One handy way to integrate this functionality into the proposed forecasting process is to have demand planners experiment with changing parameters, which are then saved as Forecast Versions. Once the best forecast version is found, the demand planner could email the Demand Planning SME asking the SME to create a new Forecast Model. This would short-cut the approach proposed up to this point where the planner would write down the change in an email and send it to the SME to create a new Forecast Model.
Overall, some more thought will need to go into how to best leverage this functionality. This can occur after more discussion on this topic and the use of Compare Version could be more built out in the third version of this document.
Another related question to the Compare Version functionality that was asked in response to the first version of this document is listed below.
Question 2: “Can we chart/graph (Stat from Previous Run), (Latest Stat Run in univariate), Ex-Post?”
Answer 2: I am not aware of any way to chart the previous forecast. Ex-Post can always be shown in the Univariate view; however, the Ex-Post forecast line shows the Ex-Post forecast for the current forecast that is applied.
Simulating Forecast Changes from the Univariate View
- Transaction: Within the Planning Book (/SAPAPO/SDP94/), and then selecting the Univariate Button.
- Applies To: All
Forecast simulation is the ability to apply new Forecast Profiles and the change Forecast Profiles and see the changes to the forecast and most importantly the forecast error. The Univariate View is where new Forecast Profiles can be assigned to forecasted items and changes can be made to the Forecast Profiles (although not saved) in order to simulate changes.
One enters the Univariate View by selecting the Univariate button. The Univariate button resides on the upper right hand side of the Planning Book interface – for Planning Books where it has been added. It is currently in the FORECAST_XYZ Planning Book, but not yet the DEMAND_XYZ Planning Book. We are planning to add this button however. DEMAND_XYZ is the primary Planning Book used by Company XYZ demand planners.
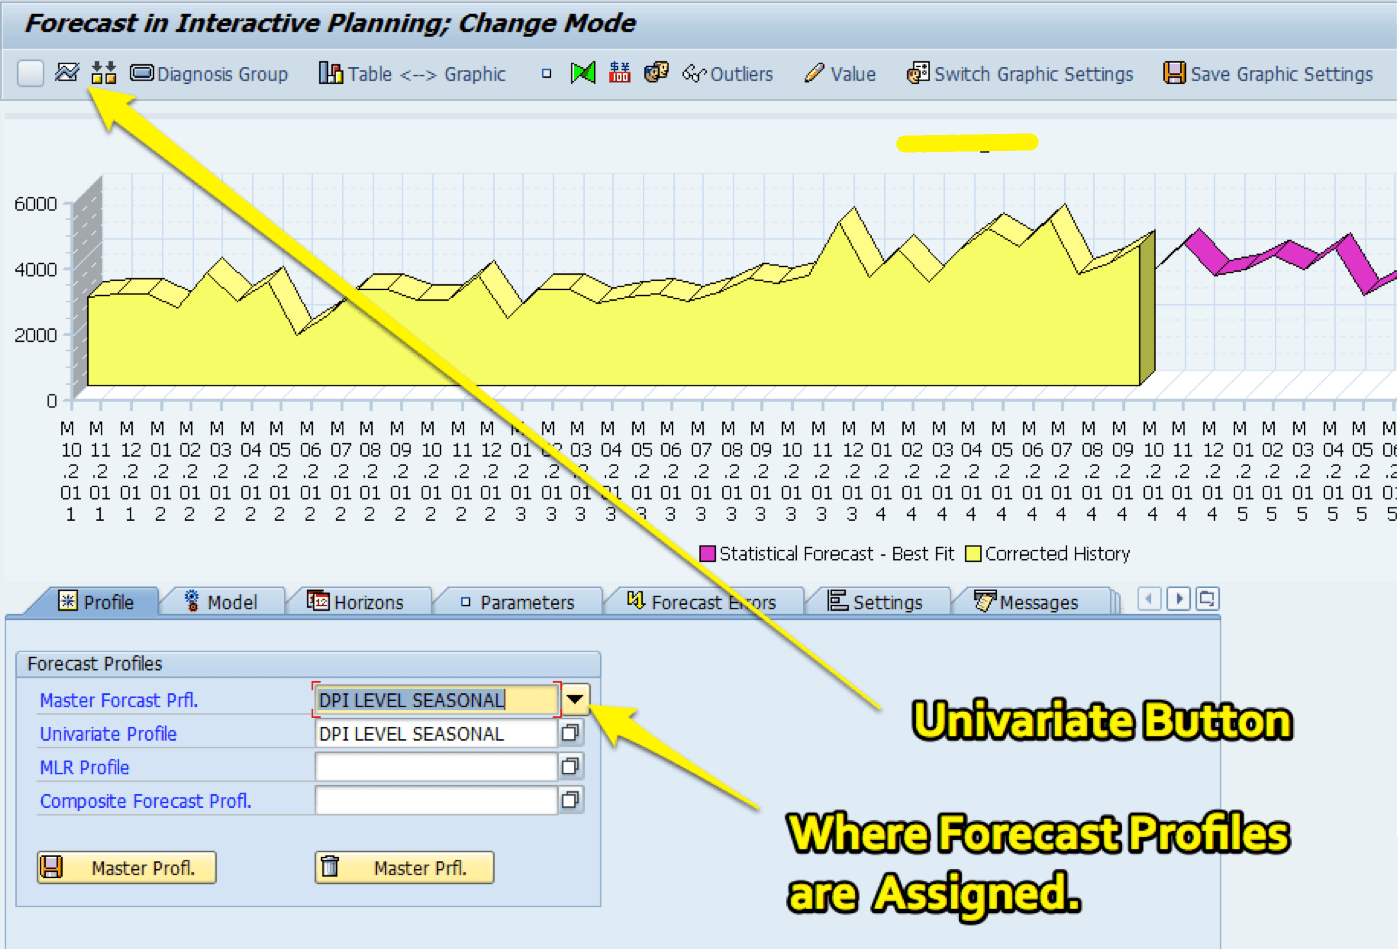
Once the Univariate button is selected, the Univariate view will appear. Once inside of the Univariate View, the Univariate button is used again to apply any change that is made in the tabs below the graph, to the Forecast Profile. This will immediately change the forecast – but will not save the changes as permanent. In this way simulation can be performed to determine the outcome based upon changes. As was covered already, the Compare Versions functionality records up to 10 iterations – or different versions of the Forecast Profile. Any of those versions can be brought back into being the active Forecast Profile at any time.
There is a way of saving the changes so that they are permanent, but all of those who use the Univariate View are advised to not save any changes in the view. This is in order to prevent overwriting the master Forecast Profile (that is the Forecast Profile that is centrally maintained). (In fact, we will most likely be disabling the ability to overwrite the master Forecast Profile from the Univariate View.) Instead the Univariate View should only be used for simulation purposes.
Using Best Fit Forecasting Interactively in the Univariate View
Best-fit functionality exists within SAP DP. The way to use it is by selecting the Auto Model Selection 2. However, while Auto Model Selection 2 can be used to determine what is a reasonable forecast error, there are issues with actually using the Auto Model Selection 2 for assignment to a forecasted item.
- One of these issues is that the Auto Model Selection 2 will often provide results that are not the same when run in the background as when run in the Planning Book. For this reason, Auto Model Selection 2 is not run in the background as part of the forecasting process at company XYZ, or at other companies that use DP.
- Second, the Auto Model Selection 2 takes much longer to run – as DP must go through many more calculations.
- Third, the Auto Model Selection 2 will have different results depending upon the run.
All of these issues eliminate the possibility of using DP’s best fit a part of the automated forecasting job, and in fact I have yet to see the Auto Model Selection 2 used as part of the forecasting batch job at any DP client. However Auto Model Selection 2 can be run in the Univariate View (also known as being run interactively). Auto Model Selection 2 will not produce a forecast error that is lower than one of the DPI Forecast Profiles, or a custom/new Forecast Profile. It can be used as a guide to see what a good forecast accuracy is, and as a benchmark to find a better accuracy.
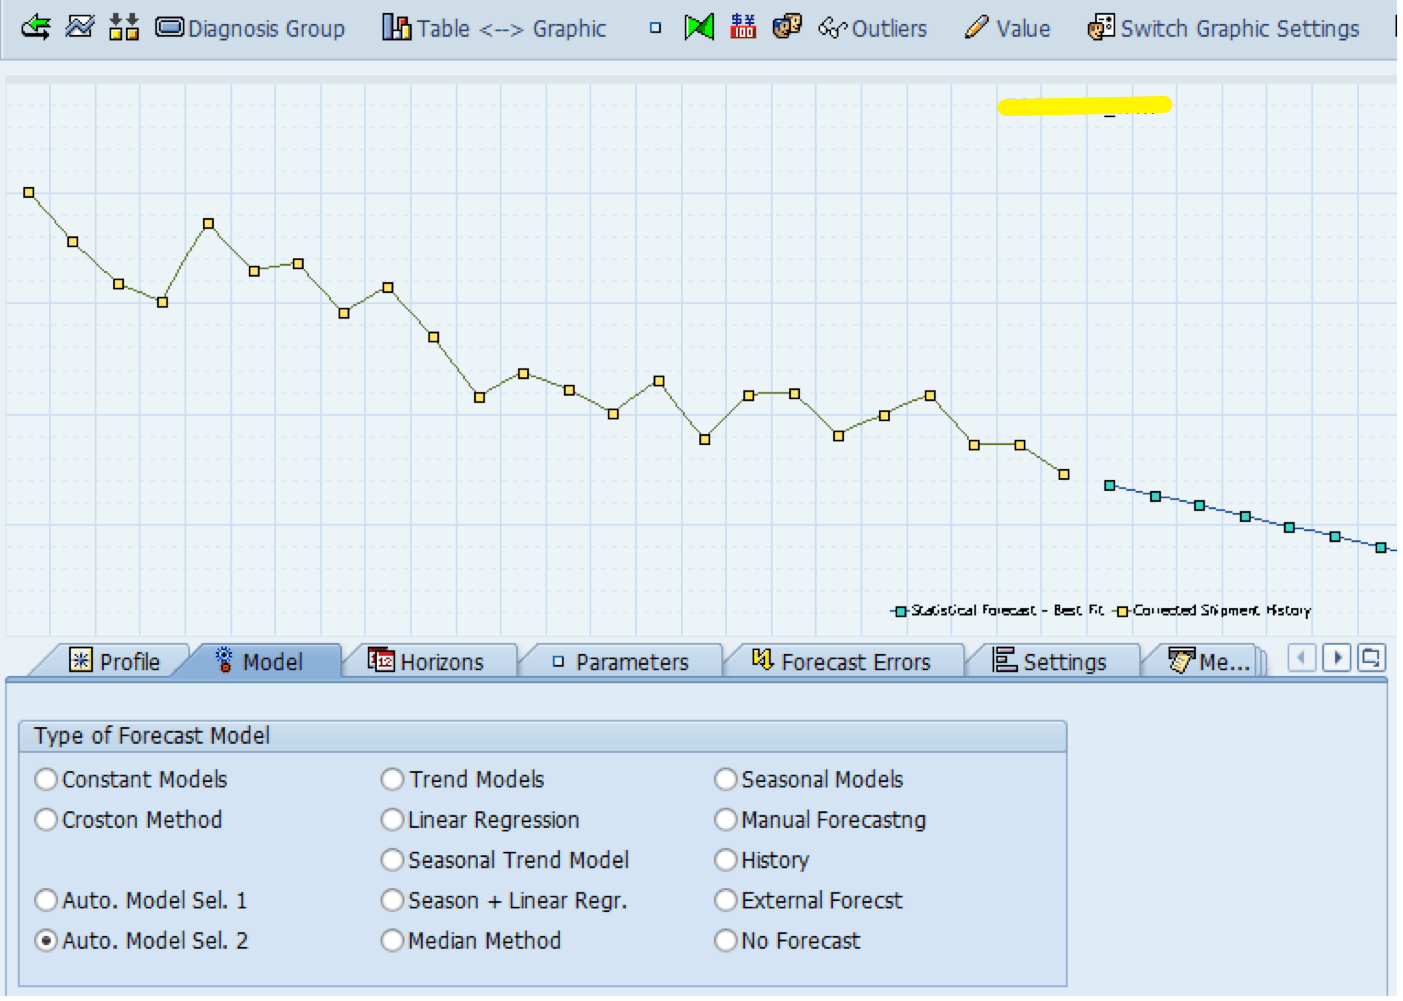
Here I have enabled the Auto Model Selection 2. This produces a reasonably good forecast error – but not the lowest possible forecast error. From here the demand planner can then choose from among the DPI Forecast Profiles to find a forecast error that is lower.
Forecast Profile Reassignment in the Univariate View
- Transaction: Within the Planning Book (/SAPAPO/SDP94/)
- Applies To: All in Demand Planning
In order to place a particular assignment between a forecasted item and a Forecast Profile, it is necessary to assign the forecasted item to the Selection Profile in the Planning Book. As part of the DPI project, there have been multiple Selection Profiles that have the same name as the Forecast Profile. This is assigned to the forecasting batch job, and any person in Demand Planning can change the assignments by moving the items between the Selection Profiles. There is also the Forecast Profile Master List of the assignments, which is maintained by the SMEs. It is important that the Selection Profiles are in synch with this master list. For this reason, it is recommended that any demand planner communicate the change of assignment to the SMEs, who can then update the master list. Periodically the SMEs can send out an up to date copy of the master list to the rest of the Demand Planning team.
Deleted Screen Shot
This Forecast Profile Master List is very handy for finding the assignment between the forecasted item and the Forecast Profile. It is easy to sort and easy to update. The master list communicates other important information, such as whether the forecasted item has historically been improved in its forecast accuracy with manual intervention.
It is possible that this same information could be extracted from a report – however, this would be more work, and there would be a loss in flexibility in terms of the ability of the business to make changes to the master list, to add new columns, etc.. However, it is also understood that there is a preference to use the system, rather than spreadsheets whenever possible.
CHAPTER 4: Decentralization of Some IT Demand Planning Batch Jobs
Company XYZ uses a number of batch jobs in order to schedule various activities. However, supply planning at Company XYZ has been using a user-distributed batch job running transaction, called the 700 User Tool, for some of the SNP batch jobs for more than a year and a half. This is quite a good thing as it provides the business with more control, and as long as a few rules must be followed, it is something that would also be beneficial for demand planning.
One example of this is running the statistical forecast. For instance, there has been some question as to how frequently the statistical forecast should be run. With the distribution of kicking off the statistical forecast, this can be determined and controlled by demand planning. Previously, this was scheduled monthly, however, as long as the demand planners are out of the Planning Book, there is no reason that the statistical forecast cannot be rerun at the time of demand planning’s choosing.
The 700 User Tool is accessed by the transaction ZS7DP. When accessed the following screen will appear.
Here is the user interface. By selecting the first button, we can then provide a Selection Profile that the macro button trigger can be applied to.
This is currently being considered for DP, but is in the early stages. Clearly some thought should go into what DP Process Chains should be distributed in this way.
Three processes are currently either in process or being considered to be migrated to the 700 User Tool.
- The Copy History Process
- Triggering The Statistical Forecast Run
- Copying the Statistical Forecast to the Planner Base Key Figure.
CONCLUSION
This paper has explained that there are a number of items and settings that have been tested and are ready to be leveraged by demand planners. The intent is to have demand planners perform more of the activities that can allow a better statistical forecast to be generated. A forecast study undertaken by the DPI project showed that if the statistical forecast is generated correctly for the entire product database (which means following the steps outlined in this paper) that the number of products that require manual adjustment greatly decreases. Less manual intervention and manual overrides means more time to maintain the system, which will create a positive feedback loop. Many of the Company XYZ products can be effectively forecasted with nothing more than a statistical forecasting model. Some products of course will always require manual adjustment.
Secondly, more functionality is being distributed to Demand Planning. This includes standard functionality such as the Univariate view of the Planning Book as well as the 700 User Tool for the running of batch jobs. However, to keep these new capabilities operating at a high level, it is necessary to have all the demand planners read through this document to both understand what is available, but also who has the authorization to do what activity. The ability of demand planners to make simulate changes to Forecast Profiles, but not to actually change or create new the Forecast Profiles, which is reserved for the SME an the Sr. Manager of Demand Planning is a good example of this. It also means performing maintenance tasks, such as updating this document with the new Forecast Profiles as they are created, and updating the assignment of the Forecast Profiles and the product in the Forecast Profile Master List.
REFERENCES
https://scn.sap.com/thread/1780263
https://en.wikipedia.org/wiki/Mean_absolute_percentage_error
https://help.sap.com/saphelp_em70/helpdata/en/da/74dc3f86e64859ab77b72f3bb1e6c5/frameset.htm
[1] Sometime after 2004 the APO Alert Monitor, which is where alerts are created and changed was made significantly more difficult to use. The pre 2004 Alert Monitor was actually useful to use as a reporting system – that is it had a dual purpose and was easier to train business users how to configure.
_______________________________________________________
Engaging with Us
We often can work for a good portion of any documentation project remotely to keep down costs. We can focus on just one area to document that is causing the most problems at the company, or we can document an entire area such as how FI/CO or how MM is configured and how it is used in your company. To find out the details of how our SAP documentation writing service can help your company, and how it works just fill in the form below.