
How to Understand The SAP APO Macro, Operators and Functions
Executive Summary
- We cover the major components of the Planning Book with our mockup.
- We cover row selection, SAP Macros, demand Key Figures, forecast Key Figures, supply Key Figures, stock Key Figures, and the APO Macro Builder.
Introduction: A (Relatively)Comprehensive Run-through of the Planning Book
This article is designed to clarify how to interpret the Planning Book properly and to understand the components which support it, which includes the SAP macro, operators, and functions. The Planning Book may look simple at first glance, but there is quite a bit going on in the background. Once we cover the Planning Book, we will get into detail on SAP macros.
The Planning Book
The Planning Book is made up of rows or Key Figures that intersect with time buckets, which are columns. These Key Figures can be composed of the following items:
- Single Categories: For instance, to show a single category of stock in a Single Key Figure.
- Multiple Categories: For instance, to show various categories of stock in a single Key Figure.
- Calculations of other Key Figures Functions: which include configuration settings in APO. This is called a macro.
Many of the rows that planners see in the Planning Book are calculated values. Through regular use of the Planning Book, there is no way to know which Key Figures are combinations of categories or which are calculations (macros), which include other Key Figures. Some of the macros are standard calculations that ship with APO. For instance, the reorder point key figure is a macro. If it is either custom wrote for a company or a standard macro, any macro can be adjusted. For instance, this article describes how to modify the standard reorder point macro so that it is calculated in a way that matches the reorder point in SAP ERP.
Understanding the Structures in APO
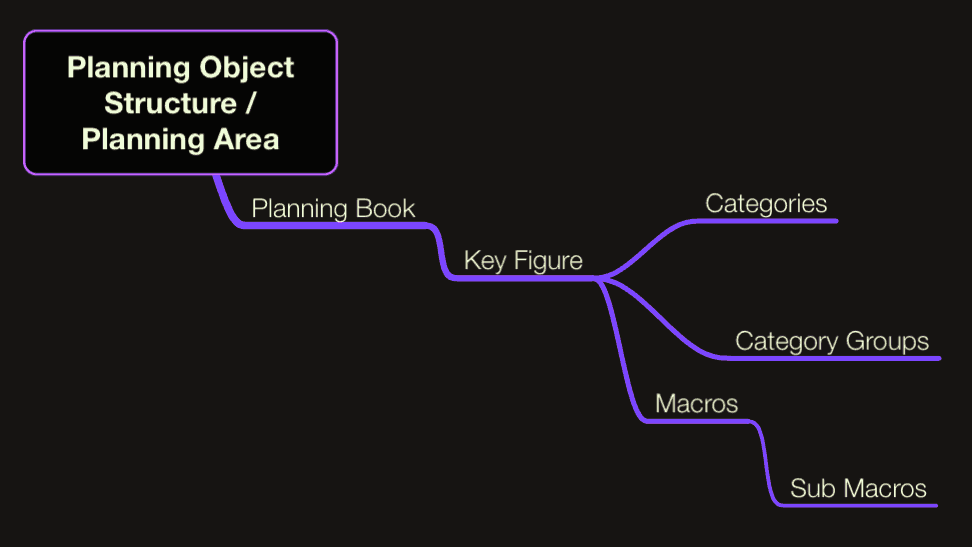
All of the objects discussed thus far are part of a hierarchy that is necessary to make the Planning Book show the results that it does. For ease of understanding, the graphic below shows how macros, Key Figures, Planning Book, Planning Area, and Planning Object Structure are all related to one another.
The Planning Book Mockup
Before we describe all the individual components, it is important to review the layout of the SNP Planning Book because we will be working backward from this view as we get into a more detailed description of how these values are populated. Here is a screenshot of the standard SNP Planning Book. This Planning Book has been configured to show some Key Figures and to hide others based upon the predicted needs of the planners.
The Planning Book is segmented into three main areas, demand, supply, and stock. There are specific areas of the planning book that have key figures that are easily categorized. Unfortunately, the Planning Book does not have natural coloration. Nor any other identifying that can help the user immediately interpret which areas are the demand key figure grouping, the supply key figure grouping, or the stock key figure grouping. However, we can rectify that a bit by showing how the sequence of key figures relates to the Planning Book’s logic.
One could logically superimpose boxes over each area, the top box being demand key figures and the lower box being supply key figures, and the bottom being the stock key figures.
SAP Macros
SAP macros are stored development objects that populate key figures in the planning book. They are vital in SAP APO DP and SNP projects. When standard macros are used, this is simply the development repository. When a pre-existing macro is created (it is often easier to adjust a pre-existing macro rather than start from scratch) or a new SAP macro is created from scratch, this is a custom development activity. Because a macro is not coding, some people who work in SAP APO may not consider it classical development; however, it is. It is merely done within the APO macro builder.
Macros can be designed to do a lot of things. However, when making new macros, they need to be approached within the development context as they have similar maintenance implications to other forms of development.
Many of the standard Key Figures in the Planning book are populated by macros. These are standard macros that ship with APO.
- Some of what will follow will be repetitive. But it will help explain the SAP macro location in two different ways, one how the macro connects to the Key Figure, and secondly, how the SAP macro themselves are calculated independently of the Key Figure.
- SAP macros with other SAP macros contained within them are typed in ALL-CAPS and underlined. All SAP macros that do not contain other macros are lowercase and underlined.
Note: There is another way of interpreting the relationship between super SAP macros and sub-SAP macros, and that is that each sub-SAP macro is a step in the super SAP macro. However, the two different ways of interpreting super and sub-SAP macros is not all that critical to understanding their use in the Planning Book.
Demand Key Figures
- Forecast Key Figure
- With Forecast Consumption Turned On
- Without Forecast Consumption Turned On
- Stock Transport Requisition
- Distribution Demand (Confirmed)
- Stock Transport Order
- Dependent Demand
- Total Demand Key Figure
- Inbound Stock Transport Requisitions
These Key Figures represent the different demands that can come into APO. We will start with the first Key Figures and work our way down the list. We will also describe what makes up the Key Figure (either categories or macros)
Forecast Key Figure
There are two different interpretations of this Key Figure, depending on how SAP is configured. This Key Figure should be observed one way when forecast consumption is turned on and another way when forecast consumption is inactive. Both interpretations are discussed below.
With Forecast Consumption Turned On
The way SAP is normally configured, the name of the Forecast Key Figure is misleading. Instead of being the actual forecast, it is normally the unconsumed portion of the forecast. I normally say because this implies that a Requirements Strategy enabling forecast consumption is used. The Requirements Strategy controls if this macro is active and whether forecast consumption occurs. There is a future plan to allow this functionality, but it is presently disabled. After this functionality is turned on, there is a possibility that this Key Figure will be renamed to Unconsumed Forecast and a new Forecast Key Figure, which represents the forecast inserted above it. The details around this are described in this article.
The Forecast Key Figure comprises a single Category (FC req: Forecast Requirement), which is the Forecast. However, the macro Consumption (Forecast / Sales Order) decrements the Sales Orders from Forecast to return a value for this Key Figure. This macro follows the logic of the Requirements Strategy, which is stored in the Product Location Master.
This example shows that macros have the ability to not only use other Key Figures for calculation, but they can reach out to the configuration in APO to return a result.
Without Forecast Consumption Turned On
Because one client I am aware of had some issues with the forecast consumption logic, the Consumption (Forecast / Sales Order) macro was disabled so that no forecast consumption would occur. Until this is changed back, the Key Figure is simply the (FC req: Forecast Requirements). This category is sent from DP.
Stock Transport Requisition
Also called Planned Distribution Demand by APO, this Key Figure is made up of Planned Distribution Requirements, which is composed of the following categories:
- BC: Stock Transfer Reservation
- BH: Stock Transport Requisition
- BJ: Supplier Scheduling Agreement Requirement
- EB: SNP Release for Stock Transport Requisition
- ED: SNP VMI Sales Order
- HJ: SNP Suppliers Schedule Agreement Release
Distribution Demand (Confirmed)
This is a hidden Key Figure, which is composed of the following categories.
- EG: Deployment: Purchase requisition
- EH: Deployment VMI sales order
Stock Transport Order
These are Stock Transport Requisitions that have been converted into STOs by the ERP system.
- BI: Stock Transport Order
Dependent Demand
This is the demand for raw materials and semi-finished goods. This demand is created because the material in question is part of a bill of material of a finished good.
This Key Figure is hidden in the SNP Planning Book.
However, one can easily determine that demands in the Total Demand Key Figure (which is where the dependent demands will appear) are dependent upon another material by either observing that the material is not a finished good or by observing that there are no values for the Sales Orders or Forecast Key Figure.
See the screenshot below (a finished goodwill normally have either Sales Orders or a Forecast).
The Dependent Demand Key Figure is made up of the following categories. The first two are standard with SAP.
- AY: Dependent Demand
- EL: SNP Dependent Demand
Total Demand Key Figure
If we look at the top box, we see that the Total Demand Key Figure is an addition of the Key Figures that are above it. Total Demand is a sub-macro to the Stock Balance macro.
It is calculated as the following:
Total Demand = (Forecast or Demand – Sales Order, or Demand + Sales Order depending upon whether forecast consumption is enabled) + Stock Transport Requisition + Distribution Demand + Stock Transport Order + Dependent Demand
Inbound Stock Transport Requisitions
An inbound Stock Transport Requisition / Stock Transport Order does not appear in either of these Key Figures, but instead in the Purchase Requisition / Purchase Order Key Figure below in the Supply Area. This is because inbound STR / STOs represent supply and are shown in the PReq / PO Key Figure.
Supply Key Figures
- Purchase Requisition
- Distribution Receipt (Confirmed)
- Purchase Order
- In Transit
- Production Planned
- Production Confirmed
- Manufacture of Co-Products
- Total Receipts
Now that we have defined the demand Key Figures, we move into the Planning Book’s Total Receipts area. These are the Key Figures that make up the supply that SNP will adjust to meet the Total Demand.
Purchase Requisition
This Key Figure is composed of the following:
- AG: Purchase Requisition
- BD: Stock Transfer Reservation
- BE: Scheduling Agreement Schedule Line
- EA: SNP Purchase Requisition
- HG: SNP Scheduling Agreement Schedule Line
Distribution Receipt (Confirmed)
This Key Figure is hidden in the SNP Planning Book and composed of a single category.
- EF: Deployment Purchase Requisition
Purchase Order
The Purchase Orders Key Figure is very simple. It is only made up of only the purchase order category.
- BF: Purchase Order Item Schedule Line
In Transit
In transit reflects material that is not in any location but is en route. It is composed of the following two categories.
- AH: Advanced Shipment Notification
- EI: In Transit
Production Planned
This Key Figure is made up of planned production orders scheduled by SNP and has not yet been confirmed by the production planning system.
- EE: SNP Planned Order
Production Confirmed
These are the standard categories that are part of the Production Confirmed Key Figure.
- AC: Production Order (Created)
- AD: Production Order (Released)
- AI: Planned order (firmed, unconfirmed)
- AJ: Planned order (not firmed, confirmed)
- BU: Inspection Lot
These are the Key Figures that are added for the client. Adding these categories is so that APO can have visibility to Process Orders created in the SAP ERP system.
- AA: Process Order (Created)
- AB: Process Order (Released)
Manufacture of Co-Products
This Key Figure is hidden in the SNP Planning Book and is composed of the following.
- EM: Receipt from the manufacture of co-products
Total Receipts
This Key Figure is a sub-macro of the Stock Balance macro. Total Receipts is simply the summation of the following Key Figures [Purchase Requisition + Distribution Receipt + Purchase Order + In Transit + Production Planning + Production Confirmed + Manufacture of Co-Products.
Stock Key Figures
- Stock on Hand
- Supply Shortage
- Safety Stock
- Days’ Supply
- Safety Stk/Reorder Point/Targt Stock Lvl
These Key Figures keep track of the stock position of the material.
Stock on Hand
This is what the client plans to have in stock in different periods. It is calculated by a sub-macro to the Stock Balance macro. It is defined by the formula below:
- Stock on Hand Display =
- IF the Stock on Hand Projected Key Figure > = 0,
- THEN
- Stock on Hand Initial = Stock on Hand Projected
- AND Supply Shortage = 0
- ELSE IF
- Stock on Hand = 0
- THEN Absolute Value (Stock on Hand Projected)
- END
Supply Shortage
This is how short the client is vs. demand and is calculated as part of the Stock on Hand Display macro. This is a sub-macro to the Stock Balance macro, which is fully described in this post. The Supply Shortage value depends on the Stock on Hand Projected Key Figure, as can be seen from the equation below.
- IF the Stock on Hand Projected Key Figure > = 0,
- THEN
- Stock on Hand Initial = Stock on Hand Projected
- AND Supply Shortage = 0
- ELSE IF
- Stock on Hand = 0
- THEN Absolute Value (Stock on Hand Projected)
- END
Safety Stock
This value is designed to account for negative variability in supply and demand. It is calculated by a sub-macro to the Safety Stk/Reorder Point/Targt Stock Lvl macro.
Safety Stock is calculated by using the SAFETY_CALC function which simply “returns the safety stock for the location product referring to the parameters saved in the location production master data. – SAP Help
This macro’s results depend upon the safety stock method selected, which changes per product location combination. The way to check this setting is to go to the Lot Size tab in the Product Location Master. /N/SAPAPO/MAT1. A screenshot has been provided below. The safety stock settings are at the bottom of this SAP screen.
It should be recognized that not all client materials have a safety stock method selected. Therefore, the Safety Stock Key Figure will not always have values populated within it in the Planning Book.
Days’ Supply
This Key Figure is a macro which is approximated by the following formula (Stock on Hand / Total Demand) * Days in the Period. The Days in Period depends upon the bucket being used. The Days in Period is itself a macro called Workdays, which is defined below under variable macros.
- Safety Stk/Reorder Point/Targt Stock Lvl (SAP Macro)
- Target Stock Level (SAP Macro)
- Target Days’ Supply (SAP Macro)
Safety Stk/Reorder Point/Targt Stock Lvl
This SAP macro calculates four outputs with four sub-macros, two of which are used in the Planning Book. These four sub-SAP macros are:
- Safety Stock (SAP Macro)
- Reorder Point (SAP Macro)
- Target Stock Level (SAP Macro)
- Target Days’ Supply (SAP Macro)
- Stock Balance (SAP Macro)
- Consumption (Forecast / Sales Order) (SAP Macro)
Safety Stock is calculated by using the SAFETY_CALC function which simply “returns the safety stock for the location product referring to the parameters saved in the location production master data. – SAP Help
Reorder Point is not used in the SNP Planning Book, so it has not been defined here.
Target Stock Level (SAP Macro)
This macro uses the TARGET_CALC function which “..returns the target stock level referring to the parameters saved in the location production master data. If these parameters require a manual entry for the target days’ supply or the target stock level, enter a value , otherwise enter 0. – SAP Help
This can be found on the Quantity and Date Determination sub-tab of the Lot Size tab of the Product Location Master /N/SAPAPO/MAT1. This setting requires the selection from among a range of options to set how this value is calculated.
Target Days’ Supply (SAP Macro)
This is calculated through the use of the TARGET_DAYS function for a product at a location referring to the parameters in the Product Location Master.
Stock Balance (SAP Macro)
This SAP macro is composed of the following SAP macro (s). They are some of the most important calculations in the Planning Book.
- Consumption (Forecast / Sales Order)
- Total Demand
- Total Receipts
- Stock on Hand (initial)
- Stock on Hand
- Stock on Hand Display
Consumption (Forecast / Sales Order) (SAP Macro)
This uses the function DEMAND_CALC, which turns on consumption based upon the Requirement Strategy, set in the Product Location Master. If this field is left blank, this consumption macro is disabled, and no forecast consumption occurs. If the Requirements Strategy is turned on, then consumption occurs. What this means is that the Sales Order Key Figure is subtracted from the Forecast Key Figure.
Total Demand (SAP Macro)
This Key Figure is composed of the major demand Key Figures. This is (Forecast or Demand – Sales Order, or Demand + Sales Order depending upon whether forecast consumption is enabled) + Stock Transport Requisition + Distribution Demand + Stock Transport Order + Dependent Demand.
Total Receipts (SAP Macro)
Total Receipts is simply the summation of the following Key Figures (Purchase Requisition + Distribution Receipt + Purchase Order + In Transit + Production Planning + Production Confirmed + Manufacture of Co-Products)
Stock on Hand (initial) (SAP Macro)
The equation for this macro is the following:
- IF Stock on Hand Projected > = 0
- THEN
- Stock on Hand (initial) = Stock on Hand Projected
- AND
- Supply Shortage = 0
- ELSE IF
- Stock on Hand (initial) =0
- THEN
- Supply Shortage = ABS (Stock on Hand projected)
Stock on Hand (SAP Macro)
The equation for this SAP macro is the following:
Stock on Hand Projected + Total Receipts – Total Demand
Stock on Hand Display (SAP Macro)
This simply returns a value if the Stock On Hand Projected is greater than zero, and other conditions hold.
- IF
- The Stock on Hand Projected Key Figure > = 0
- THEN
- Stock on Hand Initial = Stock on Hand Projected AND Supply Shortage = 0
- ELSE IF
- Stock on Hand = 0,
- THEN return the Absolute Value Stock on Hand Projected)
Alert SAP Macros
As you can see, the alerts are classified as DB or Dynamic alerts.
- Stock Below Safety Stock (DB Alerts)(SAP Macro)
- Target Stock Lvl Exceeded (Dyn. Alerts)(SAP Macro)
- Stock Below Target Stock (DB Alert)(SAP Macro)
- Supply Shortage (DB Alert)(SAP Macro)
- Supply Shortage (Dynamic Alerts)(SAP Macro)
- Target Stock Level Exceeded (DB Alert)(SAP Macro)
- Stock Below Safety Stock (Dyn. Alerts)(SAP Macro)
Some of the SAP macros in the Planning Book are used to create alerts. They do not appear in any of the Key Figures of the Planning Book. The alert macros are defined below.
Stock Below Safety Stock (DB Alerts)(SAP Macro)
This logic creates an alert if the Stock on Hand is smaller than the Safety Stock, as long as the Safety Stock is greater than zero.
- IF
- Stock on Hand Projected < Safety Stock AND Safety Stock > 0,
- THEN Generate Alert for Stock on Hand Projected and Safety Stock in the Display Unit)
Stock Below Safety Stock (Dyn. Alerts)(SAP Macro)
This logic is the same as the Stock Below Safety Stock, except it is a dynamic alert.
Stock Below Target Stock (DB Alert)(SAP Macro)
This logic creates an alert if the Stock on Hand is below the Target Stock Level.
- IF
- Stock on Hand Projected is < Target Stock Level AND the Target Stock Level > 0,
- THEN Update Alert with Stock on Hand Projected and Safety Stock in the Display Unit)
Stock Below Target Stock (Dyn. Alerts)(SAP Macro)
This logic is the same as the Stock Below Target Stock, except it is a dynamic alert.
Supply Shortage (DB Alert)(SAP Macro)
- IF
- Stock on Hand Projected < 0,
- THEN Generated the Alert with the Supply Shortage
Supply Shortage (Dynamic Alerts)(SAP Macro)
This logic is the same as the Supply Shortage, except it is a dynamic alert.
Target Stock Level Exceeded (DB Alert)(SAP Macro)
IF (Stock on Hand Projected > Target Stock Level, THEN Generate Alert with Stock on Hand)
Target Stock Lvl Exceeded (Dyn. Alerts)(SAP Macro)
This logic is the same as the Target Stock Lvl Exceeded, except it is a dynamic alert.
SAP Macros Which are Used as Variables
- Determine Workdays
Some macros in the Planning Book are not the primary macros that appear in the Key Figures but perform calculations, which serve as variables to be used by other macros that are primary to Key Figures. The most important of these variable macros are defined below.
Determine Workdays
This macro returns the number of days that are in a bucket. The macro makes two auxiliary rows (which are variables). These two variables are Workdays and Goods Receipt Workdays. This macro is used by the Days’ Supply macro to determine how many days are in a period. The number of days count is then used in the Day’s Supply equation.
Macros Which Control How the Planning Book Functions
- Layout Attributes Macro
At least one macro has nothing to do with calculating values that appear in the Planning Book but control the conditions under which some Key Figures can be updated by the user.
Layout Attributes Macro
This macro controls when the Production Planned Key Figure and the Purchase Requisition Key Figure can be changed. The logic is if a combination of location and product is selected, then the Production (Planned) Key Figure and Purchase Requisition Key Figure can be altered.
However, if any other selection is made (such as all locations for a product), these Key Figures cannot be changed.
Undefined SAP Macros
These following macros are in the Planning Book but are not defined here because they are not used at the client. Most of them have to do with shelf life planning.
Projected Wastage Quantity (DB Alert) Projected Wastage Quantity (Dyn Alert) Supply Shortage Shelf Life (DB Alert) Supply Shortage Shelf Life (Dyn. Alert)
SAP Macros That Are Extended Which Need to be Replaced with the Standard SAP Macros
- Days’ Supply
- Supply Shortage (DB Alert)
- Supply Shortage (Dynamic Alerts)
Key Figures Which Will be Added to the SNP Planning Book in the Future
- Forecast (actual forecast, not the unconsumed forecast)
- Open Contract (amount)
- Contract Sales Orders
- Non Contract Sales Orders
The APO Macro Builder
The Macro Builder in SAP APO is where SAP macros can be adjusted and created. The APO macro builder is difficult for people without significant experience building Macros to interpret. One reason for this is that the Macro Builder uses functions, which are not explained within the Macro Builder itself.
- For instance, when looking at the Days Supply macro, the function Cover_Cal( is used. This macro compares stock to demand to calculate how many days of supply are planned to be held for each period.
- To understand macros, it is important to have access to the functions that can be used in the macro. For SNP, these functions can be found at the link below.
The Days Supply Macro Walkthrough
After going through all of those SAP macros, now we will dive into the detail of one SAP macro.
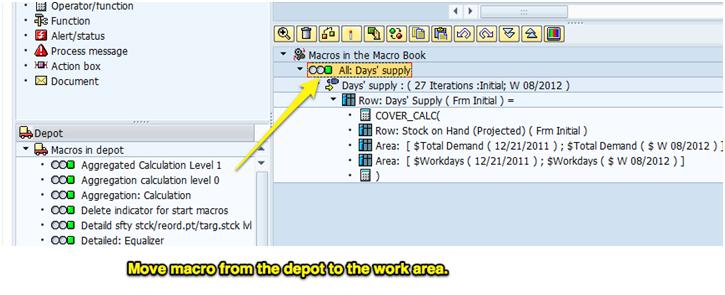
The first step is to go to the Macro Builder and then move the macro from the Macro Depot to the Macro Work area.
I have chosen this macro as it is simple and is commonly used. Many areas of functionality are actually just SAP macros. The SAP macro calculates a value, which is then stored in a key figure in the planning book.
Because this is seamless, it appears to users that the key figure is providing a value that is part of some deeper SAP APO functionality, when it is just a macro. This is an advantage, and a disadvantage as the only real way to know what is controlling a key figure in the planning book is to check the Macro Builder.
While Excel is easy to use, the Macro Builder takes a while to get used to, and its development productivity is low. That means that it takes a lot of experience to get good at it, and even experience macro builders produce less output than comparable environments given the same time.
Reference Capabilities
SAP macros do not have absolute reference capability. This means that when a macro is moved (up or down in the key figure sequence), the key figure that it was pointing to is changed, and this means that all macro calculated key figures below the adjustment must have their macros changed.
This is very different from Excel, where formulas can be moved in an unlimited fashion without causing the references to break.
“Also, it should be recognized the term “macro” is used differently here than in Excel. In Excel a macro reverts to a recording that allows Excel to replicate a series of steps. The Macro Builder should probably have been named differently, especially considering the fact that Microsoft had already essentially created the term. Microsoft’s use of the term is not correct either as its official computer science definition is “Computing a single instruction that expands automatically into a set of instructions to perform a particular task.” – Apple Dictionary.
If SAP and Microsoft had used existing terminology correctly, a macro in Excel would have been called an “instruction recording,” and SAP would have called its macro builder something like “key figure custom calculator.” Terminology that is accurate in this way has the benefit of not having to be internally translated. However, when you are a big and influential software company, you don’t have to follow any of the English language’s preexisting vocabularies and create your own make-believe set of terms. While confusing to other people, it will eventually become used. Making up one’s own terminology from scratch saves large software companies’ countless hours from using a dictionary or thesaurus.
The Macro Header
The macro header screen is shown below:
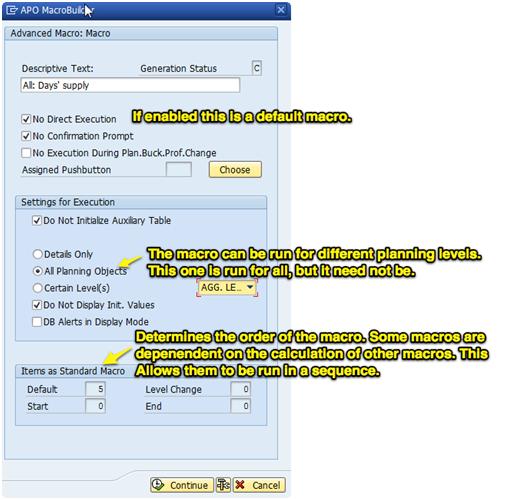
As to the third point above, several important types of macros can be created and used.
- “Default macro: Carried out whenever the forecasting screen is regenerated, such as when the planning book is opened or closed, or when the planner chooses ENTER.
- Start macro: Carried out whenever the planning book is opened.
- Level change macro: Carried out whenever the planner drills up or down in interactive forecasting.
- Exit macro: Carried out whenever the planning book is saved and closed.” – SAP Help
The most frequently used type is the Default macro. The macro type is determined above by entering a value into one of the four boxes in the Macro header screenshot above.
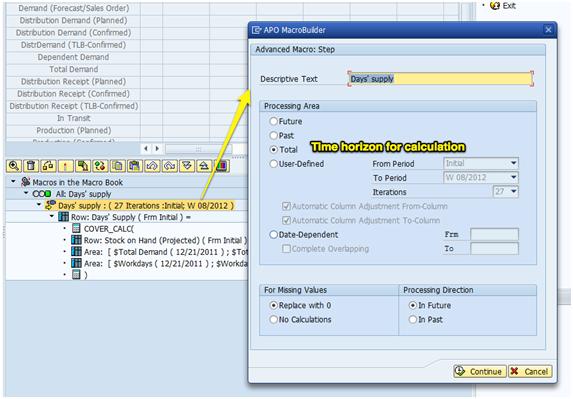
Step 1
Step 1 is a basic set of options. It provides the name and timeline over which the macro should be calculated. It also defined what to do when the value cannot be calculated (either replace with 0 or provide no value).
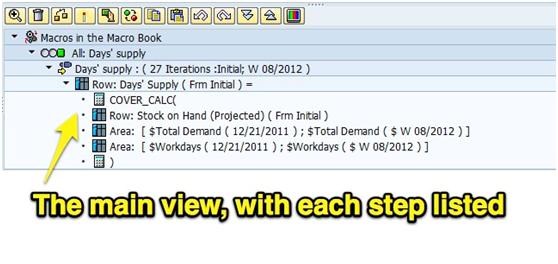
This particular macro only has one step, but on more complex macros, there can be many steps, and this is screen and object is more of a step header.
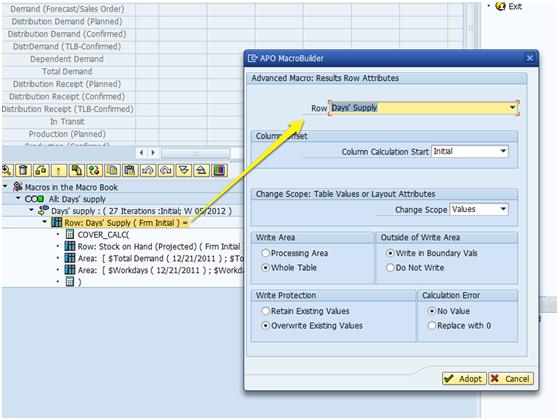
Row
Every macro applies to a row. This screen declares the row’s name or key figure as it will appear in the planning book (the planning book is shown above the macro). The column indicator controls which “columns” or timer periods the macro applies. The other settings on this screen are processing administration.
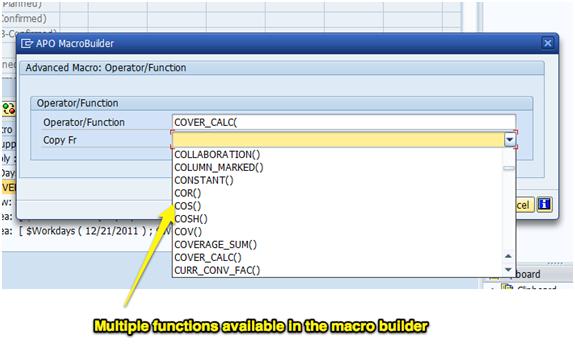
Cover Calculation and Open Parenthesis
This invokes the “cover calculation” and opens parenthesis in which the calculated values will reside.
SAP states it as follows:
They are categorized in the following way:
Mathematical Operators and Functions
Statistical Functions
Logical (Boolean) Functions
Functions for InfoObjects and Planning Books
Date Functions
General and Planning Table Functions
SNP Functions
As you can see, SNP has its own category. The COVER_CALC function is described below:
COVER_CALC(rows for stock on hand; area for demand from the next period to the end of the time period; an area containing the number of workdays; demand from the next period to the end of the time period) returns the days supply of a product by considering the current stock on hand, the total demand of subsequent time periods, and the number of workdays in this time period.
For example:
Time span w11 w12 w13 m04 m05
Total demand: 0 20,0 0 25,0 27,5
Stock level 68,7 48,7 48,7 23,7 0
Days supply 70 63 57 26 0
Workdays 7 7 7 30 31″ – SAP Help
Row Stock on Hand
This declares the row to be calculated by the macro.
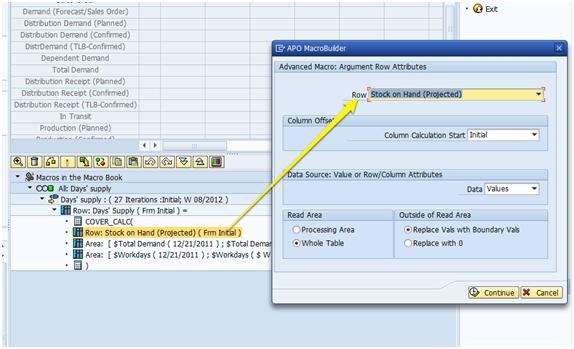
This macro simply compares the demand.
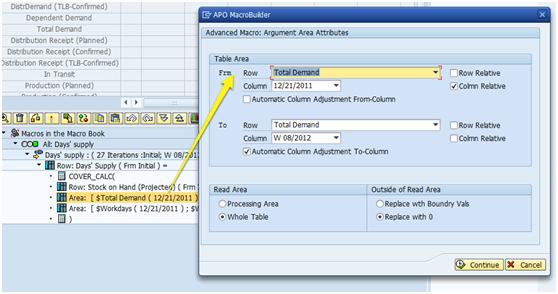
Area 1
This declares the “from row” and the “to row,” which are both the Total Demand Key Figure (actually, it’s helpful to simply consider the row synonymous with the term key figure).
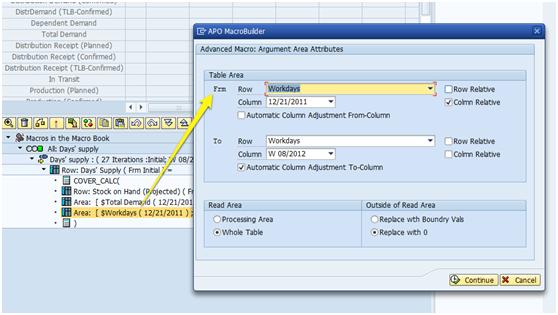
Area 2
This sets the second area as workdays.
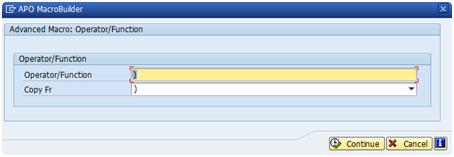
Close Parenthesis
The final part of the macro closes the parentheses, ending this step of the macro.
The Days Supply macro is one of the most commonly employed on SNP projects. It allows planners to understand if the stocking level is within appropriate boundaries and is a good way to diagnose the system output. It is also entirely the result of the macro, which was described in this post.
Where The SNP Functions are Listed
For instance, in the standard Days, the Supply macro, shown in this article, uses the Cover_Cal( function as the macro’s primary function. Full details exist at the link provided above. However, it is tough to understand can take an hour to interpret fully. All the definitions are like this in SAP and need to be translated into standard English. In fact, I worked on a project where the client created definitions of each standard SAP macro and custom macro that they use. This is a good decision because the Macros themselves are difficult to understand.
“This returns the days supply of a product by considering the current stock on hand, the total demand of subsequent time periods, and the number of workdays in this time period.” – SAP Help
Operators
In addition to functions, the Macro Builder can add operators. As with functions, these are added to the Macro Builder with the operator/function icon.
https://help.sap.com/saphelp_scm50/helpdata/en/f3/852d3af6ecd02ae10000000a114084/content.htm
These operators are listed below:
https://help.sap.com/saphelp_scm50/helpdata/en/1d/310ea4d0ee11d4b2e40050da385632/content.htm
Some of them are exactly as one would expect. However, one which is not intuitive is the “;” which is a separation between arguments. Overall the operators are very deep in functionality. In addition to mathematical operators, SAP has several other types, including statistical.
https://help.sap.com/saphelp_scm50/helpdata/en/1d/310ea7d0ee11d4b2e40050da385632/content.htm
There are standard forecast error calculations within the statistical operators, including MAD, MAPE, and MSE.
Boolean functions allow for coding like capabilities are listed here.
https://help.sap.com/saphelp_scm50/helpdata/en/1d/310eaad0ee11d4b2e40050da385632/content.htm
The number of functions and operators is quite overwhelming, and after reviewing them, it seems that most any calculation is possible within a macro. The functions could be documented more clearly, but the documentation in the links listed in this post is very extensive.
The Necessity of Documenting SAP Macros
Documenting Macros should be documented because macros are difficult to interpret. This is due to the interface design of the APO Macro Builder. For those familiar with expression building in Excel or Mat Lab, the macro logic is simply much harder to follow. Documenting Macros is necessary for explaining the macro to users and business leaders and the APO consultant as opening up and reading the APO Macro Builder requires interpretation every time it is done. On the other hand, once macros are interpreted into plain English, they are easy to understand.
To improve the understanding of these macros, we have them extensively described in this post.
Conclusion
Macros have deep functionality on functions and operators. While the Macro Builder is not intuitive or easy to understand, already build macros, with research into the SAP documentation, they can eventually be figured out.