How to Understand SAP APO and ROI and The Problems with ROI Calculation
Executive Summary
- APO has a difficult time showing an ROI.
- In this article, we will review how ROI for APO can be calculated.
Video Introduction: How to Understand SAP APO and ROI and The Problems with ROI Calculation
Text Introduction (Skip if You Watched the Video)
When evaluating the decision to implement a new SAP APO application, the most compelling argument for executives is the implementation’s financial benefit. Determining this isn’t as simple as it may appear at first glance because, as with most analyses, everything rests on the assumptions. Companies that purchased and implemented SAP APO have had great difficulty in obtaining an ROI from APO. You will learn how we estimate the ROI for SAP APO the important supporting assumptions, as well as the major problem with ROI estimation, which is the individual or entity that is charged with performing the ROI estimate.
The Challenge of Obtaining ROI from APO
The challenge is digging into a level of detail on the SAP APO products. For instance, if a particular application can reduce inventory costs by a certain percentage, what is the likelihood that the company will attain this improvement level? What specific functionality within the SAP APO application will bring about this improvement? Have other companies obtained a similar improvement?
And if so, how was this improvement quantified?
By asking and answering these types of questions, a detailed financial analysis of the implementation of different SAP APO applications can be a truly beneficial exercise.
Return on Investment (ROI)
ROI has become a prevalent driver in estimating the potential and actual financial impact of major system implementations. ROI is a standard practice in mergers and acquisitions and decisions to purchase major pieces of equipment for manufacturing and distribution companies. But its use to justify software acquisition is significantly less understood and less straightforward. In fact, operational and financial practitioners often don’t readily accept the use of ROI as a budget justification in software acquisition, even though it’s considered standard practice to purchase other capital expenditures. For those companies that do seek to evaluate their ROI, there are two main parts:
- Projected benefits
- Projected costs
Benefits
While costs are relatively easy to estimate, the real issue is the estimation of the benefits. For instance, in a new assembly line, knowing the throughput from technical specifications presents a clear-cut way to calculate the positive potential impact. This isn’t the case with software, however. In the software sales process, the industry relies heavily on benchmarking data. For example, you may have heard the following statement: An increase in customer service level by 1% will translate into a 5-10% increase in your revenue. This statement may sound reasonable, but the problem is that it’s based on the following:
- It depends on the market share and competitive position of the company in question. A direct relationship can’t be assumed but rather depends on several factors such as the current size of the company’s market share, customer base’s preferences base, and so on.
- Service level is directly related to a company’s sales only when it operates in a more competitive market and lacks significant monopoly power.
- The number itself (5-10% in our example) is challenging to verify. While this may sound “right,” these numbers may have been obtained based on a sample that doesn’t represent the company in question or your particular market situation (e.g., company size, level of product line maturity, degree of demand elasticity,… the list goes on and on).
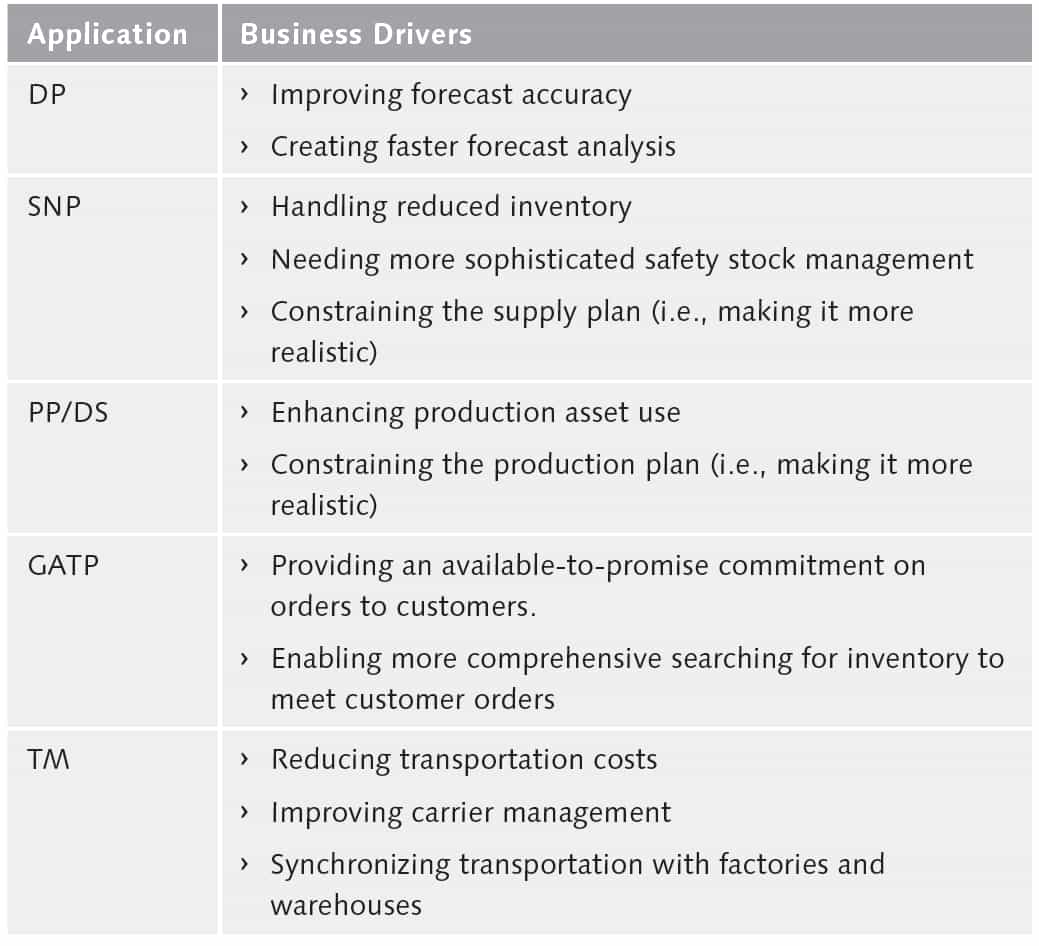
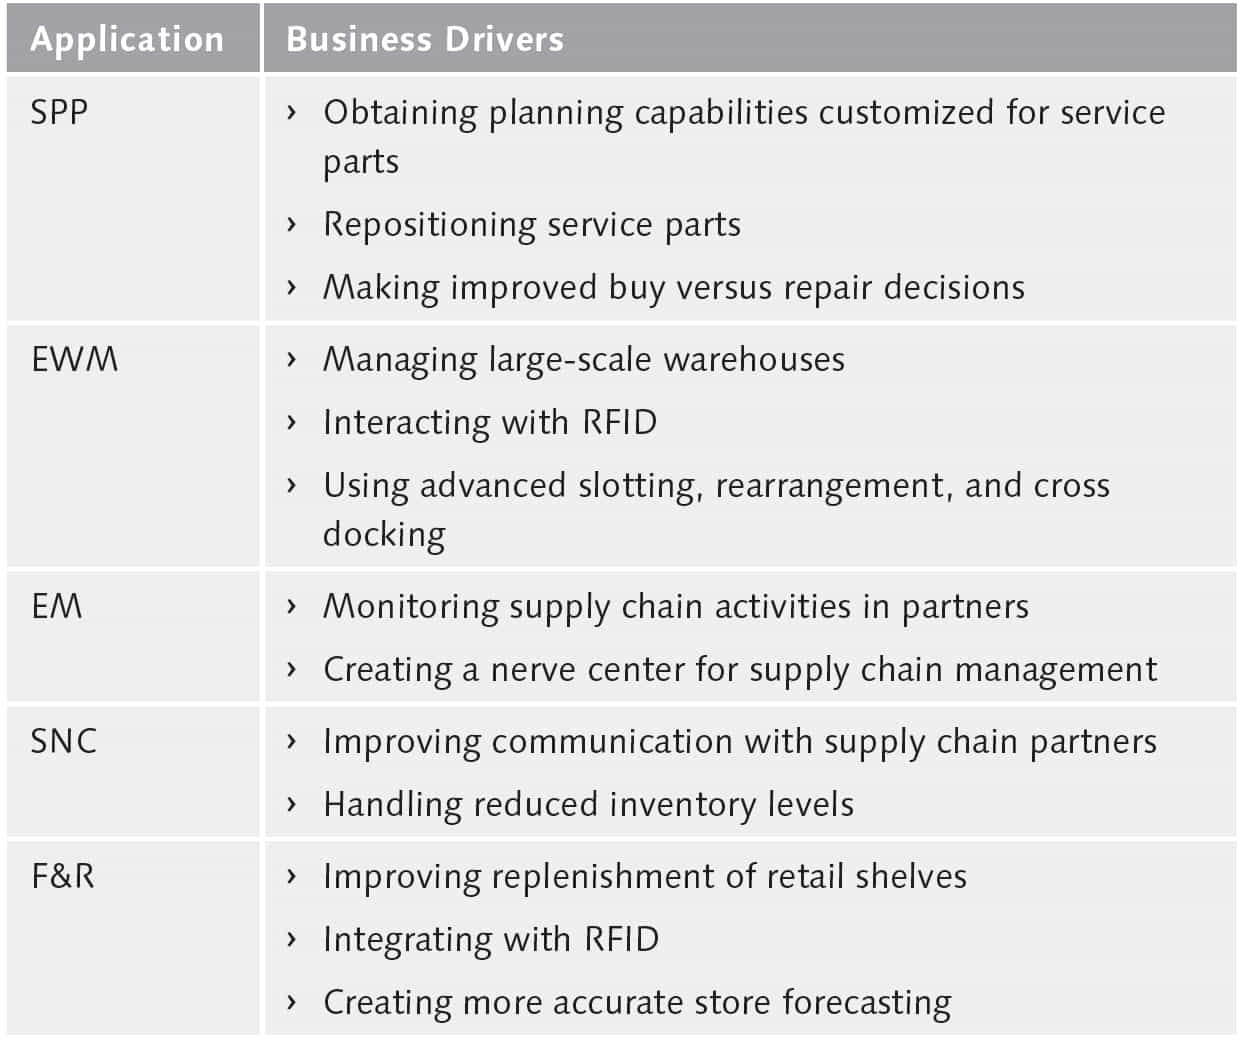
How to Understand the Business Value of APO Implementation
There are often key business drivers that lead a company to implement one of the SAP APO applications. The following table summarizes a list of the business drivers that have inspired companies to turn to SAP APO. This list is by no means comprehensive, but it gives you an idea of some of the reasons.
Improvements in Sales
When a company has a higher availability of finished goods or service parts, it loses fewer sales, and as it improves its reputation, it tends to take sales from other firms. Overall, SAP APO is designed to improve the availability of the company’s product. For instance, Demand Planning (DP) can improve the forecast, putting the company in a better position to meet future demand. SAP Forecasting and Replenishment (F&R) can improve the retail store’s in-stock position, resulting in fewer lost sales. And Global Available to Promise (GATP) specifically communicates the future availability of goods to customers. Companies that can make reliable commitments into the future regarding their product availability also gain more business, generally speaking, than those that don’t. This type of benefit is difficult to quantify because it depends on some of the following factors:
- The current stock and commitment capability of the company.
- The competition in the industry.
- The buying relationships between the company and its customers.
Sustainable Improvement?
Another key component of software-based ROI is the assumption that whatever improvement has been achieved is sustainable, but this isn’t always the case. You also need to understand that it’s not automatic to have an appropriate appreciation for the complexities involved with system adoption and system lifecycle management. The following are some of the reasons why software improvements are not always sustainable:
- As we pointed out previously, systems don’t go live and immediately reach the top level of usage by users. People don’t become experts in Excel or PowerPoint the day they buy and install the software on their computers. Rather, the system goes through a period of trial and error and learning. Some systems, and consumer software applications, are eventually adopted and rely on applications, but others don’t. Success is never assured.
- Business and market situations never stay the same; they evolve multi-directionally. This brings an additional component into the benefit estimate: the quality of the SAP ERP implementation and how well it addresses the current and future situation.
- The quality of implementations varies significantly. Stories of disastrous experiences of companies going through multimillion-dollar initiatives aren’t uncommon.
- Some implementations begin well, but ill-advised changes are made to the configuration, or the system “drifts” from its original design, causing the value of the system to decline. On the other side, some implementations are mis-designed from the beginning. But through diagnosis and adjustments, they are eventually made effective, improving the value of the implementation to the company.
Finally, the part of the ROI benefit calculation most open to a challenge is the link between operational improvements, especially the financial results of forecast accuracy increase and increase in inventory visibility across the enterprise. As noted earlier, the use of benchmarking is most commonly employed in benefit calculations. However, the applicability of a given benchmark is a serious question (due to the sample on which the benchmark was based), as are the specifics of the current market segment (in which the company operates). This doesn’t mean that the ROI calculation for a large software implementation is a futile exercise. However, ROI estimation requires a significant amount of thought and analysis specific to the company’s particular business situation and how this situation will evolve in the future to be truly effective.
Costs
The cost side of ROI is far simpler, although it also has its caveats. While there are some very straightforward cost components, such as license and maintenance fees, SAP ERP implementations contain many costs that are either “hidden” or don’t have a constant nature. First, the costs of implementing a new system must be separated from upgrading an existing one. Typically, labor dominates both of these initiatives; according to Forrester Research, labor constitutes only 65% of the total cost for implementation versus 76% for upgrades. Second, there is a difference between what a company intended to implement and what a company actually implements. This is due to an almost inevitable product footprint extension, which is a well-documented issue in system implementations generally.
Third, companies frequently underestimate their internal support costs. With a new system, a need for a new set of skills becomes mandatory. A major SAP ERP implementation almost always leads to a headcount increase in both operations (due to a rising need for people who know how to effectively use new technology, so-called “super users”) as well as information technology support. Strangely enough, this relatively simple fact is almost always underestimated. The following is a list of the areas that may be positively affected due to an SAP APO implementation:
- Inventory management
- Reduction in transportation expense
- Reduction in labor cost
- Reduction in direct material cost
- Reduction in indirect material cost
- Reduction in selling expense
- Reduction in procurement expense
- Increase in R&D efficiency
- Increase in use of fixed assets
- Improvement in gross margin
- Increase in incremental revenue from increases in values
- Key financial ratios
These value areas may be impacted as a result of operational improvement in multiple functional areas. Depending on the situation and surrounding circumstances, all, some, or only one of these value areas may be influencing the ROI estimation. Therefore, one must do a comprehensive, forward-looking analysis to determine the true financial impact on ROI and its sources. Let’s describe some areas (as they pertain to benefit generation) in more detail. We’ll address several of these improvement areas that can be tracked to specific applications next.
Inventory Management
You can achieve inventory improvements usingSAP APO’s various applications, including SAP DP, SNP, SNC, and SPP. SAP Demand Planning (DP) can improve your forecast’s quality, ensuring that your “targets“ are being planned to as high a likelihood of being consumed by demand as possible. Supply Network Planning (SNP) takes inventory positions throughout the entire network into account when making procurement, movement, and sometimes production decisions. Its safety stock functionality can help protect the in-stock position with minimal inventory adjusting to the supply chain. Also, SAP Supplier Network Collaboration (SAP SNC) reduces inventory by improving the system’s visibility between supply chain partners. This transparency results in fewer inventory mistakes.
And Service Parts Planning (SPP) can redistribute parts in the field. At the same time, this increases the costs of planned transportation, decreases the costs of expedited transportation, and increases inventory use. Generally, SAP APO helps establish realistic schedules for production procurement and consistent priorities so that everyone knows the most important job to work on at all times. Visibility of future requirements helps production and procurement prepare for high-level capacity problems and help suppliers anticipate and meet these needs. As changes to demands or supplies occur, SAP APO helps identify the impact on production and purchasing.
Labor Costs
In warehousing, SAP Extended Warehouse Management (EWM) can increase labor use, reduce the need to put away material through the use of cross docking, and better balance work levels to mean less overtime and higher use of the labor in the warehouse. Better visibility and more powerful tools for planning result in fewer planners and less time spent expediting orders. Additionally, Production Planning and Detailed Scheduling (PP/DS) improves production personnel’s use by allocating them to make products that have a high likelihood of being consumed quickly and not sitting in inventory. SAP APO’s overall planning functionality can improve employees’ and contractors’ likelihood of working on the right things. In terms of the groups performing the planning, controlling, and monitoring, SAP APO can improve these groups’ efficiency, freeing up resources for other tasks.
Transportation Costs
The transportation improvements can be direct and indirect. Indirectly, SNP better manages the network, resulting in fewer expedited shipments and more effective management of material in the fields. SAP TM means more efficiently scheduled and loaded trucks, resulting in fewer loads and lower direct transportation costs. Effective bid and carrier management can also result in lower indirect transportation costs by selecting better alternatives. Analyzing transportation history can help reduce costs by outsourcing geographic areas that aren’t serviced in a cost-effective manner internally.
SAP Extended Warehouse Management (SAP EWM) can improve the warehouse’s productivity, which allows for more efficient processing of vehicles and improves their turnaround times. SAP EWM’s yard management functionality also allows it to manage the yard better and reduce the amount of time that vehicles sit in the yard. Also, SAP Event Management (SAP EM) keeps planners up to date on materials in various transportation stages throughout the supply network. This allows them to see if the material will arrive on time or whether they need to expedite other material or perform other adjustments to meet the schedule. Key Financial Ratios Ratio analysis provides another way to look at the impact of an SAP ERP system. Three ratios illustrate the effect — two related to liquidity and one to operating performance:
- Inventory turnover (Cost of Sales/Inventory). Low inventory turnover can indicate possible overstocking and obsolescence. It may also indicate deeper problems of too much of the wrong kind of inventory, creating shortages of needed inventory for production and sales. High turnover indicates better liquidity and superior materials management and merchandising.
- Days of Receivables (365 * 1/(Sales/Receivables)). This ratio expresses the average time in days that receivables are outstanding. It’s a measure of the management of credit and collections. Generally, the greater the number of days outstanding, the greater the probability of delinquencies in accounts receivable. The lower the number of days, the greater the cash availability. With an 18% reduction in receivables, one can reduce the current days of receivable of 73 days to 60. This means $356,200 is available for other purposes.
- Return on Assets (Profit Before Taxes/Total Assets). This ratio measures the effectiveness of management in employing the resources available to it. Several calculations are necessary to determine the return on assets.
Let’s say for a $10 million company, the current number of inventory turns is 2.5. With a 20% inventory reduction, the number of inventory turns increases to 3.1. It’s important to be wary of inventory turnover increase without maintaining the existing level of customer service. Should your service level go down, an increase in inventory turnover would signify your increase in out-of-stock situations.
Obviously, many other benefits can result from a successful SAP APO implementation, as we mentioned earlier. But each implementation is different so that each company will benefit differently. Regardless of the benefits you reap. However, you’ll need a solid method for calculating the ROI from these benefits.
ROI Estimation Recommendations
In this section, we’ll look at some recommendations for you to consider when addressing the complexity and ambiguity of ROI calculations for major SAP APO implementations:
- Determine the most likely areas for operational improvement.
- Ascertain the way to translate operational improvements into financial results.
- Validate projected operational improvement ranges with a high level but comprehensive analysis.
- Calculate the relevant financial bottom-line impact by value area.
- Adjust calculations made in number 4 to reflect: –– Company’s competitive situation –– Company’s specific situation for a given value area –– Company’s size –– Company’s operational and distribution model
- Address the time phasing of the benefits.
- Separate one-time impacts from recurring benefits. Be careful not to double count.
- Address the sustainability of benefits.
- Execute benefit sensitivity analysis, including sensitivity to macroeconomic factors.
- Optionally disregard certain benefits based on anticipated financial impact and complexity of execution.
- Finalize the solution footprint and implementation cost. Make sure that you allow for contingencies in both labor and time.
How is the ROI for SAP APO different from ROI for SAP ERP or other supply chain software? There are some similarities in the ROI within SAP ERP, SAP SAPO, and non-SAP solutions because three of the four SAP ERP applications directly impact the supply chain. But because SAP APO has more advanced functionality, there are opportunities for more benefits. However, one of the major benefits from SAP ERP is the integrated nature of the data that the applications provide between financial information and supply chain information. These are not factors added to the ROI of SAP APO.
ROI Estimation: Managing the Process
Knowing the right categories of costs and benefits to look for is only one part of the process. This is the content portion of the endeavor, but there’s a lot more to it. Just as important as what is looked at is how it’s looked at and who is looking. Now let’s point out some important considerations that, if followed, can greatly improve the quality of the SAP APO implementation value estimate from the business, IT, and finance teams, as well as those with expertise in SAP APO, should be involved in the evaluation. ROI development is multidisciplinary, and only an informed team can develop a realistic ROI value with a high predictive capability.
Selecting the Right People
Finally, while it’s not an industry practice currently, the ROI estimation should not be developed by the firm that would receive the implementation work or the software company (in this case, SAP) due to conflicts of interest. Rather, the financial analysis should be performed either by the company itself or by a consulting company that isn’t in line to receive the implementation work. This issue is often passed over as unimportant, but the need to prevent bias from entering the ROI analysis should be rather obvious.
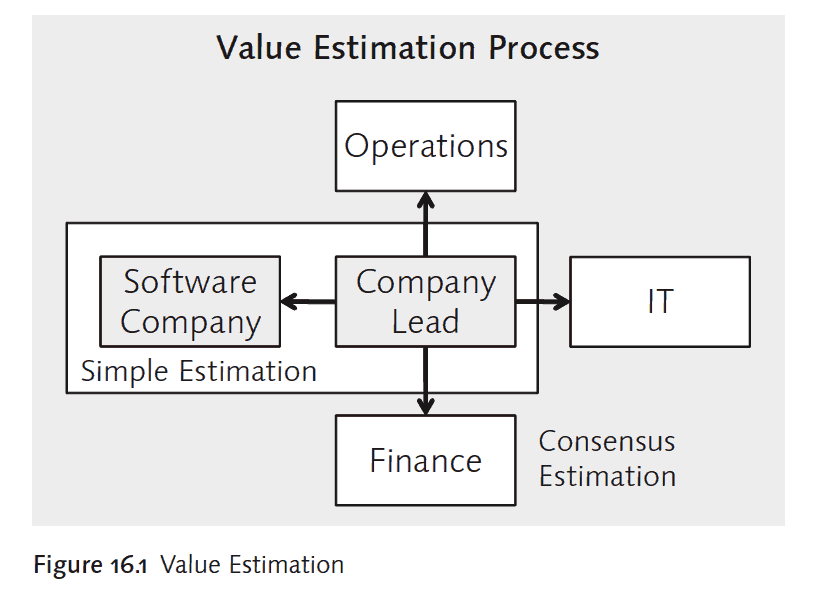
Many companies may tout their experience in performing these types of analysis, and both software companies and consulting companies indeed have groups that specialize in this type of analysis. However, in this case, the experience is inferior to objectivity. When the consulting or software company leads the analysis, the estimate will almost always be too high. Secondly, there’s no reason these skills can’t be leveraged by having the company lead the analysis with the software or consulting resources supports. Optimally, the final decision making on the value estimate needs to reside with the company and not the consulting or software company. The lead selected for this role must be sufficiently experienced, capable, and preferably have significant exposure to consulting and software companies, and may even have worked for them. If this type of person can’t be made available, plenty of independent contractors will jump at the opportunity to take on this role. Preferably, this contractor won’t have preexisting personal relationships with either the software or consulting resources on the team. Good value estimation is a bit like collaborative forecasting to borrow an analogy from the SAP APO application. The more groups that are actually on the team, the more realistic the value estimate will generally be. Software and consulting companies want to dominate the process, but as the company makes the purchase decision, the company needs to control the estimation process. The best way to do this is to control the team member assignments and set strict rules governing the contributory role and the final decision-making role (Figure 16.1).
Allowing Enough Time
Based on past experience, the amount of time needed varies depending on whether the team is predominantly internal or external or a mix. This is particularly true if the entire estimation team is external to the company. Here the consultants need to get up to speed on the company before they can effectively work on the value estimate. These duration projects are typically filled with many unexamined assumptions.
Don’t Overemphasize Finance
Finance professionals are integral to developing value estimations because they quantify both costs and benefits. However, there’s a tendency in value estimation projects for finance to begin developing models before assumptions are checked. Benefits that financial resources may readily accept may not be considered valid by a representative from the business. This is one of the reasons for the multidisciplinary team. It can be frustrating for finance: When asked whether a particular functionality will increase benefits or reduce costs a certain amount, the response of the person from the business will often be, “It depends.” But while this may be frustrating, the reality is often complicated. The entire value estimation is based on assumptions. It’s really the job of the business to double check the assumptions that end up being quantified, particularly with regards to benefits. IT normally evaluates the assumptions regarding hardware and maintenance costs. The software company provides licensing and consulting costs, and the consulting partner is on the hook for implementation costs. Finance can’t evaluate these assumptions by themselves because they lack content knowledge.
Assign a Data Expert to the Team
Value assessments require data pulled from production systems to provide support for the final ROI number. This is one excellent reason why they can’t be completed in two weeks. The data requests should be submitted far in advance of need because they aren’t mission critical and tend to fall in the queue as more urgent data requests supersede them. For this reason, a resource who knows the ins and outs of the data infrastructure organizations in the company should be assigned part-time to the team. This person’s responsibilities are primarily at the beginning of the project. However, it’s helpful to have them at the final presentation, as questions of assumptions often lead to data questions, which this resource can often answer.
Consider a Range or Sensitivity Analysis
The issue with providing a single ROI value is that it gives a bit of a false impression regarding the value’s certainty. As a value assessment progresses, the team gradually selects some assumptions over others. The combination of all of the selected assumptions ends up being the ROI. However, providing different values based on different assumptions can help bring a higher level of reality to the process. It can also help bring in people who were not part of the value estimation process into the discussion during the presentation. Meeting participants can then begin to understand the analysis more fully and agree or disagree with it. If the presentation were just about presenting one ROI value, it could be accomplished by email. The presentation should be focused on presenting the analysis, and this means the different considered options. Make the Assumptions Transparent. The following are two sentences that you don’t want to hear during a value estimation presentation:
- “We think these estimates are conservative.”
- “Everything you’re asking about is in the appendix.”
Both of these statements give a strong indication that information isn’t being shared freely. We’ve been in many presentations and on the presenting side when these exact statements have been made, and there has never been a legitimate reason for it. These statements are designed to prevent questioners from going where the presenters don’t want the questioner to go. When these types of statements are made, one can quickly put them to a stop if the most senior person in the room declares, “That isn’t the way we’re conducting this meeting.” If the company lead is giving the presentation, there is far less likelihood of this happening in the first place. The Calculations Building on the point of transparency in the previous section, something we haven’t seen but think should be done, is to provide copies of the actual ROI spreadsheet to the meeting participants. Letting the participants manipulate the values themselves brings them into the process, makes the variable nature of the analysis more transparent, and helps enhance understanding.
How to Set Up and Run the Value Presentation Meeting
In our experience, the value estimation presentation is far too formal. The presenters, who often are consulting or software company reps, intend to make a big impression. Theater doesn’t have a role in logical decision making. This is where having the company lead managing the presentation really pays off. For someone who has a stable job at the company and isn’t being compensated for whether the software is implemented, they probably won’t care what the value estimate ends up being. That is exactly who you want to lead the presentation. It’s unnecessary for anyone but the lead to present because he has made the value’s final determination. Allowing the software or consulting company reps to stand up and present during this meeting can often lead to dilution of the company lead’s message. Smart companies will not send the lead mixed messages; they will give them the authority to manage the process from beginning to end, which means the final presentation as well. After the presentation is complete, a general question-and-answer session usually follows. Now is the time for other team members to offer their views.
However, no assumption should be off the table from review or analysis, and the team members need to show up with all of their supporting data and conclusions. If they are not ready to do this, the meeting must be postponed. Also, difficult questions shouldn’t be pushed off or evaluated in private. This means a sufficient amount of time needs to be scheduled for the meeting. Two hours is fine; even three hours is warranted for complex software decisions and perfectly acceptable given the importance of the company’s decisions. There is some debate about whether people can stay at a high level of engagement for more than three hours, which seems like a good upper limit for a meeting like this. The goal should be to come out of the meeting with a decision on whether to recommend that the implementation go forward. In our experience, if the assumptions are not evaluated in that meeting, they generally won’t be.
ROI Presentations in Different Countries
The process just described will lead to the minimization of bias and the most objective ROI estimation results. We don’t think that every company will necessarily attain this state because it’s not the way most ROI analyses are done, and it takes more than one book to make people aware that a practice has logical errors in it. Additionally, different cultures will have different interests in implementing this process. The more hierarchical the culture, the less likely this model will be implemented. We can’t know how every company within every country will respond to the process we have described; we have simply described a process that will result in high-quality output.
Conclusion
ROI is exceedingly difficult to calculate. This article has attempted to lay out how it can be done, but the problem is that in nearly all cases the entity that is charged with calculating ROI has a financial bias to increase the ROI value. If this first point is not addressed, then none of the following points about software ROI matter. In nearly all cases, APO will have a negative ROI. Furthermore, for everything that SAP APO does, of what each of the modules does, there are far more cost-effective and better quality alternatives.