How to Perform Service Parts MTBF Calculation and Forecasting
Executive Summary
- MTBF or mean time between failure is how service parts are forecasted.
- Service parts demand can use dependent department.
- It is not that common for companies to use MTBF.

Introduction to MTBF
Service parts for products can be predicted based upon installed base and usage.
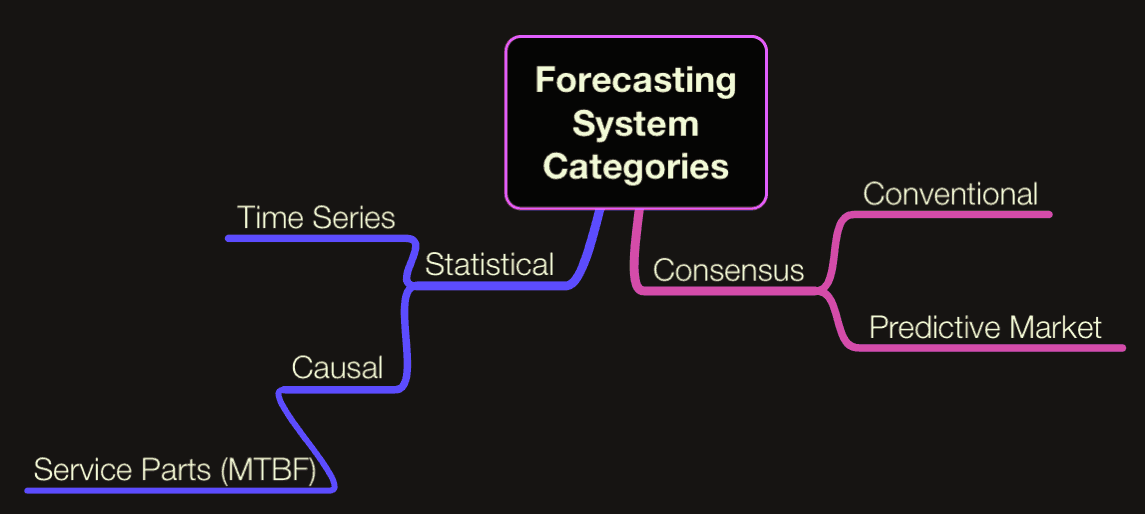
The mean time between failure or MTBF calculation or forecasting is a subset of causal forecasting.
This is seen in the graphic below.
MTBF Calculation and Dependent Demand
All service part demand is dependent on demand. That is, the need for service parts is based upon purchases that have already been made.
Service parts can be forecasted using simple demand history, as with finished goods, or they can take advantage of the installed based and usage of the equipment that is in the field.
For some things, just the population information is available (population information is, of course, much easier to attain. only large and expensive equipment like airplanes or construction and heavy industrial equipment has the usage tracked.)
The bigger and more valuable the asset, the easier it will be to get usage information. And the easier it will be to perform MTBF calculation. But even aerospace and defense are known to a shortage of good MTBF data.
However, usage data would not be available for many consumer items.
How Does the MTBF Mean Time Between Failure Fit In?
MTBF is one particular modality of causal forecasting. Most causal forecasting uses one or many independent variables to predict the future dependent variable. However, causal forecasting with MTBF in service parts uses a developed failure rate for them in the field item.
MTBF of 6 months for the service part to be forecasted
100 Serviceable Items in the Field
100 x (12 Months/6 Months) =
200 Service Parts (forecast)
This is a simple example, but it captures how MTBF prediction works.
Combining Mean Time Between Failure and Other Methods
Often the different prediction categories are thought of as only being used independently. If you one for a product or group of goods, you cannot also use another. MCA Solutions allows you to use both a time series and an MTBF calculation or forecast. They call this the composite forecast, and this forecast can give different weights to each forecast type. For instance, you could weigh the MTBF at 70% and the time series forecast at 30% or any other set of percentages that you wanted.
Prevalence of MTBF Data and the Usage of This Type of Forecasting
Many companies talk about forecasting using the mean time between failure data, but few of them are interested in doing the work to maintain the data. What is unfortunate here is that the data is not that difficult to manage.
There is not one level of granularity that companies have to drive to use causal methods. They can get benefits from using just a basic high-level value of their installed base. This should be available for even consumer items by taking previous sales data and applying degeneration percentages (for items that fall out of service) to develop a basic installed base number. Once this number is attained, it can be used for the mean time between failure calculation or forecasting.
Part Breakage Prediction Math
Some basic mathematical estimation can get companies close to real values. Once these basic installed base numbers are generated, it opens a new opportunity to manage the service forecasting process differently.
It would be nice to report that the causal method is only underused in service organizations. However, this is not the case. It also extends to most supply chain organizations. See this article for details.
How to Get Public MTTR, MTTR Statistics for Hard Drives
It is unusual for companies to maintain causal information (such as aircraft landings or installed base) that could be used to perform causal forecasting. After the hard drive in our iMac went out, I searched for the most reliable model to replace it with.
We learned that MTTF (mean time to failure), MTTR (mean time to repair) figures are not available for even the most commonly purchased item by companies and by individuals. Mean time between failure, mean time to failure, and mean time to repair are the service industry’s standard terms.
Meantime to failure and mean time to repair are the terms used to describe the same thing. This is the length of time between the failure of a part or component on a product. This is, of course, an estimate and is provided by the engineering department of the company that manufactures the item.
Meantime to Failure Service Parts Forecasting
Two pieces of data are necessary to perform causal forecasting for service parts, which is critical for service parts planning:
- MTTF, MRRT of the causal value
- Installed base or other causal value
With just the MTTF, consumers and organizations can make informed purchase decisions. However, with both these values, companies can use service parts planning software to drive our forecast and stocking.
At this point, it is well-known that the official MTTF statistics published by vendors are unreliable and pure fantasy. Because there is no objective third-party that does drive comparisons across vendors and publishes the results, there is no reliable source for failure information (if anyone knows of one, please comment on this post).
Although I know that companies, especially companies that purchase and deploy disk scores, may keep their individual statistics. When asked questions about this topic, the vendor spokesperson moved into a doublespeak degree that would make Henry Kissinger green with envy.
Where are the Studies on MTTF or MTTR for Hard Disks?
According to a white paper by Wiebetech – a drive enclosure maker, Manufacturers are reluctant to give out real-world statistical information.
All drive vendors do what they can to obscure any differences between their drives regarding the quality or MTTF or MTTR. This allows them to compete by retail box design and marketing and personal business-to-business relationships, which appears to be their preference. A quote from a recent article on this topic in PC World reinforces how much OEMs like to dance around the issue of reliability and failure. Several drive vendors declined to be interviewed.
“The conditions that surround true drive failures are complicated and require a detailed failure analysis to determine what the failure mechanisms were.”
..said a spokesperson for Seagate Technology in Scotts Valley, Calif., in an e-mail.
“It is important to not only understand the kind of drive being used, but the system or environment in which it was placed and its workload.”
This is hilarious.
Hard drives are the only thing for which MTBF statistics cannot be developed. Interestingly, companies like Google or any company with many servers have this information because they have many drives and their drives fail as time passes. As they are all in servers in the same building, the usage is similar and therefore comparable.
Vendor Studies on MTTF and MTTR from Russia
One of the few vendor studies on the failure rate of hard drives was performed by a Russian company.
This image shows the most reliable drives with Hitachi leading all producers.
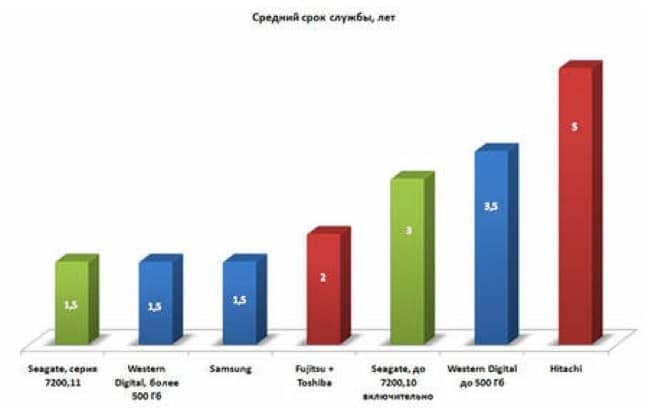
The drives I use most often are by Western Digital, but, interestingly, I can expect around 3.5 years of life from them, which squares with my experience after owning many Western Digital drives. This statement is of great interest, as it cautions against buying very high-capacity drives.
The remaining 41% exceeded 500 GB. Due to their construction and additional platters, these larger models are less durable, exhibiting an average lifespan of only 1.5 years. – Tom’s Hardware
The Costs of Publishing the Truth
It’s easy to publish positive information about vendors. But a massive headache to release negative information, and vendors consider the meantime to failure and the meantime to repair as negative information.
I know. I tested backup software several years ago and published my results online. My general finding was that PC backup software was very unreliable and difficult to use. Also, Norton Ghost, but in particular Acronis True Image, never actually recovered a computer image correctly after ten attempts. After publishing this, I was contacted by a representative from Acronis, who told us I did not know the software and that my findings were wrong. They then offered to send us the newest software,….which I took a lot of time to test…and which also failed. Publishing negative information like this, if you make advertising, is even more challenging. This is one of the reasons so few companies do it. CNET will publish on the different merits of products but won’t touch the reliability issue, nor will 98% of other publications.
Consumer Reports is one of the few that does. While their publication is a trailblazer in reliability studies, they have to have a legal team ready because they are often sued. However, they do not publish at the level of detail of MTTR or other failure statistics. Something more is needed.
Planned Obsolescence and Why Items Are Becoming Less Serviceable
There is not much I own that I like better than our 24 inch iMac, but my sudden understanding of its core un-serviceability has been a real disappointment. iMacs are not the only things with lower serviceability.
What You Learn When Your iMac Goes Breaks
We recently had the hard drive in our iMac go out.
PC World recently wrote an interesting article on drive reliability. This article reinforces what we have experienced first hand — the MTBF numbers produced by drive manufacturers are false. Carnegie Mellon’s lack of differentiation among vendors in this study indicates their research was likely polluted by vendor pressure and contributions.
What we learned is that iMacs are not designed to be serviced by users. The iMac design looks great but has a strange assembly that makes it even harder to work on than a laptop. The iMac has no screws or other fasteners on the case (except on the bottom for memory replacement). A hard drive is a major sub-component in a computer and tends to be more problematic. It should not only be designed to be easily replaced but should be designed to be swappable. As with media like CDs, there is no reason a door could not be added to any computer. Different hard drives could be added and removed to give the user maximum flexibility in booting to different disks. This would mean that no computer could be brought down with a spare disk due to driving failure.
No personal computer makes it as easy as we think it should be. Apple has designed a case with no entry through the back. So the user or service technician must pull off the glass cover with a suction cup and remove the display (delicately) to expose the screen. Next, the display must be removed to reveal the hard drive. Several specialized tools are required for the task. Waiting for tools to arrive from eBay, as well as the Apple Store’s $420 quote for the work, is why our iMac is sitting unused at the time of the writing of this article.
The Long Term Trend in Planned Obsolescence
This is part of a long-term trend in consumer items to hide the fasteners to increase the “coolness factor.” This trend extends to some different categories. If one looks back to the cars of the 1930s, one can see that they were more modular, and the rivets, pins, screws, and other fasteners were more apparent. What this meant was that cars had higher serviceability.

The Bentley Speed Six was a very serviceable car. The engine was easy to get to, the fenders were easily replaceable, and the exposed fasteners allowed the replacement of many parts by shade tree mechanics.
By the 1950s, almost all cars had moved to integrate the trunk and fenders into the body, and fasteners were no longer observable from the outside. This resulted in a smoother look and a more complicated design, and a more expensive automobile to work on.
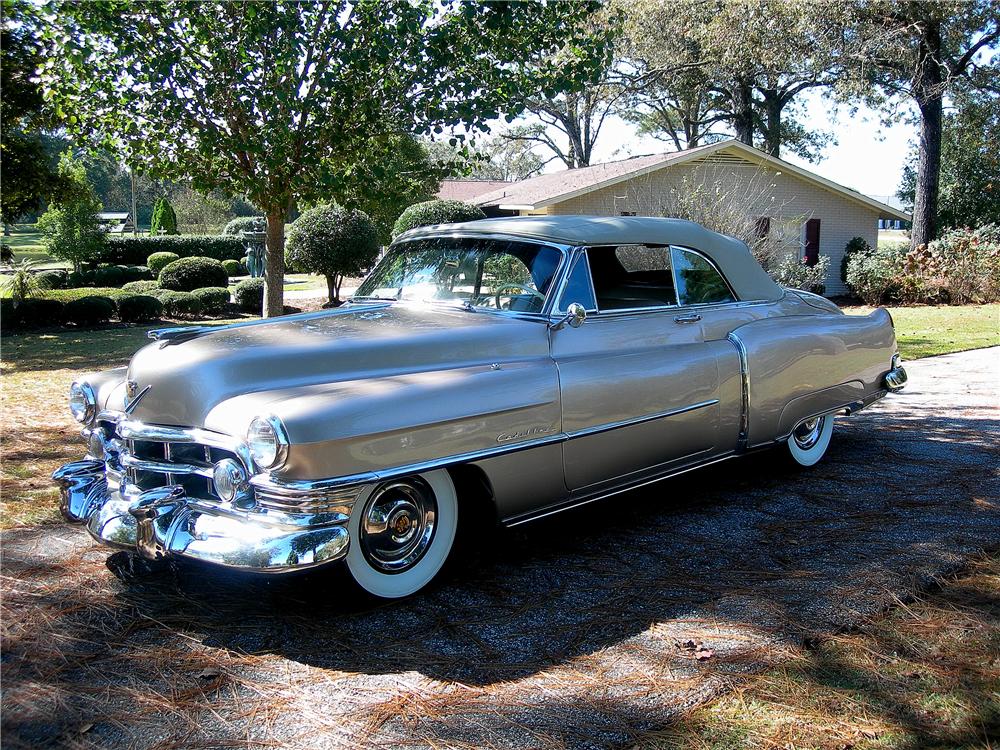
The 1950s Cadillac Series 62 was representative of cars from this era in that it had an integrated body and hidden fasteners. The bodywork on this type of car is more time-consuming and expensive and must be done by professionals. However, since then, cars have become far more complex and, as a result, lower serviceability.
Serviceability Trend
The long-term is to decrease the serviceability in items. While this may be good for company profits, it is terrible for the consumer and bad for the environment. The more challenging and expensive it is for items to be repaired, the more quickly they are replaced by new things. The problem is that companies do not seem to have an incentive to build long-lasting and easily serviced items. The business’s finance area appears to think it reduces sales of new projects (which it does), and new product design and marketing seem to think it reduces the “coolness” factor of goods.
Marketing and finance have come to dominate US corporations, so it is no surprise that their values have become American business values. This is not going unnoticed. According to industrial designer Victor J. Papanek, the following holds.
That while American products once set industrial standards for quality, consumers of other nations now avoid them due to shoddy American workmanship, quick obsolescence and poor value.
What is Planned Obsolescence?
Planned obsolescence is when a manufacturer makes deliberate changes to the design and manufacture of an item that reduces its longevity. Planned obsolescence can be seen as an extension of the engineering lifecycle model, where some components are reduced in quality to match the overall expected life of the item. But in this case, it is designed to bring the entire useful life of the product down. Planned obsolescence is probably best identified with US automakers who engaged in this activity when they had a near-monopoly on the US auto market.
Historical View on Planned Obsolescence
This common impression, which is reinforced by advertising, is that this year’s model is better than last year’s and that, in general, we are on a continual upward slope. This is not actually the case. There are many business practices and products that were “better” – better for the consumer and better for the environment — in the past.
In addition to serviceability, many products were designed to last longer half a century ago. As an example, there is a lively market for classic toasters from the 1950s on eBay.
This 60+-year-old toaster still works because it was built to last. The concept of a 60+-year-old Item is unheard of today.
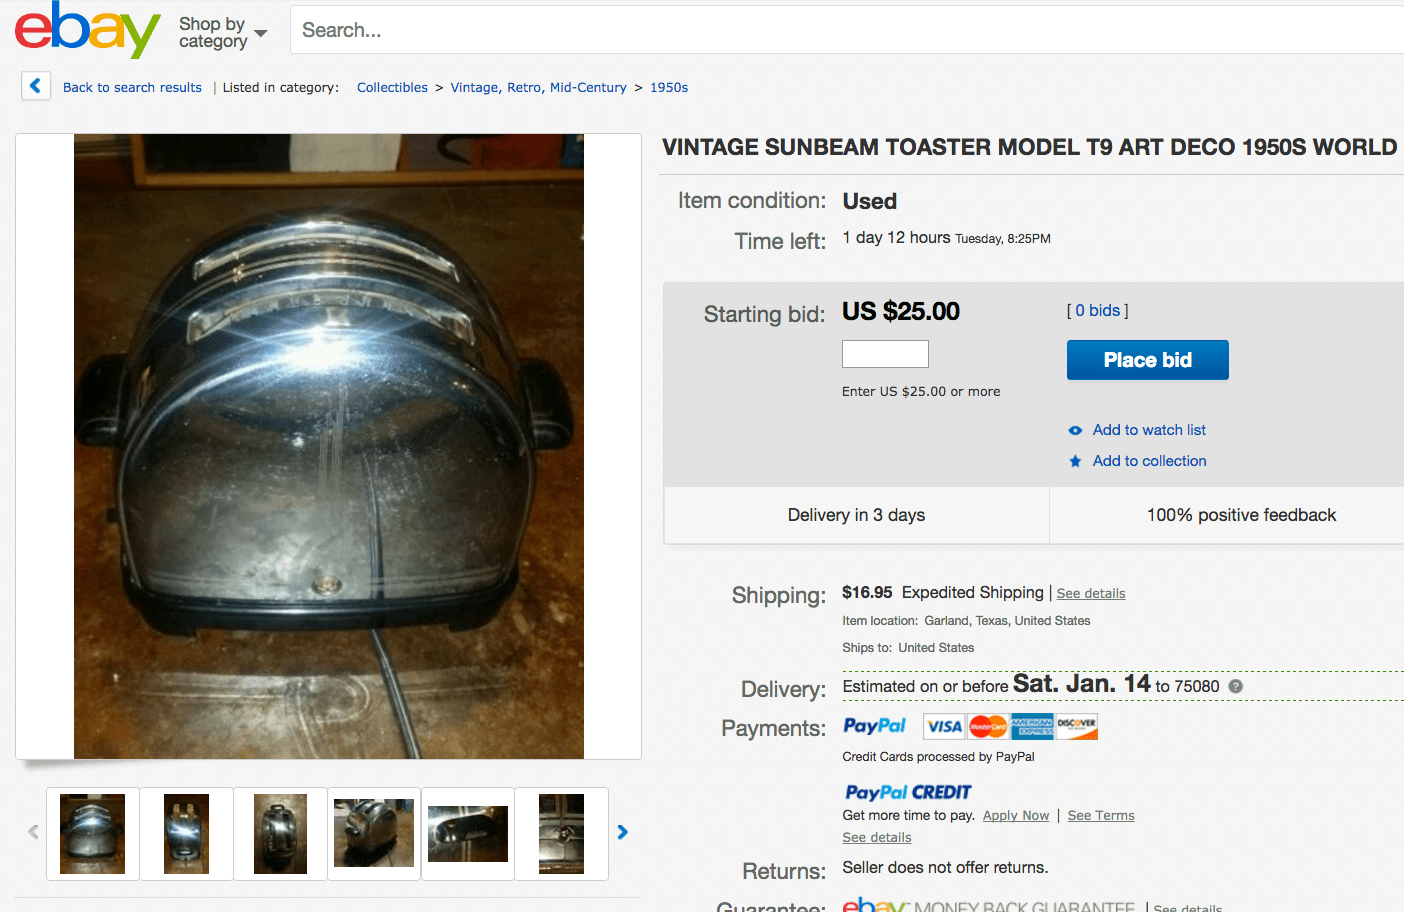
This 1950s SubBeam is still working and adjusted for inflation, and It is probably selling for more on eBay than it did back when it was purchased in a store in the 1950s. Why can’t more items be built to last and be constructed to be serviceable?
In the book Waste Makers, published in 1960, the approach to planned obsolescence was laid out.
Beyond all these factors of quality debasement and by repairmen there were several objective factors about modern appliances that helped make them expensive to maintain and that helped increase the business volume of servicing agencies or replacement-parts manufacturers, and, in some cases, the manufacturers hoping to sell new replacement units. There were more things to go wrong. Those added luxury accessories that so delight copy writers were adding to the problems of products to break down. The rush to add extras on washing-machines in the form of cycle control, additive injector, increased the number of things that can develop ailments. The Wall Street Journal wrote: “Parts and accessory dealers naturally are pleased with the added extras put on new cars.” They should be. I have two neighbors who bought station wagons in 1958. One bought a model with power steering, power brakes, automatic shifting, and power windows. The other—a curmudgeon type who doesn’t think that shifting gears and raising windows by hand are too much of a strain—bought a car without any of the extras. His years of ownership of the car have been relatively trouble-free. (And by spurring the extras he saved several hundred dollars at the outset.) The other neighbor who bought the car with all the extras moans that he got a “lemon.” His car, he states, has been laid up at the garage seven times, usually because of malfunctioning of the optional equipment. Replacement parts were costing more. The gizmoed motorcar was a good case in point. A creased fender that in earlier years could be straightened for a few dollars was now, with integral paneling” and high-styled sculpturing, likely to cost I $100 to correct. The wrap-around windshield was likely to last three to five times as much to replace as the unbent/ windshields that motor cars had before the fifties. Ailing parts were increasingly inaccessible. In their pre occupation with gadgetry and production short cuts, and perhaps obsolescence creation—manufacturers often gave little thought to the problem of repairing their products (or made them hard to repair.) Sales Management dominated and demanded that“products are not designed for service.”It was of steam iron that could be repaired only by breaking it apart and taking out the screws. Some toasters were riveted together such that a repairman had to spend nearly an hour just getting to the right part. This is to replace a fifteen-cent or a ten-cent spring. Product analysts at Consumers Union told me that air-conditioning units in automobiles were often cluttering up the engine compartment so badly that it took an hour or two to remove a rear spark plug. Built-in appliances—which were being hailed as the wave of the future had to be disengaged from the wall before repair work could begin. Many of these built-ins were simply standard.
I suppose the question to ask is, what has changed? How did American businesses go from offering many durable products with high serviceability to offering products designed to be thrown away?
Secondly, how did both American and international consumers become habituated to this new consumption pattern? Thirdly, does anyone think that this trend can be reversed by “the market?” It would appear that on broader goals such as environmentalism (which the life-span of products contributes to). That the market will drive product development in the opposite direction, towards planned obsolescence.
People need to have a better understanding of the relationship between product serviceability and sustainability. It’s hard to see companies making a focus on product serviceability without more pressure from consumers. However, consumers have become so habituated to disposable products that most don’t know where to begin to ask for this level of build quality.
Planned Obsolescence Redefined
Planned obsolescence describes the active reduction in reliability by manufacturers to increase future sales. However, not all obsolescence is of this type. Some “planned obsolescence” is a lack of market pressure to make the sort of trade-offs that would result in higher quality items. With the current move to outsourcing manufacturing to China, the manufacturing costs drastically go down, but factors like long-term usability decrease. But the profit incentives on the part of companies overwhelm all other considerations.
In fact, many luxury-brand items today are made on assembly lines in developing nations, where labor is vastly cheaper. I saw this firsthand when I visited a leather-goods factory in China, where women 18 to 26 years old earn $120 a month sewing and gluing together luxury-brand leather handbags, knapsacks, wallets and toiletry cases. One bag I watched them put together — for a brand whose owners insist is manufactured only in Italy — cost $120 apiece to produce. That evening, I saw the same bag at a Hong Kong department store with a price tag of $1,200 — a typical markup.
How do the brands get away with this? Some hide the “Made in China” label in the bottom of an inside pocket or stamped black on black on the back side of a tiny logo flap. Some bypass the “provenance” laws requiring labels that tell where goods are produced by having 90 percent of the bag, sweater, suit or shoes made in China and then attaching the final bits — the handle, the buttons, the lifts — in Italy, thus earning a “Made in Italy” label. Or some simply replace the original label with one stating it was made in Western Europe.
To please customers looking for the “Made in Italy” label, several luxury companies now have their goods made in Italy by illegal Chinese laborers. Today, the Tuscan town of Prato, just outside of Florence and long the center for leather-goods production for brands like Gucci and Prada, has the second-largest population of Chinese in Europe, after Paris. More than half of the 4,200 factories in Prato are owned by Chinese entrepreneurs, some of whom pay their Chinese workers as little as two Euros ($3) an hour.
What is Perceived Obsolescence?
While we have covered planned obsolescence, which is entirely the work of the producer. What about perceived obsolescence, which is a more complicated form of obsolescence, which is the work of both the producer and the consumer?
- Fashion is one example of perceived obsolescence. Fashion goods have a shelf life where the wearer of out-of-date fashions results in social stigma, and it is probably the most obvious example of perceived obsolescence. The fashion industry receives considerably higher sales than it would ordinarily receive by employing perceived obsolescence.
- Cell phones or other technological items that are replaced because they are not up to date rather than no longer adequately meeting the user’s needs is another example of perceived obsolescence.
Perceived obsolescence is in part due to the messaging put out by the producer. But perceived obsolescence also has its origin with the user and their social interactions. If a person uses a car or phone that works perfectly well but is seen not to be of the appropriate status or otherwise has negative social repercussions or has a negative emotional feeling for the user, this is viewed as obsolescence. Messaging, which includes advertising from the producer who builds up the new item at the old expense, is part of perceived obsolescence.
Perceived obsolescence and planned obsolescence work together to reduce the longevity of products and to increase waste.
Conclusion
There can be no causal forecasting without casuals. This type of data should be elementary to maintain, but it is often not maintained. John Snow, in his Uptime Blog, which is associated with Engima, provides some real insight as to why below. It seems that the natural inclination of many service departments is to focus on quickly getting equipment back in service, with less concern for proper equipment maintenance and calibration.
During a break-fix event (unscheduled maintenance), this is a rational response: the equipment is down, revenue generation has stopped, so get the machines working again. However, even during scheduled service events, mechanics can become overly focused on speed. This is an example of reacting to the urgent rather than resolving the outstanding. The problem is that service departments are often measured more on productivity than on quality.
See the full article here.
References
https://www.provantage.com/seagate-st3320410sv~7SEGS1UN.htm
This is an interesting article on planned obsolescence in hard drives. We quote from it below.
https://www.driveservice.com/bestwrst.htm
https://www.pcworld.com/article/129558/studyharddrivefailureratesmuchhigherthanmakers_estimate.html