
Executive Summary
- This is the Brightwork Research & Analysis software rating series.
- We rate both the software and estimate the risk of implementing each application.
MUFI Rating & Risk for JDA Demand Management
MUFI: Maintainability, Usability, Functionality, Implement ability
Vendor: JDA (Select For Vendor Profile)
Introduction
JDA owns some of the most previously prominent supply chain planning companies in Manugistics and i2 Technologies. Both were such essential leaders in the supply chain planning space that it is a fantastic turn of events that both companies were united – and at low purchase priced – under JDA. This changed JDA as their heritage is in retail software. At some point, they decided to switch to being a software conglomerate. The purchase of two software vendors with identical footprints (although strong in different areas) always seemed to indicate that JDA was following the Computer Associates/now Oracle model of buying software for its customers and their support contracts. Experience in analyzing JDA supports the fact that this is the company’s strategy.
Application Detail
JDA Demand Management (DM), their forecasting application was acquired from the Manugistics acquisition. Manugistics forecasting application was for years one of the best applications that Manugistics had. When companies that switched way from Manugistics demand planning to trendier applications like SAP DP end up wishing they had not. Therefore, even though it has not been developed much by JDA since the acquisition, it is still a competitive application.
JDA has an excellent classification tool that tells the user what percentage of the products would optimally go out on which type of model.
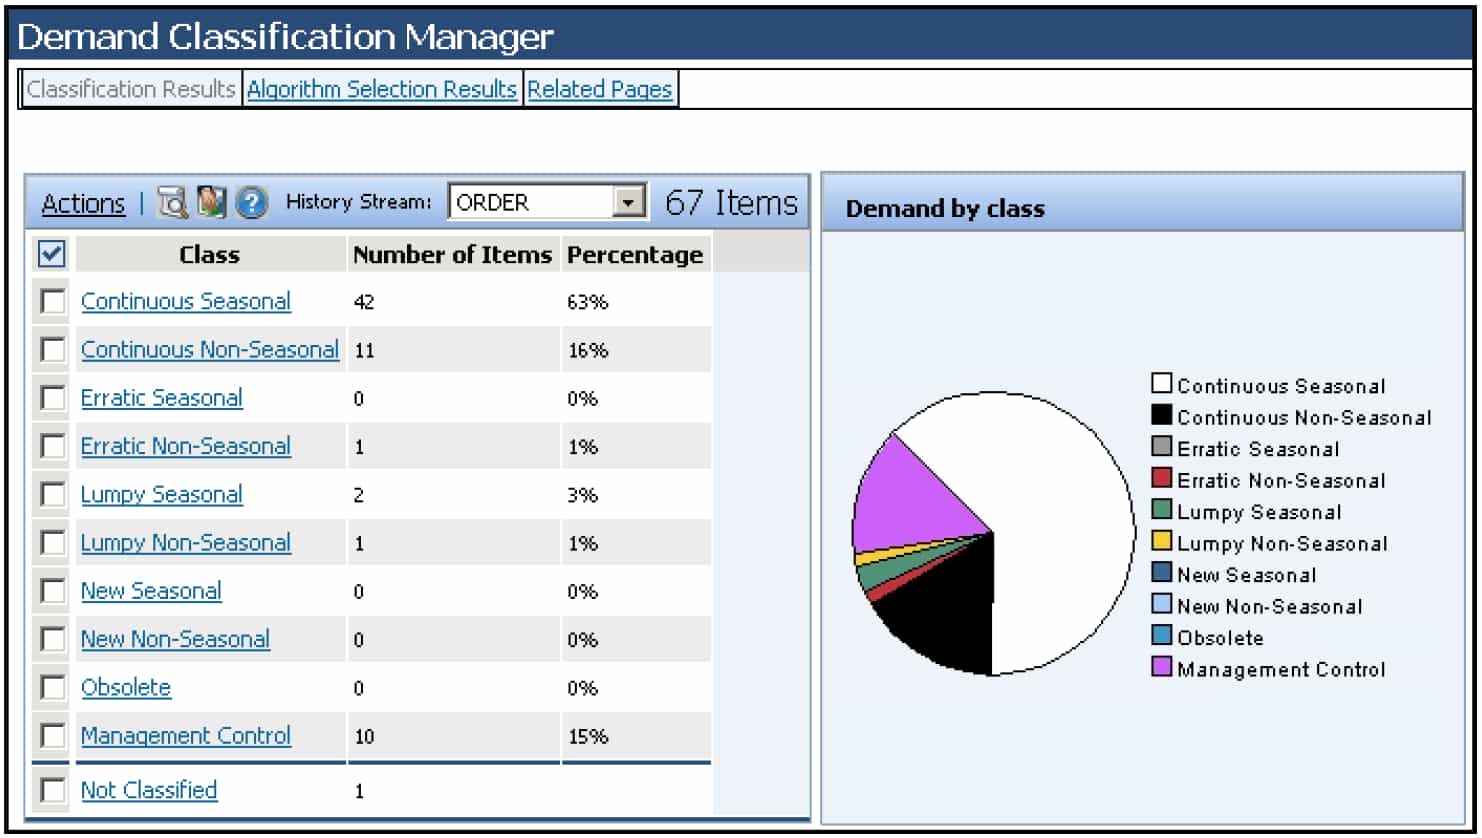
In JDA’s DM Classification Manager, it is clear that with this data, the majority of the product database goes out on the continuous non-seasonal method. What is shown in the graphic above are not models because within each technique are multiple models which contain specific configuration details? For instance, a moving average is a method; however, a three-period moving average is a particular model.
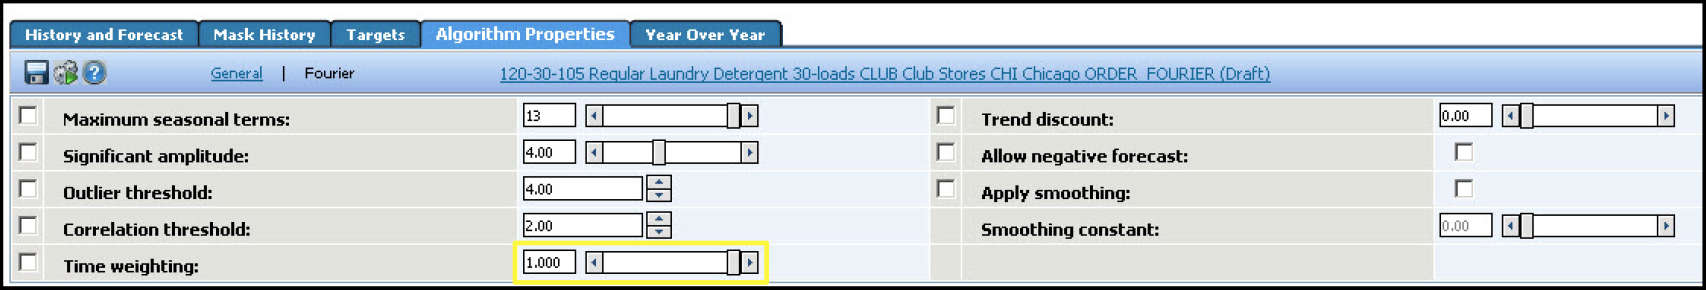
Above, the time weighting factor can be seen. Time weighing can reduce the influence of older demand history. While this is a very convenient way of essentially performing historical removal, one still has to determine whether and how much history should be removed. Once known, this setting in JDA DM can help implement the historical removal or historical time weighing.
Lifecycle Planning in JDA Demand Management
Lifecycle planning is managed very individually concerning dates in JDA Demand Management. The dates include:
- History Start Date: The earliest demand history date that the system uses in producing a forecast.
- Demand Post Date: Date up to which demand has been posted (DFU: DmdPostDate). The period into which the demand post date falls is the first forecast period. (see footnote for explanation)
- Effective Date: The date when the system begins producing forecasts
- Discontinue Date: The date after which the systems stops producing forecasts
The user can specify all of these dates very quickly in the JDA interface. These dates, shown in the screenshot below, are then applied at the product level.
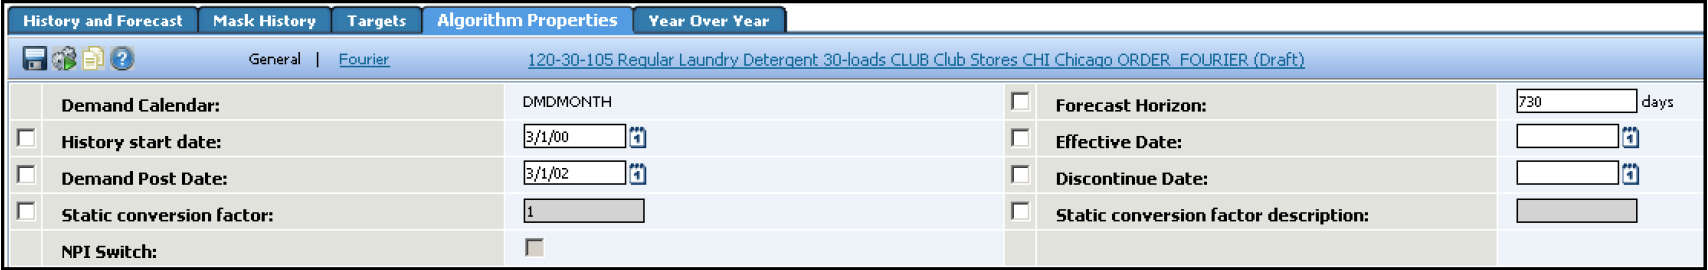
Using these dates, JDA Demand Management can easily control the essential lifecycle dates for a product. The dates can be applied to the user interface by a planner or can be adjusted for a large number of products by performing a upload, with the dates adjusted as desired, to the JDA Demand Management application database.
Copying Demand History Between Like Products
One way of performing lifecycle planning is by copying one product’s demand history over to another product. This is particularly useful during a new product introduction, where a company believes there to be a high degree of similarity between the new product and an existing product. Copying demand is an alternative to providing a product with uplift commensurate with how another product performed. While a company can use a variety of approaches to predict the demand of a new product, one cannot do much better than to find a like product that has already been introduced and has a demand history.
JDA Demand Management provides a comfortable and detailed way to copy the demand history as well as other factors such as the tuning parameters, forecasting method, etc.
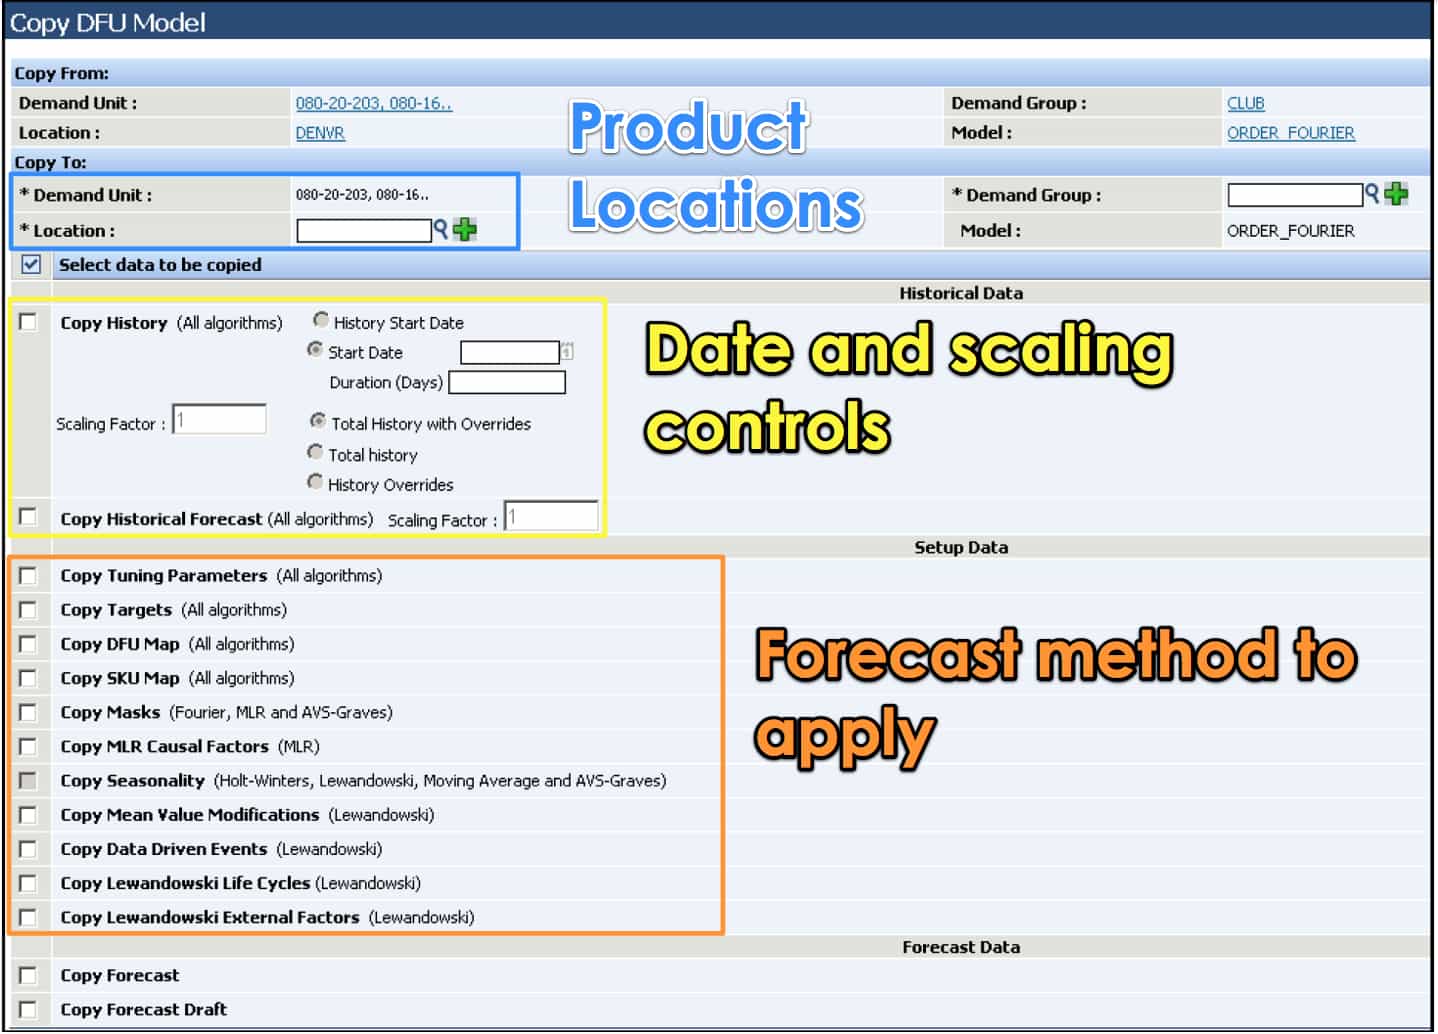
The ability to mix and match different features of a product in the forecasting system, as seen above, makes JDA’s functionality quite flexible. Notice also that the demand history can be copied for specific portions of the overall demand history. Secondly, there is a great deal of flexibility regarding what can be reproduced as the lower settings demonstrate. I consider this type of flexibility concerning lifecycle planning a best practice design.
JDA DM is a good choice for companies that are looking for very detailed control over the application of changes to the forecast and demanding history. Although little developed since the JDA acquisition it is still a competitive application. DM has been a leading forecasting application since before the JDA acquisition. It has a very good word of mouth among people that have used it, and many of its approaches have stood the test of time. Some of the ways that DM works are unique in the marketplace and many of the features do not become apparent until one has extended use. DM often seems to have precisely the type of functionality that many experience forecasting people would have put into an application if they had a chance to develop their forecasting application. And an indication that DM was designed by individuals with a great deal of practical forecasting experience.
MUFI Scores
All scores out of a possible 10.
MUFI Scores
- Ma. = Maintainability
- Us. = Usability
- Fu. = Functionality
- Im. = Implementability
| App | Ma. | Us. | Ft. | Im. | Cat. |
|---|---|---|---|---|---|
| Average Score for Big ERP | 5.1 | 4.8 | 5.2 | 5.4 | Big ERP |
| Average Score for CRM | 6.2 | 6.2 | 5.1 | 5.9 | CRM |
| Average Score for Small and Medium ERP | 8.3 | 8 | 6.7 | 8.5 | Small and Medium ERP |
| Average Score for Finance | 8.8 | 8.8 | 8 | 8.8 | Finance |
| Average Score for Demand Planning | 7.6 | 7.2 | 7 | 7.1 | Demand Planning |
| Average Score for Supply Planning | 6.7 | 6.9 | 7 | 6.8 | Supply Planning |
| Average Score for Production Planning | 6.8 | 6.9 | 7 | 6.9 | Production Planning |
| Average Score for BI Heavy | 5.5 | 5.3 | 6.9 | 5.3 | BI Heavy |
| Average Score for PLM | 7 | 7.2 | 6.8 | 7.3 | PLM |
| Average Score for BI Light | 7.7 | 8.7 | 9 | 8.3 | BI Light |
| Arena Solutions Arena PLM | 10 | 10 | 10 | 10 | PLM |
| AspenTech AspenOne | 4 | 8 | 10 | 7 | Production Planning |
| Birst | 8 | 8.5 | 10 | 8 | BI Light |
| ERPNext | 10 | 10 | 7.5 | 10 | Small and Medium ERP |
| Delfoi Planner | 8 | 6 | 6.5 | 7 | Production Planning |
| Demand Works Smoothie SP | 9 | 10 | 7 | 10 | Supply Planning |
| Hamilton Grant RM | 10 | 9 | 8.5 | 9 | PLM |
| IBM Cognos | 2.7 | 3 | 1.5 | 3 | BI Heavy |
| Infor Epiphany | 7 | 8 | 6 | 5 | CRM |
| Infor Lawson | 8 | 7 | 6 | 7 | Big ERP |
| Intuit QuickBooks Enterprise Solutions | 9 | 9 | 5 | 9 | Finance |
| JDA DM | 9 | 7.5 | 8 | 8 | Demand Planning |
| Microsoft Dynamics CRM | 2 | 3 | 2 | 2 | CRM |
| NetSuite CRM | 6 | 4 | 3 | 3 | CRM |
| Netsuite OneWorld | 7 | 7 | 8 | 8 | Big ERP |
| OpenERP | 7 | 8 | 8.5 | 8 | 7 |
| Oracle BI | 4 | 4 | 3 | 6 | BI Heavy |
| Oracle CRM On Demand | 4 | 5 | 3 | 5 | CRM |
| Oracle Demantra | 5 | 3 | 3.5 | 4.5 | Demand Planning |
| Oracle JD Edwards World | 4 | 1 | 3 | 6 | Big ERP |
| Oracle RightNow | 6 | 7 | 4 | 5 | CRM |
| PlanetTogether Galaxy APS | 10 | 10 | 10 | 10 | Production Planning |
| Preactor | 8 | 7 | 3 | 7 | Production Planning |
| QlikTech QlikView | 9 | 9 | 10 | 9 | BI Light |
| Rootstock | 9 | 8 | 9 | 9 | Small and Medium ERP |
| Sage X3 | 8 | 8 | 7 | 8 | Big ERP |
| Salesforce Enterprise | 8 | 8.5 | 9 | 7.5 | CRM |
| SAP APO DP | 3 | 4 | 3 | 2 | Demand Planning |
| SAP APO PP/DS | 2 | 2 | 4 | 3 | Production Planning |
| SAP APO SNP | 3 | 4 | 8 | 4 | Supply Planning |
| SAP BI/BW | 1.5 | 2 | 4 | 2 | BI Heavy |
| SAP Business Objects | 3 | 2.5 | 7 | 3 | BI Heavy |
| SAP CRM | 4 | 3 | 6 | 4 | CRM |
| SAP ECC | 3 | 3 | 6.5 | 3 | Big ERP |
| SAP PLM | 1 | 2.5 | 2 | 3 | PLM |
| SAP SmartOps | 4 | 4 | 7 | 5.5 | Supply Planning |
| SAS BI | 6.5 | 7 | 9 | 6 | BI Heavy |
| SAS Demand Driven Forecasting | 7 | 8 | 9 | 7 | Demand Planning |
| Tableau (BI) | 9 | 10 | 10 | 10 | BI Light |
| Tableau (Forecasting) | 10 | 8 | 5 | 9 | Demand Planning |
| Teradata | 8 | 6.3 | 9.7 | 6 | BI Heavy |
| ToolsGroup SO99 (Forecasting) | 7 | 8 | 9 | 7 | Demand Planning |
| ToolsGroup SO99 (Supply) | 5 | 6 | 10 | 7 | Supply Planning |
Vendor and Application Risk
JDA DM has a long history of implementations behind it. The application is dated, but its original design was so good that it continues to be a good choice. The main risk issue with JDA DM is related to getting users to access the deep functionality of the application. DM provides precise control over manual changes, substitution, and many other functions. The functionality is robust, but there is a lot of it, and this means the application has a relatively high training load.
Likelihood of Implementation Success
This accounts for both the application and the vendor-specific risk. In our formula, the total implementation risk is application + vendor + buyer risk. The buyer specific risk could increase or decrease this overall likelihood and adjust the values that you see below.
Likelihood of Application Implementation Success and Failure
Search for the application in this table using the search bar in the upper right of the table.
| Application | Prob of Implementation Success | Prob of Implementation Failure |
|---|---|---|
| Actuate | 0.77 | 0.23 |
| SAP Smartops | 0.39 | 0.61 |
| NetSuite CRM | 0.46 | 0.54 |
| Sugar CRM | 0.62 | 0.48 |
| Base CRM | 0.91 | 0.09 |
| SAP CRM | 0.35 | 0.65 |
| Salesforce Enterprise | 0.72 | 0.28 |
| QlikTech QlikView | 0.82 | 0.18 |
| Tableau (BI) | 0.98 | 0.02 |
| SAP Crystal Reports | 0.46 | 0.54 |
| Brist | 0.83 | 0.17 |
| MicroStrategy | 0.7 | 0.3 |
| SAS BI | 0.76 | 0.24 |
| Oracle BI | 0.35 | 0.65 |
| IBM Cognos | 0.23 | 0.77 |
| Infor Epiphany | 0.58 | 0.42 |
| Microsoft Dynamics CRM | 0.26 | 0.74 |
| Oracle RightNow CRM | 0.41 | 0.59 |
| Oracle CRM On Demand | 0.36 | 0.64 |
| Teradata | 0.76 | 0.24 |
| SAP Business Objects | 0.32 | 0.68 |
| SAP BI/BW | 0.25 | 0.75 |
| SAP PLM | 0.29 | 0.71 |
| Hamilton Grant RM | 0.89 | 0.11 |
| Arena Solutions | 0.96 | 0.04 |
| Delfoi Planner | 0.7 | 0.3 |
| Preactor | 0.64 | 0.36 |
| PlanetTogether Galaxy APS | 0.96 | 0.04 |
| AspenTech AspenOne | 0.55 | 0.45 |
| SAP APO PP/DS | 0.27 | 0.73 |
| Demand Works Smoothie SP | 0.93 | 0.07 |
| ToolsGroup SO99 (Supply) | 0.82 | 0.18 |
| Demand Works Smoothie | 0.96 | 0.04 |
| Tableau (Forecasting) | 0.9 | 0.1 |
| SAS Demand Driven Forecasting | 0.82 | 0.18 |
| ToolsGroup SO99 (Forecasting) | 0.86 | 0.14 |
| JDA DM | 0.57 | 0.43 |
| Oracle Demantra | 0.33 | 0.67 |
| SAP APO DP | 0.28 | 0.72 |
| FinancialForce | 0.92 | 0.08 |
| Intacct | 0.98 | 0.02 |
| Intuit QB Enterprise | 0.8 | 0.2 |
| ERPNext | 0.9 | 0.1 |
| OpenERP | 0.78 | 0.22 |
| Rootstock | 0.91 | 0.09 |
| ProcessPro | 0.93 | 0.07 |
| Microsoft Dynamics AX | 0.4 | 0.6 |
| SAP Business One | 0.49 | 0.51 |
| Sage X3 | 0.62 | 0.38 |
| Infor Lawson | 0.58 | 0.42 |
| Epicor ERP | 0.4 | 0.6 |
| Oracle JD Edwards World | 0.31 | 0.69 |
| Oracle JD Edwards EnterpriseOne | 0.36 | 0.64 |
| SAP ERP ECC/R/3 | 0.32 | 0.68 |
| NetSuite OneWorld | 0.65 | 0.35 |
Risk Definition
See this link for more on our categorizations of risk. We also offer a Buyer Specific Risk Estimation as a service for those that want a comprehensive analysis.
Finished With Your Analysis?
To go back to the Software Selection Package page for the Demand Planning software category. Or go to this link to see other analytical products for JDA Demand Management.
References
Demand Post Date refers to the last date that demand was posted to the system. It separates out the “history” from the “forecast” and serves as the basis for defining the first forecast period. For example, if I am forecasting in weekly buckets on a Sunday start, and my demand post date is set to Feb 5, 2012, this date represents that the last posted history was on Feb. 5, 2012, encapsulating the sales from the prior week. Therefore, the first bucket of the future forecast is for the week of February 5, 2012. – Paula Natoli, JDA