
Executive Summary
- This is the Brightwork Research & Analysis software rating series.
- We rate both the software and estimate the risk of implementing each application.
MUFI Rating & Risk for SAP APO SNP
MUFI: Maintainability, Usability, Functionality, Implement ability
Vendor: SAP (Select For Vendor Profile)
Supply Network Planning (SNP) is SAP’s supply planning application. SAP APO is a broad advanced planning suite that includes, depending on how you count, around ten modules (although the bulk of its implementations are in just four modules). The relevant modules for supply planning and production planning are called Supply Network Planning (SNP) and Production Planning and Detailed Scheduling (PP/DS), respectively. As with all of the APO modules, SNP and PP/DS work in conjunction with each other. While there is some overlap (which will be explained), these are traditional sequential and supply planning first applications. Their design goes back to the mid-1990s, and both products are patterned off of products made by i2 Technologies,
Application Detail
SNP is part of the SAP APO/SCM advanced planning suite. It is the highest quality and most stable module in a suite, but that is not saying much because the overall APO suite is of overall poor quality.
SNP’s design is from the mid-1990s and offers three planning methods. They are the following:
- Heuristics:
- The SNP heuristic: This replicates MRP (material requirements planning) – which creates planned production and planning procurement orders.
- SNP Deployment Heuristic: The replicates DRP (distribution requirements planning) and creates the stock transfers between the locations in the supply network, which is the deployment plan.
- Capable to Match, or CTM: This is an allocation method of supply planning that allows the prioritization of supply versus demand. So one could have some supplies processed in through the supply network before others, and some demand processed before other demand. CTM has no deployment method, so typically the SNP Deployment Heuristic is used to create stock transfers.
- 3. The Cost Optimizer
- The Network Optimizer: This creates the planned production and planning procurement orders. It works by setting a series of costs, both explicit costs (such as storage costs and transportation costs). Implicit costs (such as the cost of a lost sale), and then have the optimizer attempt to minimize these costs when it creates supply plan (and initial production plan) against a set of constraints. SNP then uses what we call method modifiers, which are master data that typically batch the orders to economic quantities.
- The Deployment Optimizer: This works the same way as the Network Optimizer, but it leaves out production – so uses the existing production plan as an assumption.
As with other supply planning systems, each method has some method modifiers that make the planning output realistic. That is if the order quantity created by the planning method is 320, but an economic quantity is 400, the order is rounded up to 400. A variety of controls of this type are placed in the master data which assigned to a product and location combination as is shown in the following screenshot.
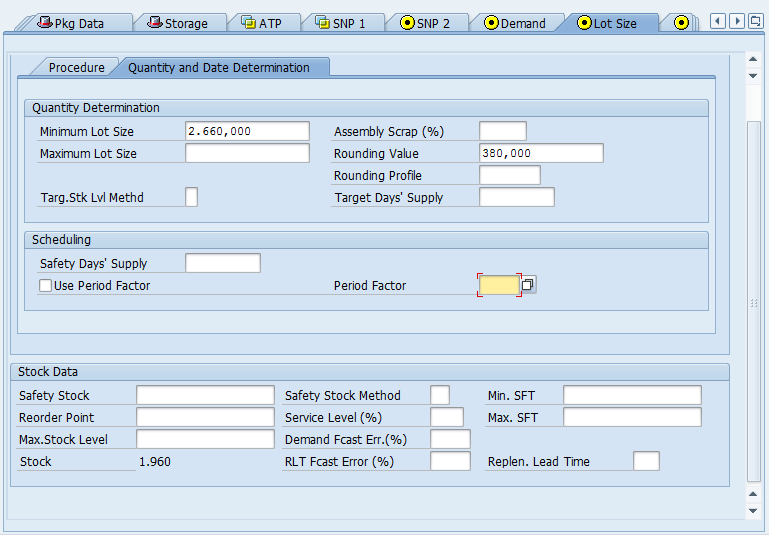
The Lot Size tab of the Product Location Master has two sub-tabs. These two sub-tabs contain the method modifiers. SAP SNP has an enormous number of fields on its product-location master. In contrast, Demand Works Smoothie has a single “tab” for all of the supply planning parameters. While Demand Works Smoothie can adjust these parameters within the interface in groups, SNP cannot. Still, instead, one must use a specific master data mass update transaction, which is inefficient, and most users do not do.
SNP has been designed more for sales than for effective implementation, and the more advanced methods in SNP. Which is the main reason companies select SNP, are poorly designed, meaning that SNP is not able to deliver more value than applications with much more straightforward methods.
None of this is unique to SNP. Instead, all of SAP’s APO modules give advanced planning a black eye, because of their poor quality. The problem is not advanced planning, but in the fact that buyers are not able to differentiate a bad solution from a good solution. Some excellent supply planning applications can add serious value to a company. SNP does not happen to be one of them.
SNP is primarily implemented by large consulting companies, which while they may occasionally staff experienced personnel, do not fundamentally understand how to manage advanced planning projects, and can never lead their clients to choose the best planning applications. The major consulting companies are still stuck following approaches that have been shown not to work that is rooted in the first generation of planning products that were introduced in the 1990s.
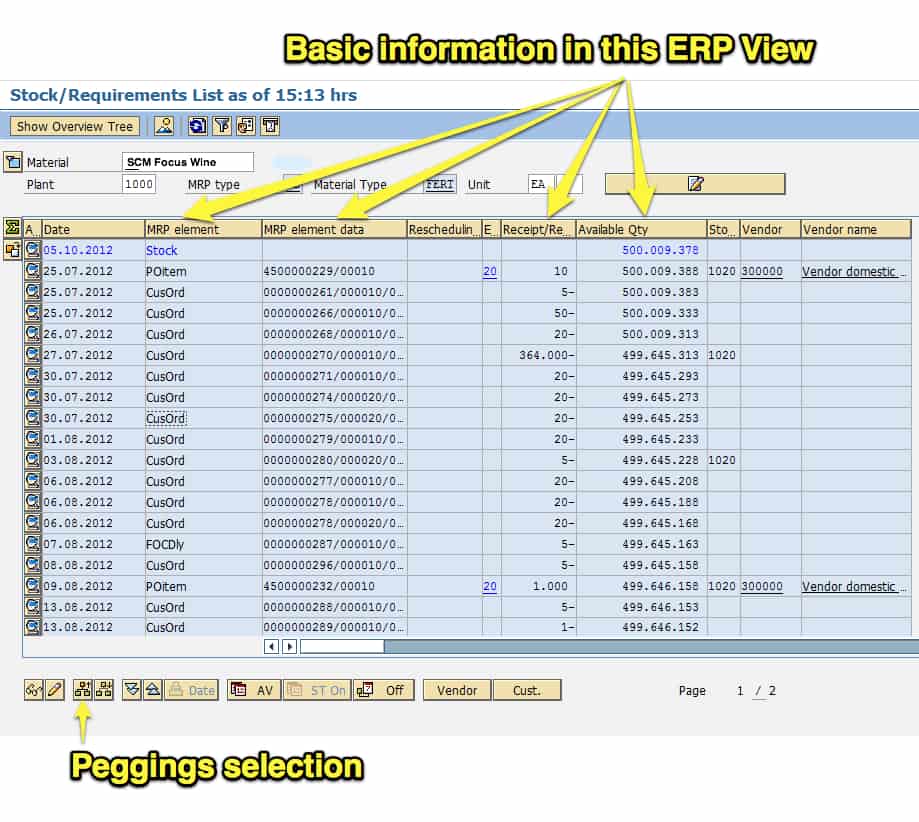
This is a primary user interface view in SAP ERP. Most companies who implement SNP have already implemented SAP ERP. SAP APO is a more recently developed product versus SAP ERP, so it has a more sophisticated user interface (although it still lags all other advanced planning products that we cover)
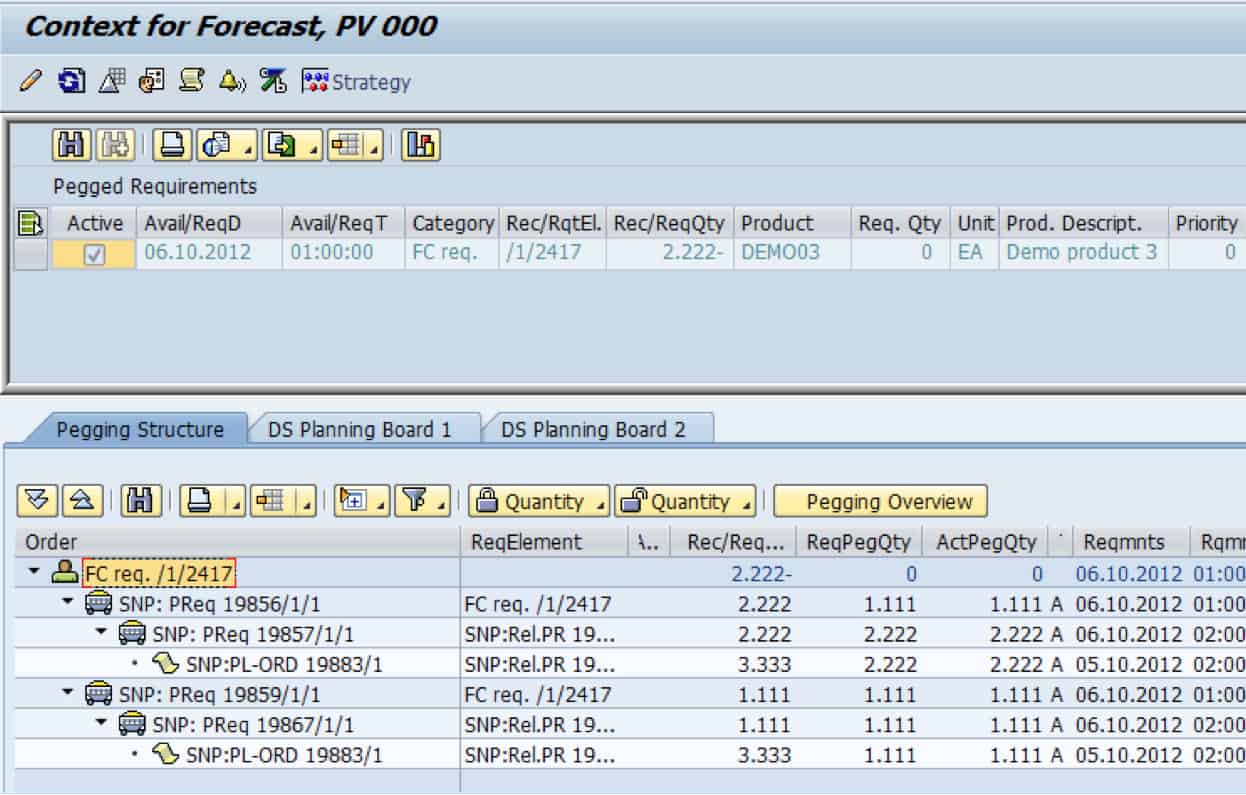
Both of these views provide similar information, but the Product View is much more powerful and multi-faceted. (Although it’s not an elite user interface design, it is much better than the similar view in SAP ERP). SAP APO has something that SAP ERP does not have: the Product View can show more detail on peggings. A “pegging” is a connection between a supply element and a demand element. While a pegging is a single connection between demand and supply, a chain of peggings can show the relationship between a purchase requisition at the end of the supply network and a sales order or forecast at the very top of the supply network. This is shown in the following graphic.
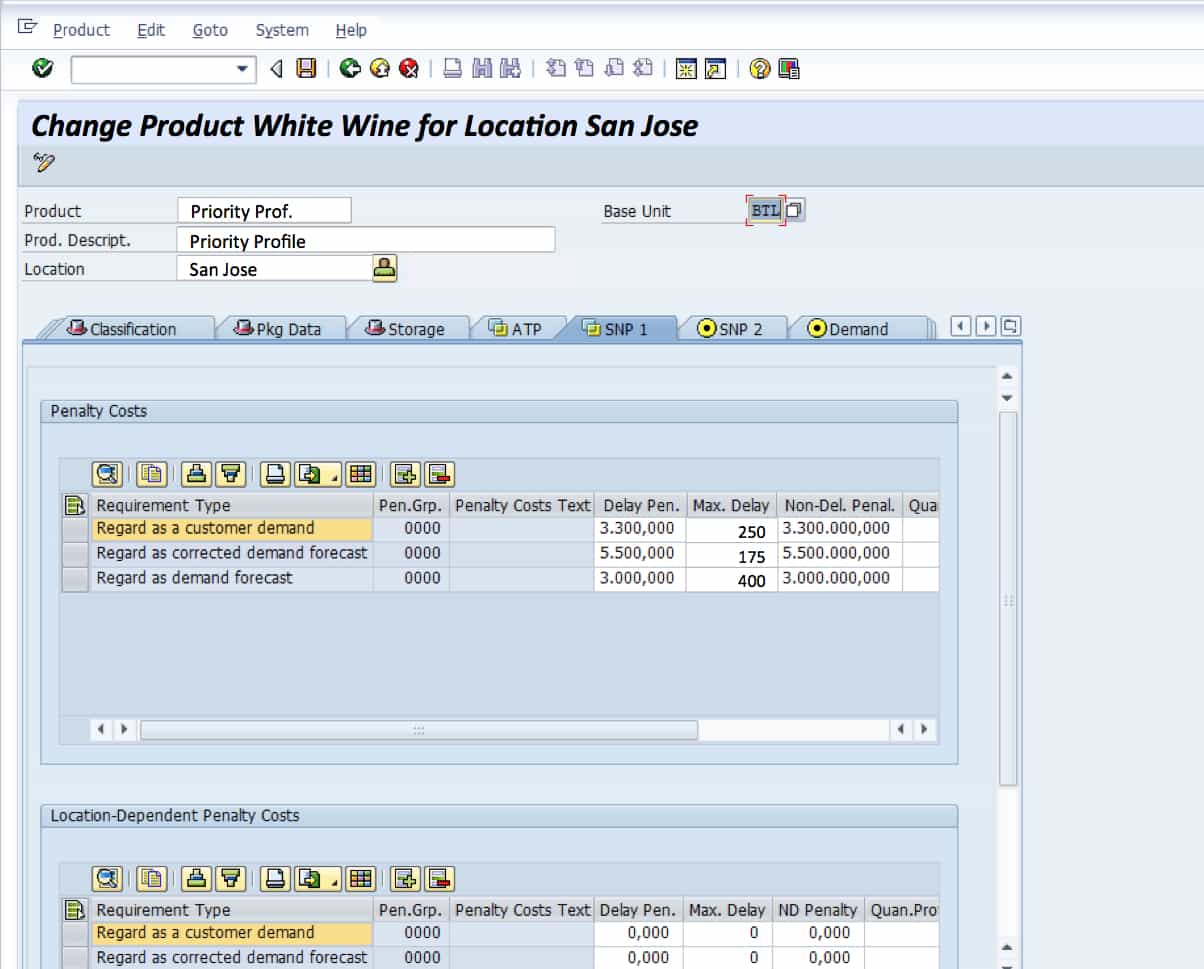
The SNP 1 Tab holds both delay and non-delivery penalties. Because these penalties can be applied at the product level, some products can be prioritized over others based on differentiated non-delivery penalty costs. As with the other costs added to the optimizer, these costs are traded off against additional costs. These costs are not necessarily the final costs that the optimizer uses because SNP has something called cost profiles, which can be used to further, adjust the cost values that are distributed in many different locations. The overall setup and maintenance of these costs are confusing and difficult. SNP is a complicated system to troubleshoot – and so once it is configured, it typically stays in the same state for years, because a small change can completely alter the output because of the interaction with so many settings.
SNP is marketed as a leading solution, but it does not have the most advanced method in supply planning, which is inventory optimization and multi-echelon planning (MEIO). There are some reasons why MEIO is a far better method than cost optimization for supply planning. However, one of the most important is that service levels are far easier for companies to set than determining their costs. SAP argues that this functionality is integrated with SNP through their SmartOps acquisition – however, as is discussed in the SAP SmartOps analysis, this is only partially true.
SNP has a very high maintenance footprint, a maintenance level that is unsustainable for buyers that activate the more advanced functionality. This maintenance requirement catches companies unprepared, which is why in all of the SNP post-go-live evaluations we have performed, SNP is in a state of disrepair.
As with every software category, which we cover where SAP has an entrant, SNP is the highest TCO application. SNP also has the lowest rated user interface of an application in this category, and this is just one of many reasons that SNP has low user adoption.
MUFI Scores
All scores out of a possible 10.
MUFI Scores
- Ma. = Maintainability
- Us. = Usability
- Fu. = Functionality
- Im. = Implementability
| App | Ma. | Us. | Ft. | Im. | Cat. |
|---|---|---|---|---|---|
| Average Score for Big ERP | 5.1 | 4.8 | 5.2 | 5.4 | Big ERP |
| Average Score for CRM | 6.2 | 6.2 | 5.1 | 5.9 | CRM |
| Average Score for Small and Medium ERP | 8.3 | 8 | 6.7 | 8.5 | Small and Medium ERP |
| Average Score for Finance | 8.8 | 8.8 | 8 | 8.8 | Finance |
| Average Score for Demand Planning | 7.6 | 7.2 | 7 | 7.1 | Demand Planning |
| Average Score for Supply Planning | 6.7 | 6.9 | 7 | 6.8 | Supply Planning |
| Average Score for Production Planning | 6.8 | 6.9 | 7 | 6.9 | Production Planning |
| Average Score for BI Heavy | 5.5 | 5.3 | 6.9 | 5.3 | BI Heavy |
| Average Score for PLM | 7 | 7.2 | 6.8 | 7.3 | PLM |
| Average Score for BI Light | 7.7 | 8.7 | 9 | 8.3 | BI Light |
| Arena Solutions Arena PLM | 10 | 10 | 10 | 10 | PLM |
| AspenTech AspenOne | 4 | 8 | 10 | 7 | Production Planning |
| Birst | 8 | 8.5 | 10 | 8 | BI Light |
| ERPNext | 10 | 10 | 7.5 | 10 | Small and Medium ERP |
| Delfoi Planner | 8 | 6 | 6.5 | 7 | Production Planning |
| Demand Works Smoothie SP | 9 | 10 | 7 | 10 | Supply Planning |
| Hamilton Grant RM | 10 | 9 | 8.5 | 9 | PLM |
| IBM Cognos | 2.7 | 3 | 1.5 | 3 | BI Heavy |
| Infor Epiphany | 7 | 8 | 6 | 5 | CRM |
| Infor Lawson | 8 | 7 | 6 | 7 | Big ERP |
| Intuit QuickBooks Enterprise Solutions | 9 | 9 | 5 | 9 | Finance |
| JDA DM | 9 | 7.5 | 8 | 8 | Demand Planning |
| Microsoft Dynamics CRM | 2 | 3 | 2 | 2 | CRM |
| NetSuite CRM | 6 | 4 | 3 | 3 | CRM |
| Netsuite OneWorld | 7 | 7 | 8 | 8 | Big ERP |
| OpenERP | 7 | 8 | 8.5 | 8 | 7 |
| Oracle BI | 4 | 4 | 3 | 6 | BI Heavy |
| Oracle CRM On Demand | 4 | 5 | 3 | 5 | CRM |
| Oracle Demantra | 5 | 3 | 3.5 | 4.5 | Demand Planning |
| Oracle JD Edwards World | 4 | 1 | 3 | 6 | Big ERP |
| Oracle RightNow | 6 | 7 | 4 | 5 | CRM |
| PlanetTogether Galaxy APS | 10 | 10 | 10 | 10 | Production Planning |
| Preactor | 8 | 7 | 3 | 7 | Production Planning |
| QlikTech QlikView | 9 | 9 | 10 | 9 | BI Light |
| Rootstock | 9 | 8 | 9 | 9 | Small and Medium ERP |
| Sage X3 | 8 | 8 | 7 | 8 | Big ERP |
| Salesforce Enterprise | 8 | 8.5 | 9 | 7.5 | CRM |
| SAP APO DP | 3 | 4 | 3 | 2 | Demand Planning |
| SAP APO PP/DS | 2 | 2 | 4 | 3 | Production Planning |
| SAP APO SNP | 3 | 4 | 8 | 4 | Supply Planning |
| SAP BI/BW | 1.5 | 2 | 4 | 2 | BI Heavy |
| SAP Business Objects | 3 | 2.5 | 7 | 3 | BI Heavy |
| SAP CRM | 4 | 3 | 6 | 4 | CRM |
| SAP ECC | 3 | 3 | 6.5 | 3 | Big ERP |
| SAP PLM | 1 | 2.5 | 2 | 3 | PLM |
| SAP SmartOps | 4 | 4 | 7 | 5.5 | Supply Planning |
| SAS BI | 6.5 | 7 | 9 | 6 | BI Heavy |
| SAS Demand Driven Forecasting | 7 | 8 | 9 | 7 | Demand Planning |
| Tableau (BI) | 9 | 10 | 10 | 10 | BI Light |
| Tableau (Forecasting) | 10 | 8 | 5 | 9 | Demand Planning |
| Teradata | 8 | 6.3 | 9.7 | 6 | BI Heavy |
| ToolsGroup SO99 (Forecasting) | 7 | 8 | 9 | 7 | Demand Planning |
| ToolsGroup SO99 (Supply) | 5 | 6 | 10 | 7 | Supply Planning |
Vendor and Application Risk
SAP SNP is a bit of a hypothetical application that is designed more to be sold to buyers than to be implemented and maintained. SNP has an enormous amount of functionality contained within it, but like all the SAP APO modules, the functionality is hit and miss. SAP spends a great deal of time beating around the bush and future promising, bouncing messages back and forth between support and “Platinum Consultants.” Still, the fact is most buyers confirm the same problems with the various functionalities that are known not to work well.
Likelihood of Implementation Success
This accounts for both the application and the vendor-specific risk. In our formula, the total implementation risk is application + vendor + buyer risk. The buyer specific risk could increase or decrease this overall likelihood and adjust the values that you see below.
Likelihood of Application Implementation Success and Failure
Search for the application in this table using the search bar in the upper right of the table.
| Application | Prob of Implementation Success | Prob of Implementation Failure |
|---|---|---|
| Actuate | 0.77 | 0.23 |
| SAP Smartops | 0.39 | 0.61 |
| NetSuite CRM | 0.46 | 0.54 |
| Sugar CRM | 0.62 | 0.48 |
| Base CRM | 0.91 | 0.09 |
| SAP CRM | 0.35 | 0.65 |
| Salesforce Enterprise | 0.72 | 0.28 |
| QlikTech QlikView | 0.82 | 0.18 |
| Tableau (BI) | 0.98 | 0.02 |
| SAP Crystal Reports | 0.46 | 0.54 |
| Brist | 0.83 | 0.17 |
| MicroStrategy | 0.7 | 0.3 |
| SAS BI | 0.76 | 0.24 |
| Oracle BI | 0.35 | 0.65 |
| IBM Cognos | 0.23 | 0.77 |
| Infor Epiphany | 0.58 | 0.42 |
| Microsoft Dynamics CRM | 0.26 | 0.74 |
| Oracle RightNow CRM | 0.41 | 0.59 |
| Oracle CRM On Demand | 0.36 | 0.64 |
| Teradata | 0.76 | 0.24 |
| SAP Business Objects | 0.32 | 0.68 |
| SAP BI/BW | 0.25 | 0.75 |
| SAP PLM | 0.29 | 0.71 |
| Hamilton Grant RM | 0.89 | 0.11 |
| Arena Solutions | 0.96 | 0.04 |
| Delfoi Planner | 0.7 | 0.3 |
| Preactor | 0.64 | 0.36 |
| PlanetTogether Galaxy APS | 0.96 | 0.04 |
| AspenTech AspenOne | 0.55 | 0.45 |
| SAP APO PP/DS | 0.27 | 0.73 |
| Demand Works Smoothie SP | 0.93 | 0.07 |
| ToolsGroup SO99 (Supply) | 0.82 | 0.18 |
| Demand Works Smoothie | 0.96 | 0.04 |
| Tableau (Forecasting) | 0.9 | 0.1 |
| SAS Demand Driven Forecasting | 0.82 | 0.18 |
| ToolsGroup SO99 (Forecasting) | 0.86 | 0.14 |
| JDA DM | 0.57 | 0.43 |
| Oracle Demantra | 0.33 | 0.67 |
| SAP APO DP | 0.28 | 0.72 |
| FinancialForce | 0.92 | 0.08 |
| Intacct | 0.98 | 0.02 |
| Intuit QB Enterprise | 0.8 | 0.2 |
| ERPNext | 0.9 | 0.1 |
| OpenERP | 0.78 | 0.22 |
| Rootstock | 0.91 | 0.09 |
| ProcessPro | 0.93 | 0.07 |
| Microsoft Dynamics AX | 0.4 | 0.6 |
| SAP Business One | 0.49 | 0.51 |
| Sage X3 | 0.62 | 0.38 |
| Infor Lawson | 0.58 | 0.42 |
| Epicor ERP | 0.4 | 0.6 |
| Oracle JD Edwards World | 0.31 | 0.69 |
| Oracle JD Edwards EnterpriseOne | 0.36 | 0.64 |
| SAP ERP ECC/R/3 | 0.32 | 0.68 |
| NetSuite OneWorld | 0.65 | 0.35 |
Risk Definition
See this link for more on our categorizations of risk. We also offer a Buyer Specific Risk Estimation as a service for those that want a comprehensive analysis.
Risk Management Approach
The best approach to implementing SAP SNP is to keep expectations low and keep the configuration as simple as possible. Using the SNP optimizer or CTM is very time consuming and once configured takes a great deal of effort to troubleshoot – and many issues will invariably arise. Keeping the configuration simple is critical because as the highest maintenance application in the supply planning software category, SAP SNP can quickly end up creating a support load that overwhelms the buyer. Activating functionalities like subcontracting, or attempting to model constraints from suppliers is asking for trouble.
Finished With Your Analysis?
To go back to the Software Selection Package page for the Supply Planning software category. Or go to this link to see other analytical products for SAP SNP.