
Executive Summary
- This is the Brightwork Research & Analysis software rating series.
- We rate both the software and estimate the risk of implementing each application.
MUFI Rating & Risk for Tableau (Forecasting)
MUFI: Maintainability, Usability, Functionality, Implement ability
Vendor: Tableau (Select For Vendor Profile)
Introduction
Tableau is the most innovative software vendor in business intelligence. Therefore it was most interesting to learn of Tableau entering the forecasting market. One has to understand the history of forecasting software – which is explained in the introduction to this package, to appreciate why we are optimistic regarding the future of Tableau for forecasting. Forecasting software has most frequently placed the mathematics ahead of the user interface and usability, and the result has been that complex forecasting systems have not improved forecast accuracy anywhere near as much as they have been predicted to. With Tableau’s excellent user interface, they are an intriguing software vendor to enter this space.
Application Detail
What is most interesting is how seamlessly Tableau creates a forecast.
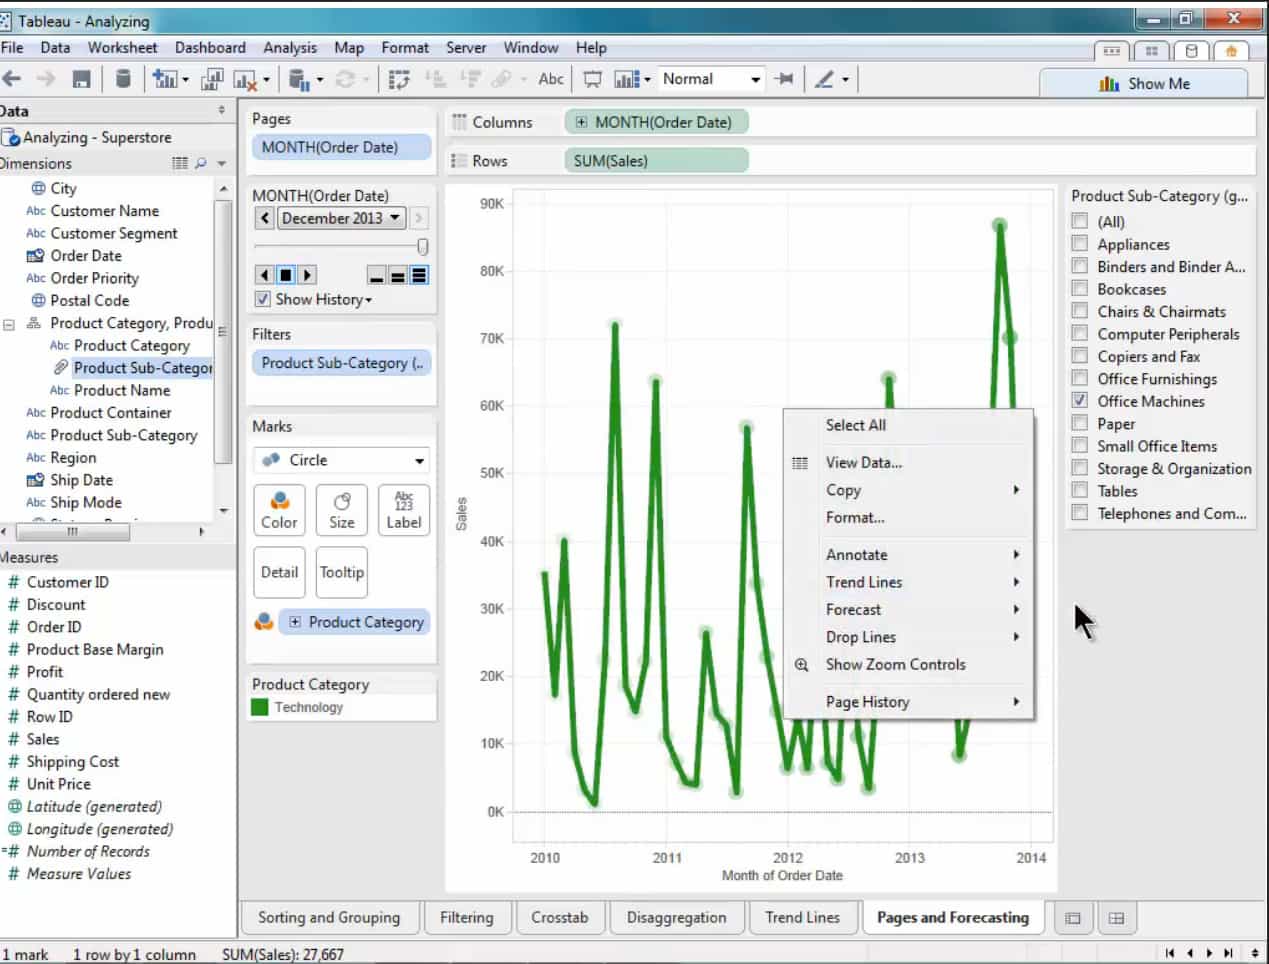
No particular application is required to perform forecasting in Tableau – it all comes in one application. Forecasting merely another feature of their primary application. Here we have a trendline selected. A forecast can be generated for future periods by only performing a right mouse click and selecting Forecast from the menu.
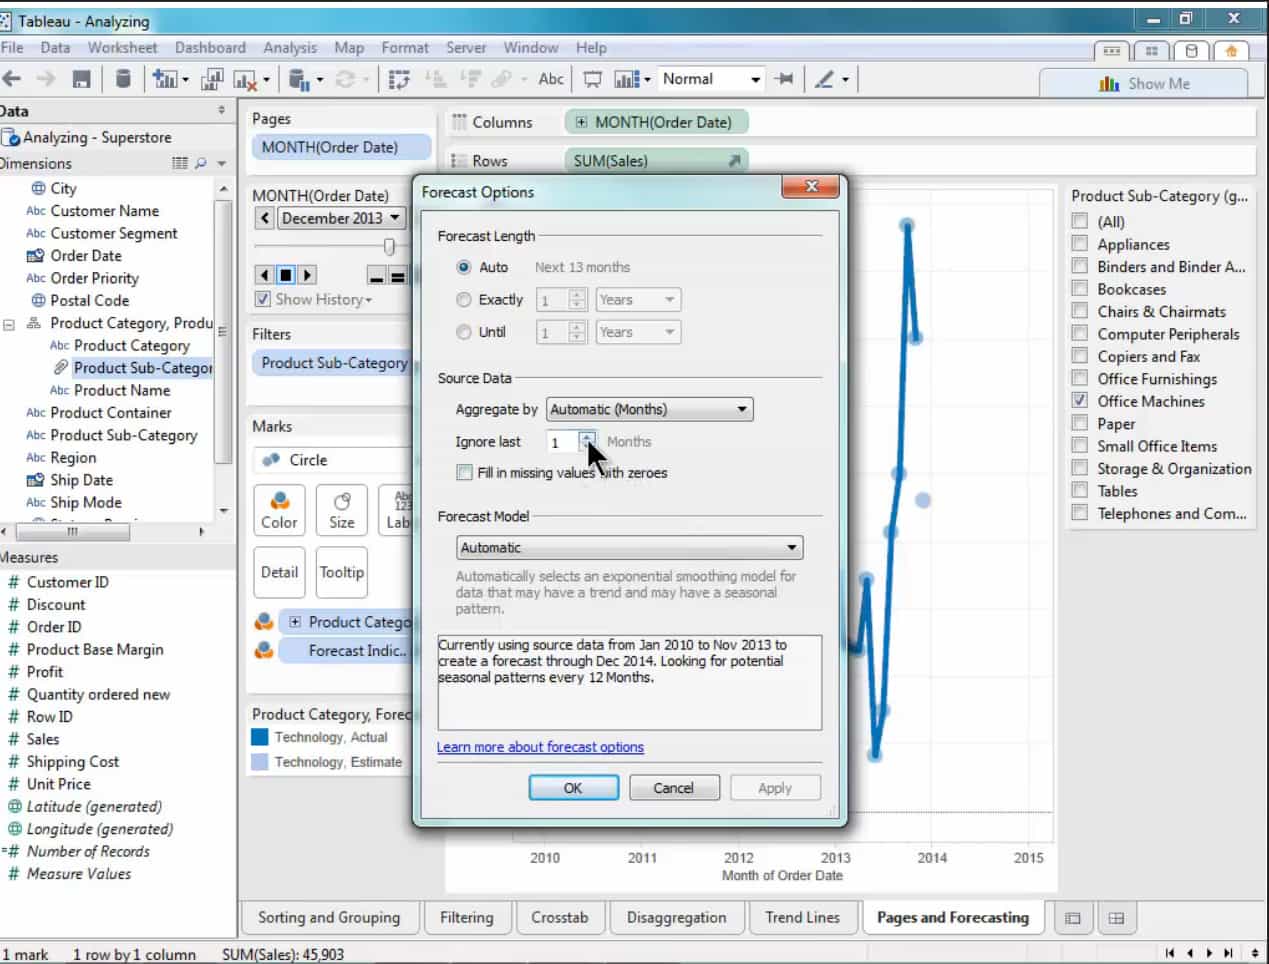
The forecast length and its aggregation, as well as the forecast model, can be selected in this view. One also has the option of “Fill missing values with zeroes,” which tells the application that the data periods were zero rather than non-values that changes the forecast.
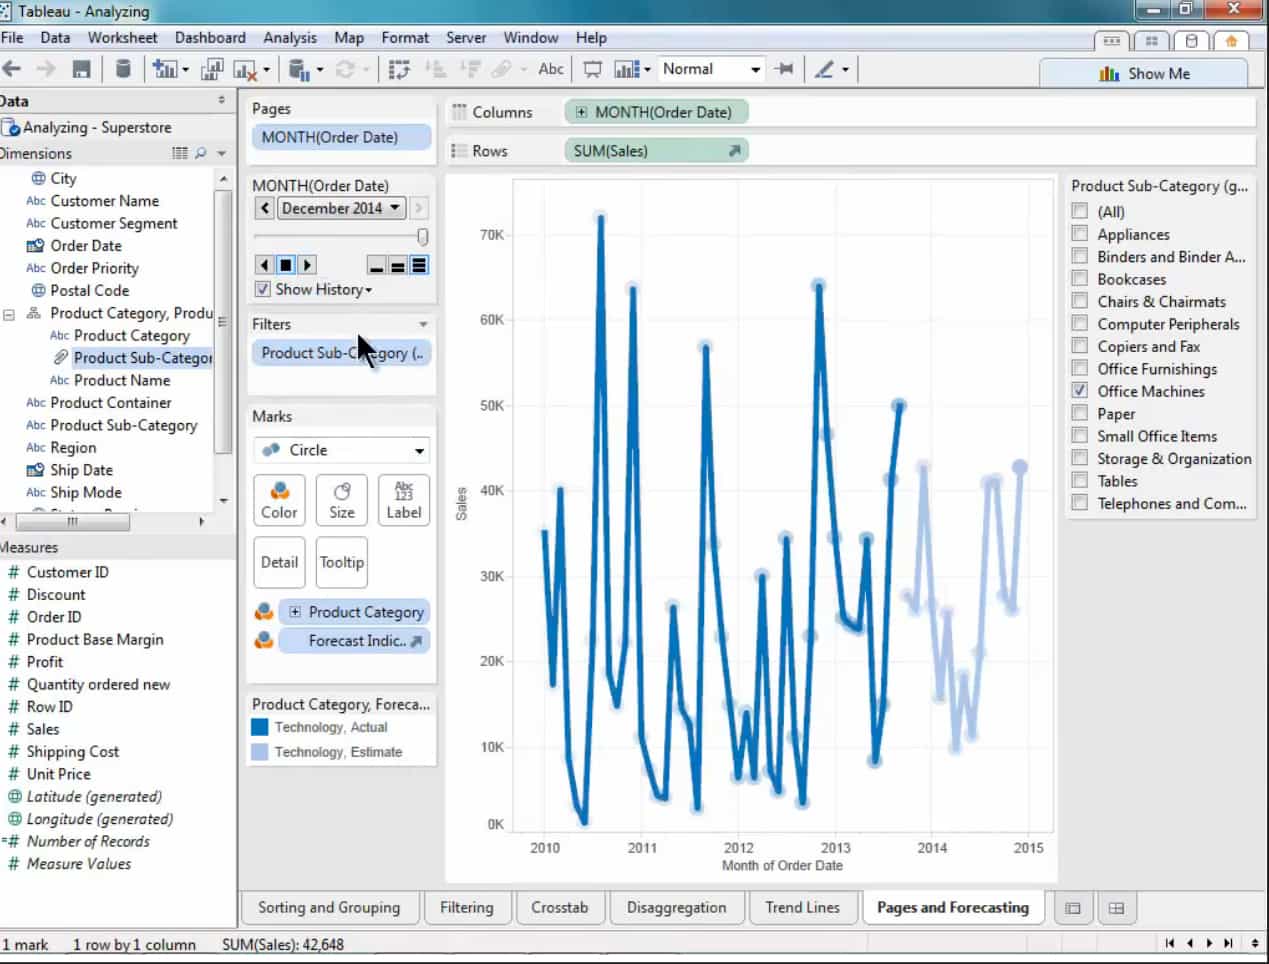
Now the light blue line shows the forecasted value. Notice the forecast is picking up the declining trend that is apparent in the history and replicating this history.
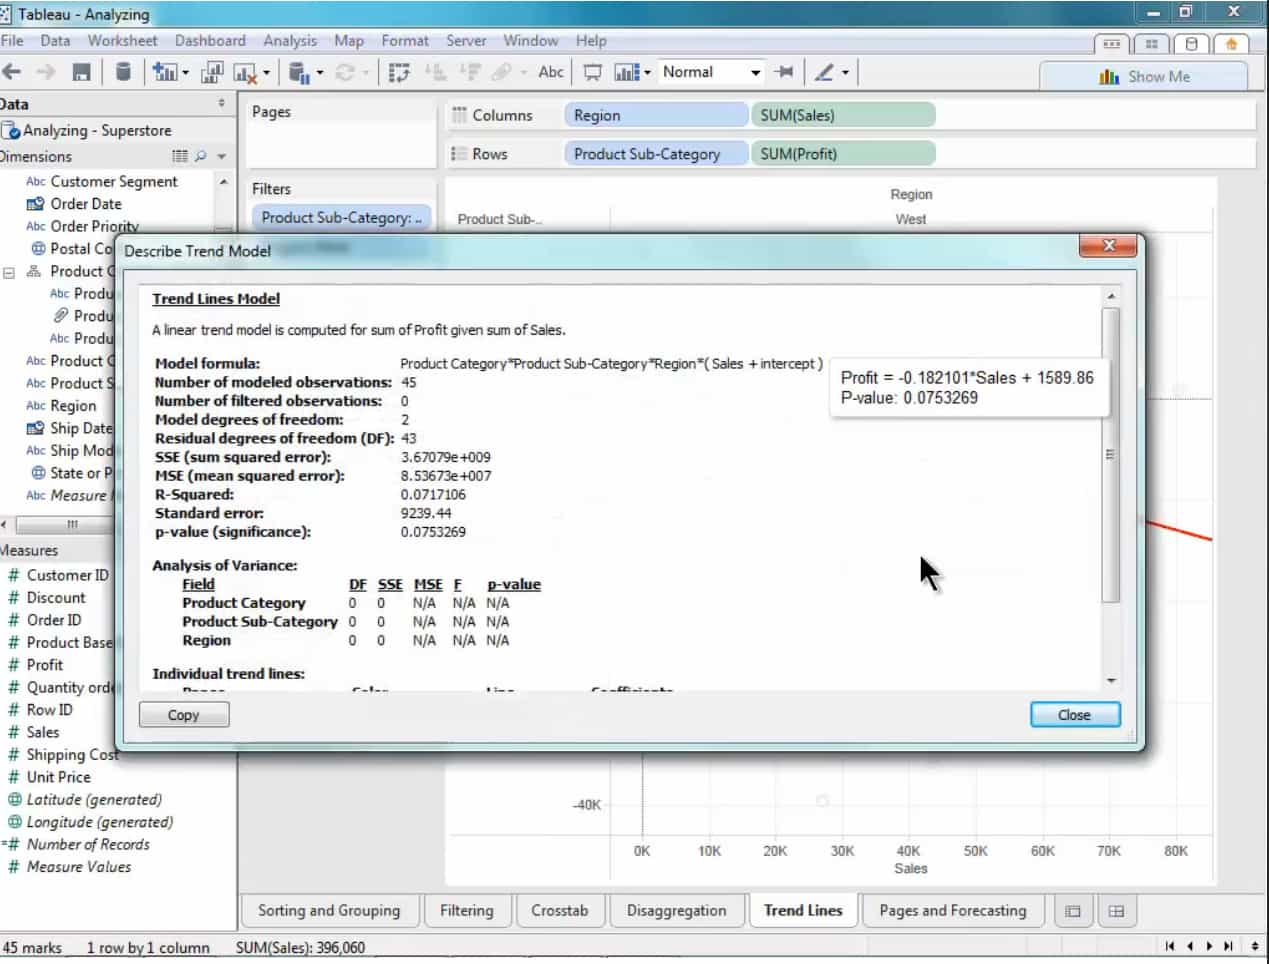
Tableau will show some forecasting statistics – by selecting to view the Model.
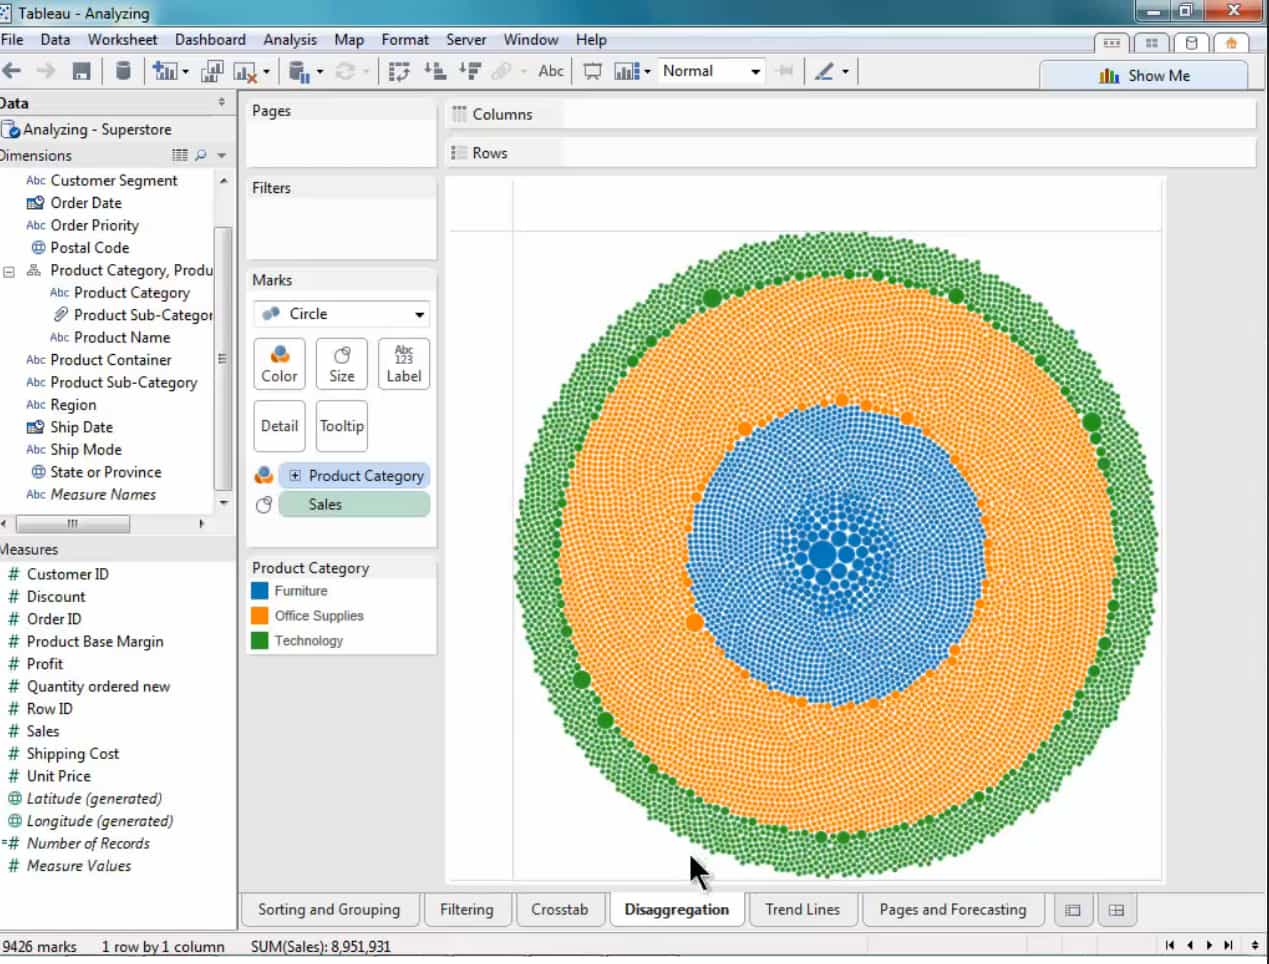
Probably the most exciting feature of forecasting in Tableau is the ability to perform analytics in addition to performing prediction. Here the view has been switched to provide the data points in one of Tableau’s excellent analytic views. Multiple tabs can be kept open, allowing the user to change between any analysis and forecasting.
Forecasting in Tableau is one of the most interesting things we have ever tested in software. Tableau is not a forecasting application that is a direct competitor with any of the applications on this list. A standard statistical demand planning application is designed to forecast large numbers of products and product locations combinations. Tableau is just the opposite; it has created what is referred to as an exploratory forecasting application. Tableau’s strength is not the forecasting algorithms; those can be found in greater depth in any of the significant demand planning applications – Tableau’s unique offering is the combination of statistical forecasting along with the most potent analytical front end.
Combined with analytics, it would allow an experienced user to do a very detailed and in-depth analysis of various dimensions and measures. Tableau has the most flexible data environment we have tested, and applying this new technology to forecasting we predict will yield some fascinating results. Tableau can be an excellent prototype environment. Once Tableau is used to determine what to do, the improved forecasting approach can be used then configure other demand planning applications to run the same approach repeatedly. It could also lead to new ways of preparing the data before it is even entered into the forecasting system. We would look forward to using the application for uncovering forecasting relationships that have never been discovered at many companies.
This forecasting functionality is still new. Tableau will we think to develop it more in the future. Tableau does not offer a separate forecasting application, so we struggled with where to categorize this functionality, but we decided upon the demand planning area, as we wanted to make sure that those looking specifically into demand planning applications were aware of Tableau. Its forecasting functionality is just another reason to migrate to Tableau for BI.
MUFI Scores
All scores out of a possible 10.
MUFI Scores
- Ma. = Maintainability
- Us. = Usability
- Fu. = Functionality
- Im. = Implementability
| App | Ma. | Us. | Ft. | Im. | Cat. |
|---|---|---|---|---|---|
| Average Score for Big ERP | 5.1 | 4.8 | 5.2 | 5.4 | Big ERP |
| Average Score for CRM | 6.2 | 6.2 | 5.1 | 5.9 | CRM |
| Average Score for Small and Medium ERP | 8.3 | 8 | 6.7 | 8.5 | Small and Medium ERP |
| Average Score for Finance | 8.8 | 8.8 | 8 | 8.8 | Finance |
| Average Score for Demand Planning | 7.6 | 7.2 | 7 | 7.1 | Demand Planning |
| Average Score for Supply Planning | 6.7 | 6.9 | 7 | 6.8 | Supply Planning |
| Average Score for Production Planning | 6.8 | 6.9 | 7 | 6.9 | Production Planning |
| Average Score for BI Heavy | 5.5 | 5.3 | 6.9 | 5.3 | BI Heavy |
| Average Score for PLM | 7 | 7.2 | 6.8 | 7.3 | PLM |
| Average Score for BI Light | 7.7 | 8.7 | 9 | 8.3 | BI Light |
| Arena Solutions Arena PLM | 10 | 10 | 10 | 10 | PLM |
| AspenTech AspenOne | 4 | 8 | 10 | 7 | Production Planning |
| Birst | 8 | 8.5 | 10 | 8 | BI Light |
| ERPNext | 10 | 10 | 7.5 | 10 | Small and Medium ERP |
| Delfoi Planner | 8 | 6 | 6.5 | 7 | Production Planning |
| Demand Works Smoothie SP | 9 | 10 | 7 | 10 | Supply Planning |
| Hamilton Grant RM | 10 | 9 | 8.5 | 9 | PLM |
| IBM Cognos | 2.7 | 3 | 1.5 | 3 | BI Heavy |
| Infor Epiphany | 7 | 8 | 6 | 5 | CRM |
| Infor Lawson | 8 | 7 | 6 | 7 | Big ERP |
| Intuit QuickBooks Enterprise Solutions | 9 | 9 | 5 | 9 | Finance |
| JDA DM | 9 | 7.5 | 8 | 8 | Demand Planning |
| Microsoft Dynamics CRM | 2 | 3 | 2 | 2 | CRM |
| NetSuite CRM | 6 | 4 | 3 | 3 | CRM |
| Netsuite OneWorld | 7 | 7 | 8 | 8 | Big ERP |
| OpenERP | 7 | 8 | 8.5 | 8 | 7 |
| Oracle BI | 4 | 4 | 3 | 6 | BI Heavy |
| Oracle CRM On Demand | 4 | 5 | 3 | 5 | CRM |
| Oracle Demantra | 5 | 3 | 3.5 | 4.5 | Demand Planning |
| Oracle JD Edwards World | 4 | 1 | 3 | 6 | Big ERP |
| Oracle RightNow | 6 | 7 | 4 | 5 | CRM |
| PlanetTogether Galaxy APS | 10 | 10 | 10 | 10 | Production Planning |
| Preactor | 8 | 7 | 3 | 7 | Production Planning |
| QlikTech QlikView | 9 | 9 | 10 | 9 | BI Light |
| Rootstock | 9 | 8 | 9 | 9 | Small and Medium ERP |
| Sage X3 | 8 | 8 | 7 | 8 | Big ERP |
| Salesforce Enterprise | 8 | 8.5 | 9 | 7.5 | CRM |
| SAP APO DP | 3 | 4 | 3 | 2 | Demand Planning |
| SAP APO PP/DS | 2 | 2 | 4 | 3 | Production Planning |
| SAP APO SNP | 3 | 4 | 8 | 4 | Supply Planning |
| SAP BI/BW | 1.5 | 2 | 4 | 2 | BI Heavy |
| SAP Business Objects | 3 | 2.5 | 7 | 3 | BI Heavy |
| SAP CRM | 4 | 3 | 6 | 4 | CRM |
| SAP ECC | 3 | 3 | 6.5 | 3 | Big ERP |
| SAP PLM | 1 | 2.5 | 2 | 3 | PLM |
| SAP SmartOps | 4 | 4 | 7 | 5.5 | Supply Planning |
| SAS BI | 6.5 | 7 | 9 | 6 | BI Heavy |
| SAS Demand Driven Forecasting | 7 | 8 | 9 | 7 | Demand Planning |
| Tableau (BI) | 9 | 10 | 10 | 10 | BI Light |
| Tableau (Forecasting) | 10 | 8 | 5 | 9 | Demand Planning |
| Teradata | 8 | 6.3 | 9.7 | 6 | BI Heavy |
| ToolsGroup SO99 (Forecasting) | 7 | 8 | 9 | 7 | Demand Planning |
| ToolsGroup SO99 (Supply) | 5 | 6 | 10 | 7 | Supply Planning |
Vendor and Application Risk
Tableau forecasting is not a separate application from Tableau “BI.” Forecasting is simply another thing that Tableau can do in addition to analytics. Forecasting is simply an added benefit that companies that use Tableau receive from the application. The main risks with Tableau are how well the users are trained to configure and set up the application. After this, the forecasting portion is simple. Tableau does not have sophisticated forecasting functionality, and this makes the use of Tableau for low forecasting risk.
Likelihood of Implementation Success
This accounts for both the application and the vendor-specific risk. In our formula, the total implementation risk is application + vendor + buyer risk. The buyer specific risk could increase or decrease this overall likelihood and adjust the values that you see below.
Likelihood of Application Implementation Success and Failure
Search for the application in this table using the search bar in the upper right of the table.
| Application | Prob of Implementation Success | Prob of Implementation Failure |
|---|---|---|
| Actuate | 0.77 | 0.23 |
| SAP Smartops | 0.39 | 0.61 |
| NetSuite CRM | 0.46 | 0.54 |
| Sugar CRM | 0.62 | 0.48 |
| Base CRM | 0.91 | 0.09 |
| SAP CRM | 0.35 | 0.65 |
| Salesforce Enterprise | 0.72 | 0.28 |
| QlikTech QlikView | 0.82 | 0.18 |
| Tableau (BI) | 0.98 | 0.02 |
| SAP Crystal Reports | 0.46 | 0.54 |
| Brist | 0.83 | 0.17 |
| MicroStrategy | 0.7 | 0.3 |
| SAS BI | 0.76 | 0.24 |
| Oracle BI | 0.35 | 0.65 |
| IBM Cognos | 0.23 | 0.77 |
| Infor Epiphany | 0.58 | 0.42 |
| Microsoft Dynamics CRM | 0.26 | 0.74 |
| Oracle RightNow CRM | 0.41 | 0.59 |
| Oracle CRM On Demand | 0.36 | 0.64 |
| Teradata | 0.76 | 0.24 |
| SAP Business Objects | 0.32 | 0.68 |
| SAP BI/BW | 0.25 | 0.75 |
| SAP PLM | 0.29 | 0.71 |
| Hamilton Grant RM | 0.89 | 0.11 |
| Arena Solutions | 0.96 | 0.04 |
| Delfoi Planner | 0.7 | 0.3 |
| Preactor | 0.64 | 0.36 |
| PlanetTogether Galaxy APS | 0.96 | 0.04 |
| AspenTech AspenOne | 0.55 | 0.45 |
| SAP APO PP/DS | 0.27 | 0.73 |
| Demand Works Smoothie SP | 0.93 | 0.07 |
| ToolsGroup SO99 (Supply) | 0.82 | 0.18 |
| Demand Works Smoothie | 0.96 | 0.04 |
| Tableau (Forecasting) | 0.9 | 0.1 |
| SAS Demand Driven Forecasting | 0.82 | 0.18 |
| ToolsGroup SO99 (Forecasting) | 0.86 | 0.14 |
| JDA DM | 0.57 | 0.43 |
| Oracle Demantra | 0.33 | 0.67 |
| SAP APO DP | 0.28 | 0.72 |
| FinancialForce | 0.92 | 0.08 |
| Intacct | 0.98 | 0.02 |
| Intuit QB Enterprise | 0.8 | 0.2 |
| ERPNext | 0.9 | 0.1 |
| OpenERP | 0.78 | 0.22 |
| Rootstock | 0.91 | 0.09 |
| ProcessPro | 0.93 | 0.07 |
| Microsoft Dynamics AX | 0.4 | 0.6 |
| SAP Business One | 0.49 | 0.51 |
| Sage X3 | 0.62 | 0.38 |
| Infor Lawson | 0.58 | 0.42 |
| Epicor ERP | 0.4 | 0.6 |
| Oracle JD Edwards World | 0.31 | 0.69 |
| Oracle JD Edwards EnterpriseOne | 0.36 | 0.64 |
| SAP ERP ECC/R/3 | 0.32 | 0.68 |
| NetSuite OneWorld | 0.65 | 0.35 |
Risk Definition
See this link for more on our categorizations of risk. We also offer a Buyer Specific Risk Estimation as a service for those that want a comprehensive analysis.
Finished With Your Analysis?
To go back to the Software Selection Package page for the Demand Planning software category. Or go to this link to see other analytical products for Tableau.
Part of the Following Software Categories
Select the following link(s) if you have subscribed to the following analytical product(s).