
How to Best Calculate Reorder Points and the Brightwork Reorder Point Calculator
Executive Summary
- This is an introduction to reorder points and how to use the reorder level vs. the reorder quantity.
- The Brightwork ROP calculator sets a dynamic reorder point.
Introduction
Reorder points have essential details concerning their implementation in systems. A reorder point or reorder point planning has a great deal of flexibility in its application. You will learn about reorder points and how they are set in production systems, and you will be able to use the Brightwork reorder point calculator embedded in this web page.
Our References for This Article
If you want to see our references for this article and related Brightwork articles, see this link.
The Significance of Reorder Points
Reorder level and reorder quantity planning are significantly underestimated. This is because companies so frequently overestimate their ability to effective forecast. Most companies can’t leverage even basic forecasting functionality, which is available. This functionality has been available within forecasting applications for years.
Reorder level and reorder quantity work well for both highly forecastable and challenging to forecast products. Any product that received a level forecast assignment using the best-fit procedure can have its supply planning emulated using a reorder point.
There are several benefits to placing a substantial portion of the company’s product database on a reordering level and reorder quantity.
- It saves time.
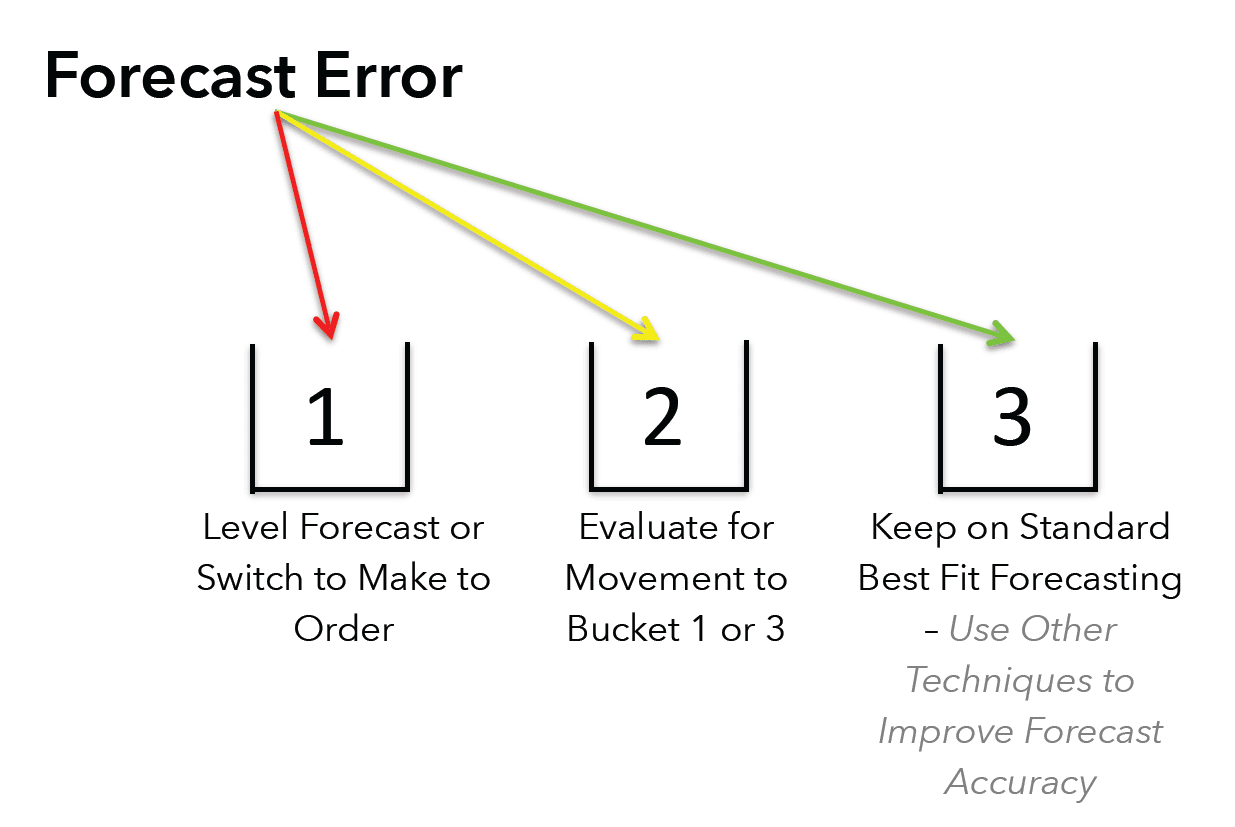
- It allows the company to focus on those products that can be improved through forecasting.
The graphic below explains this.
Order Point Versus Reorder Point
The term order point is infrequently used. People most often use the term reorder point rather than order point. However, the order point and reorder point is the same thing. An order point is a level of inventory where an order is generated. Rather than an order point, a reorder point simply implies that the ordering is perpetual.
The Uses of Dynamic Reorder Level and Reorder Quantity
The beautiful thing about the dynamically reorder point calculation is that it adjusts across the following dimensions:
- Service level
- Lead time and forecast error both in variability (for lead time and forecast error) and lead time duration.
Dynamic Reorder point analysis can be used for an SKU or any aggregation level. For instance, this form can model an entire company’s inventory and supply chain. The overall or average values can be used instead of entering the values for a single SKU.
This allows one to see the relationships between service level and the total amount of stock carried. This can also create a service level to the inventory curve. An inventory service curve is something that many companies do not have.
It will not, of course, include the total stocking level. So, the overall stocking level should be estimated and added. Only the reorder point should flex — while the cycle stock should stay the same.
Using Dynamic Reorder Level and Reorder Quantity in Production Systems
As is discussed in this article, reorder points can be set in some ways in systems like SAP SNP, ToolsGroup, or Demand Works Smoothie.
Most importantly, they can set to work without a forecast or with a forecast.
One of the confusing things about setting up a reorder level and reorder quantity is what to do with the forecast generated for the products that are moved to the reorder level and reorder quantity or reorder point. A prediction is still required for things like budgeting. It still makes sense to generate a forecast for them. Another reason is that products set on the reorder point — don’t necessarily stay on the reorder point in the future — and vice versa.
The demand history will tell the company when a product should be moved to reorder point planning. It will also tell the company when a product should be moved away from reordering point planning. That is when it is to become an actively forecasting item.
What Makes This Reorder Point Calculator Unique
Most of the reorder point calculators that online calculate a static reorder point typically based upon lead time, safety stock, stock, and sales.
There is no measure of variability in either lead times or the forecast, and it asks the user to input the safety stock and the stock. However, variability dramatically changes the safety stock – part of the reorder point calculation. Most of these online calculators are not helpful to people who need to see the relationships between multiple factors and who don’t have the stock information and require estimates.
The authors seem to have done the minimum work to say their website has a safety stock calculator.
The calculator below does not ask for existing or safety stock but for variability. If the variability is unknown, then zero standard deviations can be added to the form — to hold those values primarily static.
ROP Formula, or Reorder Point Formula
- An ROP or reorder point formula are all synonyms for the same thing.
- An ROP or reorder point formula is used to determine the reorder point.
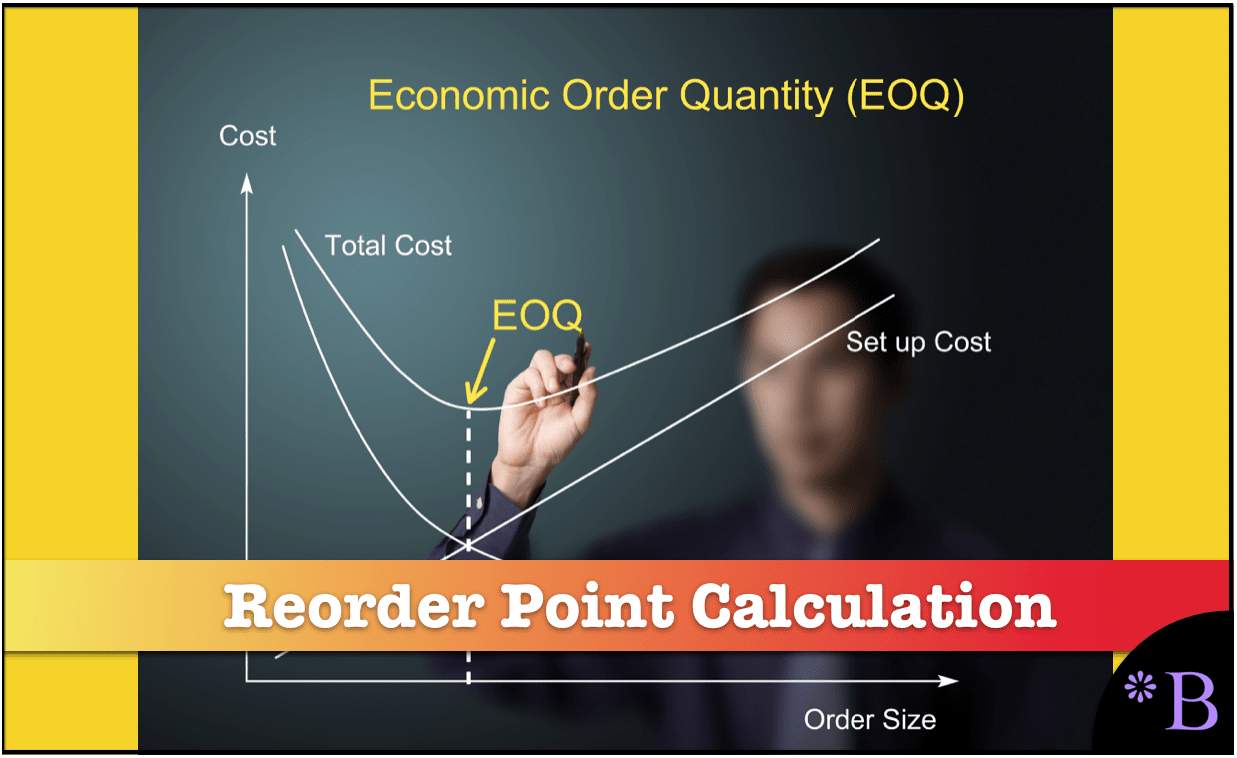
- The reorder quantity formula shows the amount to be ordered once the reorder point is reached. A reorder quantity formula is often called an economic order quantity.
How the Calculation Form Works
This reorder point calculator provides the intermediate values and explanations so that the overall logic of the dynamic reorder, both students and practitioners, can fully understand the point calculator.
This form requires input to provide output. However, it also has default values. You can change any input value, and the rest of the formula — the output will change immediately. You can continue making changes, and the form will always update without pressing any button or refreshing.
Note: For some reason, the drop-down field below does not appear to work in Firefox – so if you are using that browser, try a different one. Second, when you enter a decimal into the Standard Deviation of Demand and Standard Deviation of Lead Time, you may receive a message “Please enter only digits.” You can ignore that message. The calculator works fine with a decimal point.
To determine the EOQ, see the EOQ calculator. See this link.
How Should EOQ and Other Supply Planning Parameters be Calculated?
One would be able to, for example:
Item #1: Simulation
Set the supply planning parameters in a way that one can simulate the impact on the overall supply plan. When using supply planning systems, inventory parameters are typically managed on a "one by one" basis. This leads to individual planners entering values without considering how inventory parameters are set across the supply network.
Item #2: Interactivity of Changes
This is the ability to see the relationship between changes to service levels and the simulated output.
Item #3: Seeing Financial Implications
This is the ability to see the impact on the dollarized inventory for different aggregate settings.
Item #4: Mass Change for Efficient Maintenance
This allow the parameters to be changed en mass or as a mass change function. Both supply planning systems are designed to receive parameters; they are not designed to develop the parameters.
 Getting to a Better Parameter Setting Capability
We developed an approach where EOQ and reorder points are calculated externally, which allows for a higher degree of control. And for the average inventory to be coestimated in a way that provides an observable total system inventory, holding cost, service level, and a picture of what is happening to the overall system. Calculating individual parameters like EOQ without an appreciation for the systemwide does not make any sense. Also, in many, perhaps even most cases, there is no reason to use EOQ for the purposes given above. Instead, an alternative custom order batching method can be created to replace EOQ. There is nothing magical about EOQ. It is not a "best practice." It will not provide you with "digital transformation." It is not "Six Sigma." You will not get a "black belt" for using it.
After observing ineffective and non-comparative supply planning parameter setting at so many companies, we developed, in part, a purpose-built supply planning parameter calculation application called the Brightwork Explorer to meet these requirements.
Few companies will ever use our Brightwork Explorer or have us use it for them. However, the lessons from the approach followed in requirements development for supply planning parameter maintenance are important for anyone who wants to improve order batching and supply parameters.