How to Best Estimate The Costs of Attaining Fill Rate
Executive Summary
- Service level has two primary measurement methods, order fill rate, and case fill rate.
- Companies estimate the fill rates they achieve incorrectly.
Introduction
There is no hard and fast rule on how high a fill rate should be. Many companies set their fill rate as part of a strategy to differentiate themselves and place themselves as a reliable supplier in the market without quantifying what the financial benefit is to a particular service level.
Order Fill Rate Versus the Case Fill Rate
There are two basic types of ways of measuring the fill rate. One is the order fill rate, and the other is the case fill rate. The order fill rate is measured for the entire order while the case fill rate is measured at the unit of measure (obviously frequently a case) in which the product is sold. In cases where the order quantity is equal to the case quantity (as in one case is ordered), the order fill rate and the case fill rate converge. But in all other cases, the order fill rate and case fill rate are different.
The order fill rate is how many orders are filled to completion. So if we imagine an order for 10 cases of the product was placed on an order. And if 9 of the 10 cases were fulfilled, then the order fill rate would be 0%, while the case fill rate would be 90%. So 90% of the cases were filled on the order. The case fill rate is a more stringent metric.
However, which metric makes more sense?
While the case fill rate would seem more accurate, it often depends on the product.
- If the product is oranges, it is unlikely that the customer would reject the order or be all that perturbed if they can only receive 9 of the 10 cases or oranges they ordered. Therefore, in the case of oranges, the case fill rate works quite well to measure customer satisfaction.
- In the case where a particular number of the product is required, such as some technical item used in a repair, the company could very easily lose the entire order if the case fill rate was 90%. And if it does not lose that order, it may lose a future order.
When most people use the term fill rate, however, they usually are describing the order fill rate.
High Fill Rate as a Differentiator 100% of the Time?
All the companies I have consulted with seem to think a high fill rate is a differentiator for them. Curiously, these companies could all feel the same thing. Are there no companies that compete on a lower price and lower service level? If not, maybe they should think about it — because there is less competition in that area of the market.
Are Companies Estimating Actual the Fill Rate Properly?
One of the problems with service level setting is the vast majority of companies don’t have any way of estimating the cost of the fill rate they currently provide. Without numbers, it becomes assumed that a higher fill rate is always better. But what is the cost?
Complex Versus Simple Fill Rate Estimation
Companies have to make these decisions all the time. For instance, a sandwich shop could stay open more hours, and no doubt, gain more sales and customer goodwill by doing so. (This is, of course, one dimension of service level, another could be how many people that order a sandwich are pleased with the sandwich, how long it takes the customer to get their sandwich). But, by staying open more hours will often mean diminishing marginal utility. It is relatively easy for the owner of a sandwich shop to determine how early and how late to be open. They can simply see what the busy times are. Identifying service levels for a company, particularly one with large specialized departments, such as sales, production, inventory management, finance, is far more challenging.
Sales as the Service Level Champion
If one looks at the major proponent of high service levels, it is invariably sales. However, sales reap all of the benefits of high service levels and none of the costs. For a salesperson, the ideal service level is, of course, 100%. Furthermore, the salesperson wants the company to carry the broadest possible product line.
They want each product in the product line provided at a 100% service level. This will maximize the commission of the salesperson, but it is not profit maximizing or even feasible for a company to do this because each of these items must be procured/made /stored -, etc. All of which incurs costs.
- For production and inventory management, they have different incentives. They want to keep costs reasonable and limit complexity.
- A plant manager does not want to run 150 products on one line, and the inventory manager does not want to carry a large number of items. Possibly 2/3rds of these products might have weak sales and are challenging to forecast.
A Lost Sale
This is an issue faced by many companies. Many, if not most businesses, make their supply chains challenging to manage. They do this by not analyzing the requests for marketing and sales to increase product proliferation and service level.

The decision of what the lost sale should be set to in a cost optimizer should be based, at least partially, on the types of products that they make. One example of a product that could have a lower lost sale cost set for it is the iPad 2.
In all those months where the iPad was capacity constrained and could not meet demand, it is doubtful Apple lost much long-term revenue. It is a highly differentiated product with few real competitors in the market. Soda, on the other hand, has many competitors in the store. However, in some cases, if one flavor is out on one drink, customers will transition to another taste.
Cost optimization software has a false assumption built into it. The idea, as presented in software sales presentations, is that the cost optimizer can help minimize costs.
The way this is done, according to the pitch, is that the company’s costs are entered into the system, and the system will trade-off the costs by controlling the activities that incur costs in such a way as to minimize the overall costs. This sounds reasonable, but if we take one example of the costs to be reduced and analyze it, we can see some flaws in the assumption.
The Cost of a Lost Sale
One of the major costs in cost optimization is the cost of a lost sale. It is an implicit cost that is created to provide an incentive to the optimizer to meet demand. Cost optimization has no other control, which makes it try to meet demand.
Without a cost for a lost sale, the system would not generate any production or procurement orders, because moving the machinery of the supply chain incurs costs with every action. The problem with setting the cost of a lost sale has been a long-term one and applied even to companies that don’t use cost optimization supply planning software. This is noted by George Plossl in his book in 1985.
“Out-of-Stock Costs: An equally difficult problem arises when an attempt is made to determine out-of-stock costs. Customer dissatisfaction with back orders may be very costly, but it is difficult—if not impossible—to assign a specific value to it with any degree of accuracy. One back order may cause little or no customer inconvenience, while the next may be the reason that the customer buys elsewhere n the future. The stock out cost, like the inventory carrying cost, is an artificial concept demanded by the mathematical formulas which have been derived to assist in making inventory decisions. We should not, however, be so “beguiled by the mathematical convenience” of having such a number that we lose sight of the real implications of such decisions or their aggregate effects.” – George Plossl
Determining the Cost of Lost Sales
The first thing that people new to cost optimization for supply planning think of on a lost sale is the profit margin. So if a company makes $4.00 on a product in gross margin when a product is sold, then $4.00 could be entered as the cost of a lost sale. Even if the cost to produce an item were $4.00, the system would choose to stock less than a 50% service level, because there are other costs required to get the item to the shelf (transportation, storage, etc..). Therefore, nothing close to the gross margin can be used to drive to a commonly acceptable service level (i.e., 92, 95, or 98%).
Therefore, the costs that are entered must be higher than the gross margin. One of the most common mistakes I see in cost optimization projects is that the costs are ridiculously high, in some cases 100s or 1000s of times greater than the costs which balance a lost sale cost. What companies are trying to do is drive to a high service level, but with a tool that has no inherent appreciation for any service level. This results in a solution that carries too much inventory and actually over commits resources.
Setting Ridiculously High Costs of a Lost Sale
The way to meet with positive reinforcement in the supply chain is to discuss how vital the service level is. I have had companies that can readily substitute products for customers. That is without the customer minding very much. The businesses that make a small gross margin tell me how important it is that service levels are kept extraordinarily high. I often hear 99.5% for some reason.
How was this exact number determined? It is never explained, and the fact that mathematical modeling shows that this level of inventory is too expensive actually to maintain does not make an impact on the listener. Often the response will be “well, its a target.”
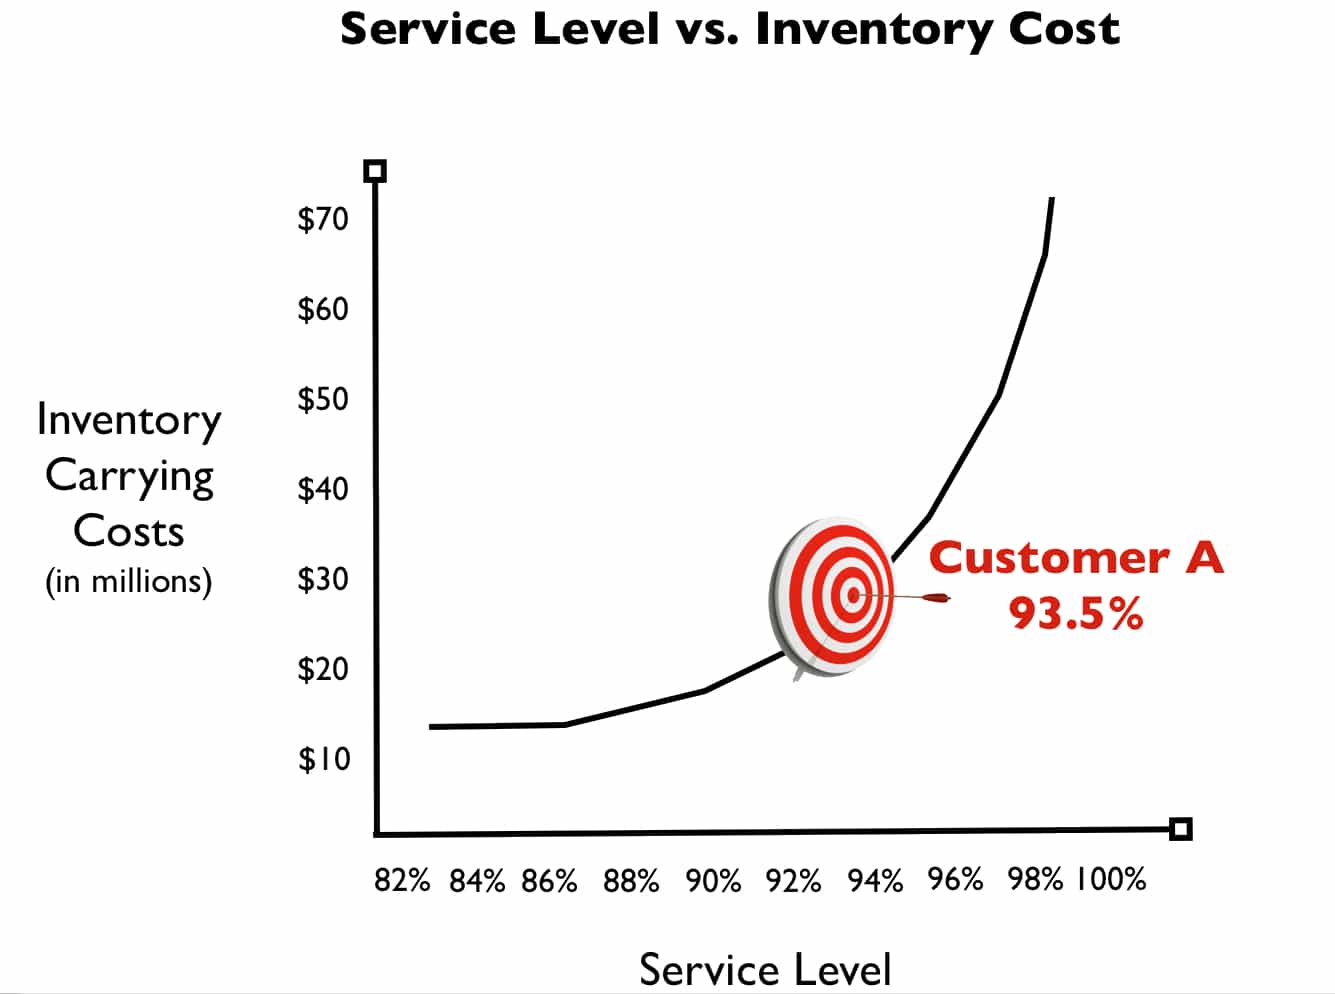
Companies are supposed to analyze the profitability implications of different service levels. This is infrequently done. A way to start is to use an inventory optimization and multi-echelon application that can very accurately calculate inventory costs for different services levels. This can be utilized as a base, in which storage costs, transportation costs, and other overhead can be added to. However, because companies do not quantify this, they are left guessing as to what an excellent service level should be.
Sustainable Service Levels
Few companies, one which I previously profiled is Trader Joe’s in this article, that Trader Joe’s designs their product offering to not only maximize sales but also with an eye towards sustainability and supply chain efficiency.
All of what is written above is said in substantially the same way in a book by George Plossl and Oliver Wight published in 1967.
“In a large manufacturing company today, the responsibilities for customer service rests with one organizational group, the sales department, which seldom recognizes much responsibility for either plant efficiency or for the levels of inventory. On the other hand, manufacturing people usually feel little responsibility for inventories and perhaps little more for customer service. In fact many plant managers and foremen have probably never though of their activities from a customer’s point of view. Frequently the performance of these people is measured not on their contribution to the overall company objectives but only on their ability to meet their own limited goals. Very few foremen, for example are rated on their ability to control lead times and keep items in stock, but they know that their careers depend greatly on their ability to get out production and meet their budget goals. By the same token, very few sales personnel are judged by their contribution to profit, but are rated instead solely on their ability to sell products.” – Production and Inventory Control: Principles and Techniques
Both service level and product proliferation should be analyzed. If we just stay at the service level, there is a way to determine the trade-off both per product and in aggregate. Let us begin in total.
The Actual Fill Rate Attained
In a study of service levels, it was found that companies that listed their delivered service level as 97 to 98% achieved a 92% fill rate.
There are many ways to falsify service level — with the back order being the most common.
- When a product is put on backorder, most companies do not count that against service level. Although it apparently should count against service level as the product was not available when requested.
- Other service levels are confusing because some products are substitutable. In the paint market, if one color is not available, the paint store can mix several paints of the same brand to arrive at the desired color.
In situations like this, it becomes tough to determine an accurate service level value.
Service levels are a bit like forecast error. They are often stated with high confidence. But once you get into the details, the numbers often move around quite a bit. The actual measurement becomes about the assumptions that are accepted.
Conclusion
One important feature to work out first is what a company means when it says, “fill rate.” For instance, is this an order fill rate or a case fill rate. The difference is quite important because the case fill rate is a more stringent measurement than the case fill rate.
There is a way to determine the trade-off between costs and carrying more inventory and higher service levels. Optimally a logical and mathematical analysis of this type would be how the company would develop its service level and inventory strategy. This calculation can be performed in aggregate. That is either taking averages of all items, or aggregates of product groups. Or it can be applied to an individual product either for all locations or a single location.
Applications often assume that service levels are known by companies. In the vast majority of cases, the company has done no analytical work in determining its fill rate targets. Their fill rate targets are most often guestimates driven by sales of the service level they would like to have. Few companies have a mechanism for determining service levels based on trade-offs.
The costs of a lost sale can never be set with the gross or net margin, but must always be set significantly higher than this to arrive at the service levels that are expected. However, rather than placing astronomical costs in a lost sale field of cost optimizers that are 100s or 1000s of times the other expenses in the system, better costs should be scientifically developed.
Secondly, most companies labor under an illusion that both the service level that should be their target and their actual service level attainment. Inventory optimization and multi-echelon software can be now be acquired in desktop versions (i.e., not for production, but analysis), which can help companies determine what their service levels should be based upon costs and profitability.
References
I cover fill rates in the following book.
Plossl, George. Orlicky’s Material Requirement’s Planning. Second Edition. McGraw-Hill. 1984. (first edition 1975)
Plossl, George. Wight, Oliver. Production and Inventory Control: Principles and Techniques. Prentice Hall. 1967.