How to Best Calculate Ordering Cost for EOQ
Executive Summary
- We cover the Economic Order Quantity formula and the applicability of the Economic Order Quantity and EOQ and perishability and quantity discounts.
- EOQ can be calculated for both production and procured products.
Introduction: The Origins of the Economic Order Quantity
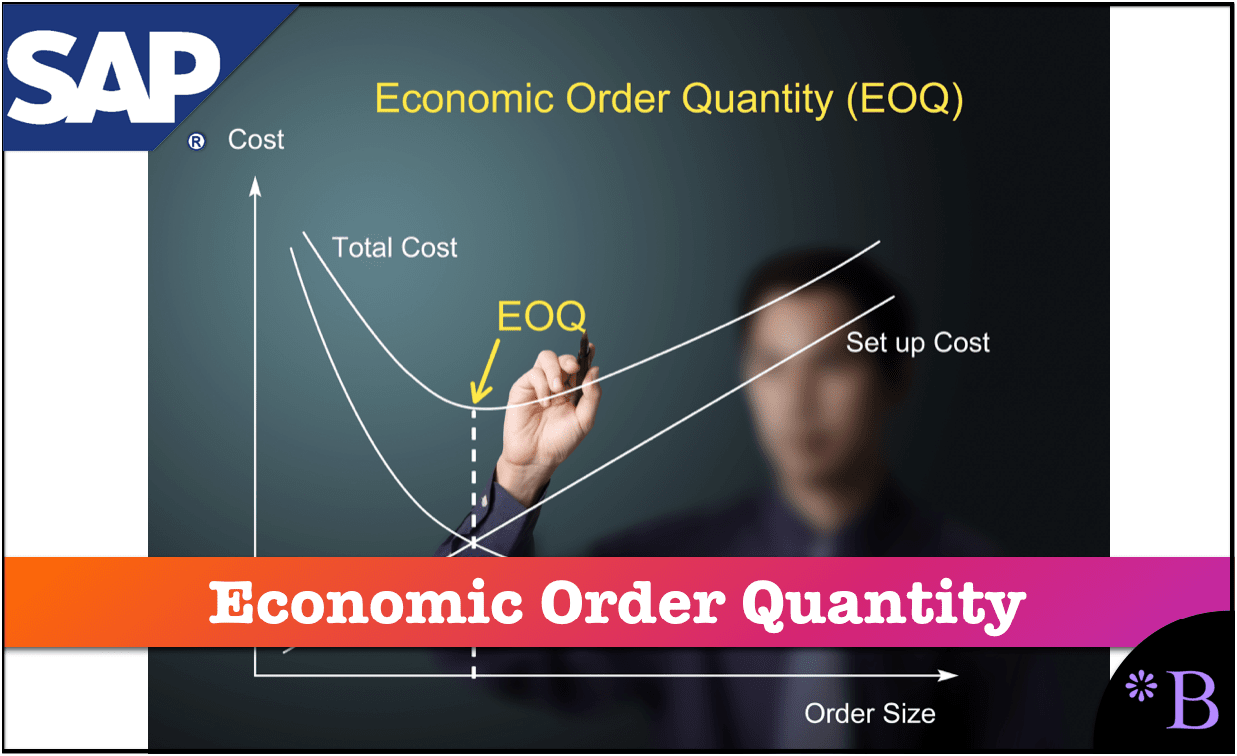
Economic order quantity (EOQ) is one of the oldest formulas in inventory management, and it preceded the development of ERP by many decades. Ford W. Harris first developed EOQ in 1913. Since its introduction, EOQ has been one of the most important and most durable formulas in inventory management. EOQ is a type of order batching. Order batching is a method of setting the order size such that it is considerate of various costs and considerations. Order size is something that all of us naturally do when we shop at a grocery store, although it is done more by feel than by calculation. EOQ is a well-known formula but is far less commonly used than generally through. You will learn about the calculation of EOQ, reorder points, and the other factors included in the computation of EOQ.
Our References for This Article
If you want to see our references for this article and related Brightwork articles, visit this link.
What is the Reorder Point?
The reorder point tells the system when to reorder, while the economic order quantity tells the system how much to order; as such, they are necessarily highly integrated values.
EOQ is one method for performing what is generally known as lot sizing. The lot size is the quantity in which the item is produced or procured, and therefore it is set at the production location combination in the product master. When an EOQ is generated for a purchasing decision, EOQ and production go by the name EPQ or economic production quantity. Lot sizing or batch sizing is necessary to made ordering economical. By the furtherest extension, if every EOQ or EPQ were a unit of “1,” it is easy to see that the overall supply network would be very high in cost.
Common Methods of Lot Sizing
Standard methods of calculating the lot size are the following:
- Lot for Lot: This is confusingly named because lot for lot is simply a lot size based upon the net requirements in a particular period. Therefore it is nearly no lot size. Using lot for lot sizing would be considered Lean as the company is only producing or procuring what it knows that it needs.
- Economic Order Quantity: This bases the lot size on a financial calculation.
- Periodic Order Quantity: This is simply the economic order quantity but stated in terms of a reorder frequency.
The Applicability of the Economic Order Quantity
Some have proposed that because EOQ does not automatically adjust with the variability of its inputs, it cannot be used for more product location combinations (PLC’s) with more variable demand history. This is true – if the data provided to the EOQ is not periodically changed. Therefore, it must be regularly recomputed for the entire product location database, and this will be addressed a little later in this article.
It would be relatively easy to make the EOQ formula continuously altered based upon changes in its inputs. But I have yet to see this functionality in any supply planning application.
Validity and Applicability of EOQ
EOQ was initially developed for production lot sizing. However, the book Factory Physics states the following for EOQ:
For example, in 1913, Harris published his original EOQ paper and established a precise mathematical standard for efficiency research with his famous “square root formula” for the lot size problem. While elegant, this formula relied on assumptions that – for many real world production systems – were highly questionable.
- A fixed, known setup cost
- Constant deterministic demand
- Instantaneous delivery (infinite capacity)
- A single product or no product interactions
Because of these assumptions, EOQ makes much more sense applied to purchasing environments than to the production environment for which Harris intended it. In a purchasing environment, setups (i.e. purchase orders) may adequately be characterized with constant costs. However in manufacturing systems, setup costs cause all kinds of other problems (e.g., product mix implications, capacity effects, variability effects). The assumptions of EOQ completely gloss over these important issues.
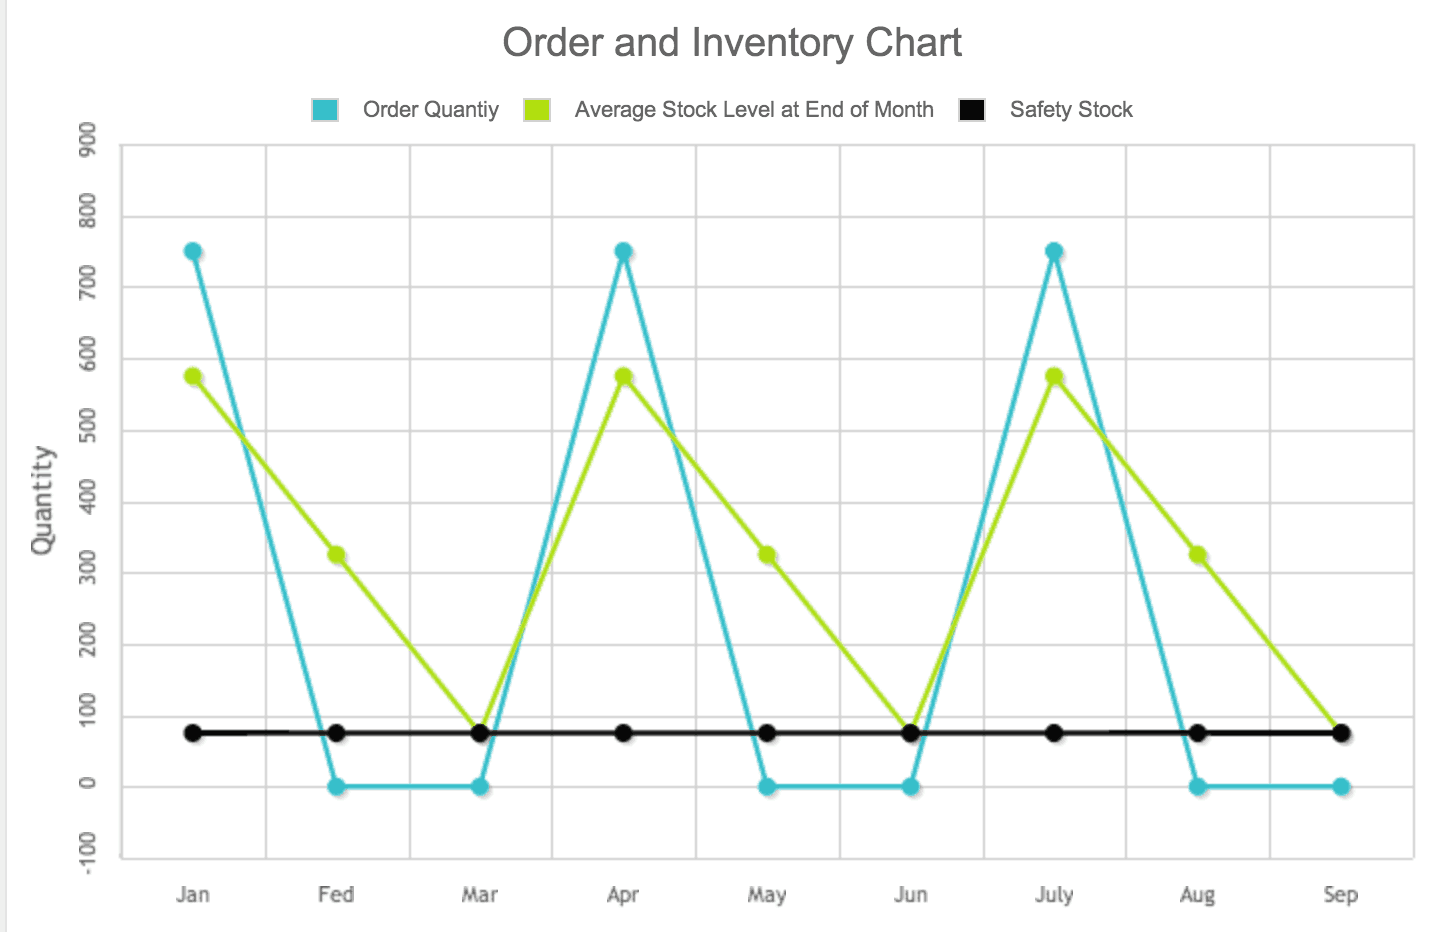
This is the very well-known sawtooth pattern, which is a feature of the stocking level rising to its highest point when a new procurement order is received, or new production order is completed. With the stocking level declining to its lowest point right before the procurement, the order is received or right before a new production order is scheduled. The minimum stock level should be the safety stock, which the inventory level may consume due to variability in demand or supply.
EOQ has some slight adjustments to the formula used to account for different requirements. The calculator included in this article calculates an EOQ in the case where the company wants to build inventory.
The Issue of EOQ and Perishability
There can be scenarios where the product’s shelf life does not allow for the full EOQ to be ordered. In this case, the EOQ formula should not be used, and the shelf lifetime converted into units should be used instead (Silver and Peterson).
EOQ and Product Revisions
The same issue applies to products that go through frequent revisions, where ordering the EOQ would or could result in significant obsolescence. EOQ must also be managed versus storage capacity. In general, storage capacity is less expensive than accepting increased costs through shorter production runs. However, this does not seem to influence companies because they cannot quantify how their production costs change from changing the length of production runs.
Therefore, philosophy rather than facts tend to rule the day, with a much higher focus on inventory and storage costs than production costs. Although this much depends upon the company. Some companies work exactly the opposite, focusing very little on reducing inventory and focusing on minimizing procurement costs through buying in vast and uneconomic quantities.
The question becomes quite a bit more grey for procured items where the costs to be traded off are quantity discounts and order costs.
Using Economic Order Quantity Formula in Live Systems
After EOQ’s calculation, it is most often placed into the minimum order quantity field, which all supply planning systems have.
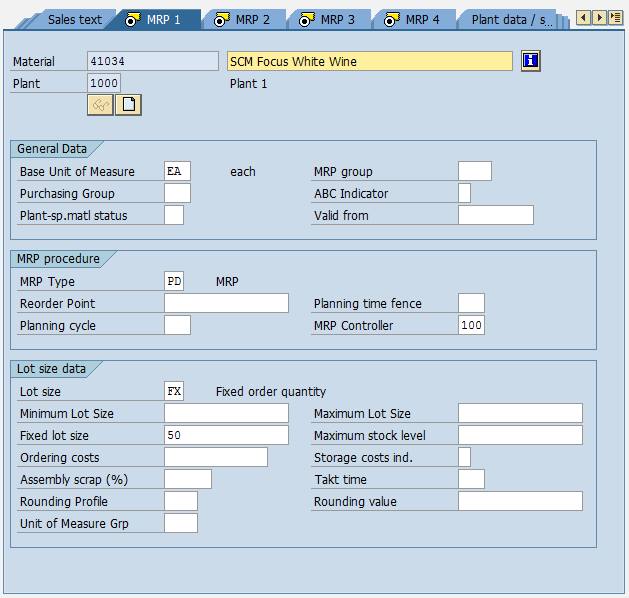
This is the Material Master in SAP ECC. Notice the various lot size fields and a Lot Size ordering method — which is set to “Fixed Order Quantity.”
This sets the minimum order level. However, sometimes other larger factors than this – such as when products must be purchased in rail carloads, put the actual minimum order level. In that case, no EOQ calculation is necessary. The minimum order quantity is the carload.
While the formula is one of the easiest in supply chain to calculate, many companies do not determine their unconstrained products (that is, unconstrained by minimum order sizes such as the example of the carload or minimum package quantities) on EOQ.
However, there is no reason aside from work effort not to do so – and in fact, the work effort is relatively low.
Economic Order Quantity and Forecast Error
The higher the forecast error, the less use the EOQ value is.
This is because as the forecast error increases, the likelihood that the quantity will be consumed declines. However, this is no different from any other supply planning parameter; supply planning parameters have the highest value when the forecast is most accurate. This is because they must adjust for a higher variability on the demand side.
EOQ and Quantity Discounts
If there are quantity discounts, the calculation below will not be accurate. For instance, the formula below may propose an EOQ of 184 units. If the price per each at this level is $50, then this is a total cost of (184 * $50) + 45 or $9,245. However, if the quantity discount kicks in at 200 units and this discount is 15%, then 16 more units could be obtained for $8,538. This would be a missed opportunity.
This can be easily calculated for an individual item, but this cannot be systematized because supply planning applications do not have EOQ functionality or even step function min lot sizes. Typically this is handled by procurement as they are up to date on the volume discounts and will increase the orders to meet the discount.
How Often is EOQ Actually Calculated?
For whatever reason, most companies don’t get around to calculating EOQ or, if they do calculate it, they do so very infrequently. The primary reason for this is a lack of resources to recalculate EOQ and a lack of tools to perform the calculation — even though the calculation is straightforward to calculate and there is an automated way to update lot sizes in inventory systems.
The Distinction Between Textbooks and Reality with EOQ
Students at university are often told that EOQ is frequently used in industry when it isn’t (this is just one of the misrepresentations of supply chain management on college courses and supply chain textbooks). But this does not mean that it should not be used. EOQ certainly adds value and quantifies and then trades off the highest costs for making an ordering decision. That is the truth of how understaffed supply chain management departments are. They often do not have the staffing to apply elementary inventory management techniques over 80 years old.
Deriving EOQ Order Cost or Cost Per Order
If the item in question is procured, then the standard term order cost or cost per order, which is often used with the EOQ formula, is correct.
EOQ For Procured Items
EOQ is often first introduced to people as the order cost or cost per order from a supplier. If you discuss this topic with companies, you will often hear order costs around $12 discussed. Many web pages estimate the ordering cost in the low teens. This is inaccurate and does not show appreciation for what the EOQ formula represents.
The order cost or cost per order for EOQ is supposed to moderate the number of orders that companies place, which means that the order cost or cost per order includes all the order costs. This includes not only the cost of placing the order in the system (which is the lowest cost portion of the order) but also the cost of receiving the order—the cost of moving the order into stock. The cost of tracking the order and following up if the order is not delivered, etc.. For this reason, once all the total ordering cost is considered, that is the cost of the initial order.
An order cost of between $60 to $75 seems reasonable for many items. However, certain things can be much higher than this. Larger, more difficult items to manage should receive more significant scale economies in the receipt and put away than smaller items. Once you move to order large units, such as industrial equipment, the order cost or cost per order rises again. But on the other hand, as a percentage of the item’s price, the order cost or cost per order cost may decline.
EOQ Internally Produced Items
If the EOQ is being calculated for an internally produced item, then the order cost or cost per order becomes the “ordering and setup/changeover cost.” This is the cost of changing the line over to a new product. Unfortunately, few companies have costings for their changeovers. Therefore, this usually takes some time to develop these costs.
EOQ and Production Planning
If the item in question is procured, then the standard term “ordering cost,” which is often used with the EOQ formula, is correct. However, if the EOQ is being calculated for an internally produced item, the order cost becomes the “ordering and setup/changeover cost.” This is the cost of changing the line over to a new product. This is because what is called the ordering cost is just the total costs for initiating the replenishment. Unfortunately, few companies have realistic costs for their changeovers. Therefore, it usually takes some time to develop these costs.
Conclusion
Order cost or cost per order estimation is tricky, and no one can say exactly what an ordering cost is for a particular item. Companies can use variable order cost or cost per order to change depending on the product.
For sure, the order cost or cost per order that is often presented on websites on the topic does not represent what the EOQ is meant to represent regarding the total order cost or cost per order.
To calculate the EOQ formula online, see our EOQ Calculator in this article.
Also, learn about the limitations of EOQ in this article.