
The 2021 Analysis of US Financial and Monetary Situation
Executive Summary
- 2021 is a tumultuous year, and questions have begun to arise regarding the US’s monetary policy.
- This article will analyze topics in this area.

Introduction
This article is designed to figure out the lay of the land for what to do in 2021 and forward regarding investing. The primary reason has been the US government’s and the Federal Reserve and US banking’s behaviors that have undermined the US monetary system and, therefore, the US dollar.
Our References for This Article
If you want to see our references for this article and other related Non Status Quo articles, see this link.
The Current State of Affairs
As this is written, the US is one year into the Coronavirus. Stocks are at all-time high levels while the normal economy has declined. Some stocks like Tesla are at dizzying heights.

Tesla is not at an all-time high but is close. Tesla now has a market capitalization as the 8th most valuable company in the world. Tesla is predicted to have 75 cent earnings per share for the first quarter of 2021, which means Tesla’s P/E ratio is 862.
This video makes the argument about the factors that likely drive future inflation.
The objective of the Federal Reserve for decades has been to prevent debt deflation by creating a series of increasingly large bubbles. This topic is covered in a series of quotations in the article Quotes from the Book The Everything Bubble.
Pushing Savings Accounts to Near Zero or Negative Interest Rates
This is why the savings rate has been driven into near zero territory, which is covered in the article Why is the Interest Rate on Saving Accounts Close to Zero. Actually once real inflation is taken into account, the interest rate on savings account is most likely zero (no one is sure exactly what the real inflation rate is, but it is very likely higher than the US Government reported inflation through their CPI). All of this is to promote individuals to seek higher returns and to invest and prop up the financial system.
The Run-Up in Bitcoin and Metals
Another concerning feature has been the run-up in Bitcoin. Bitcoin is a complicated topic, and it is covered in the article What is the Real Story With Bitcoin?
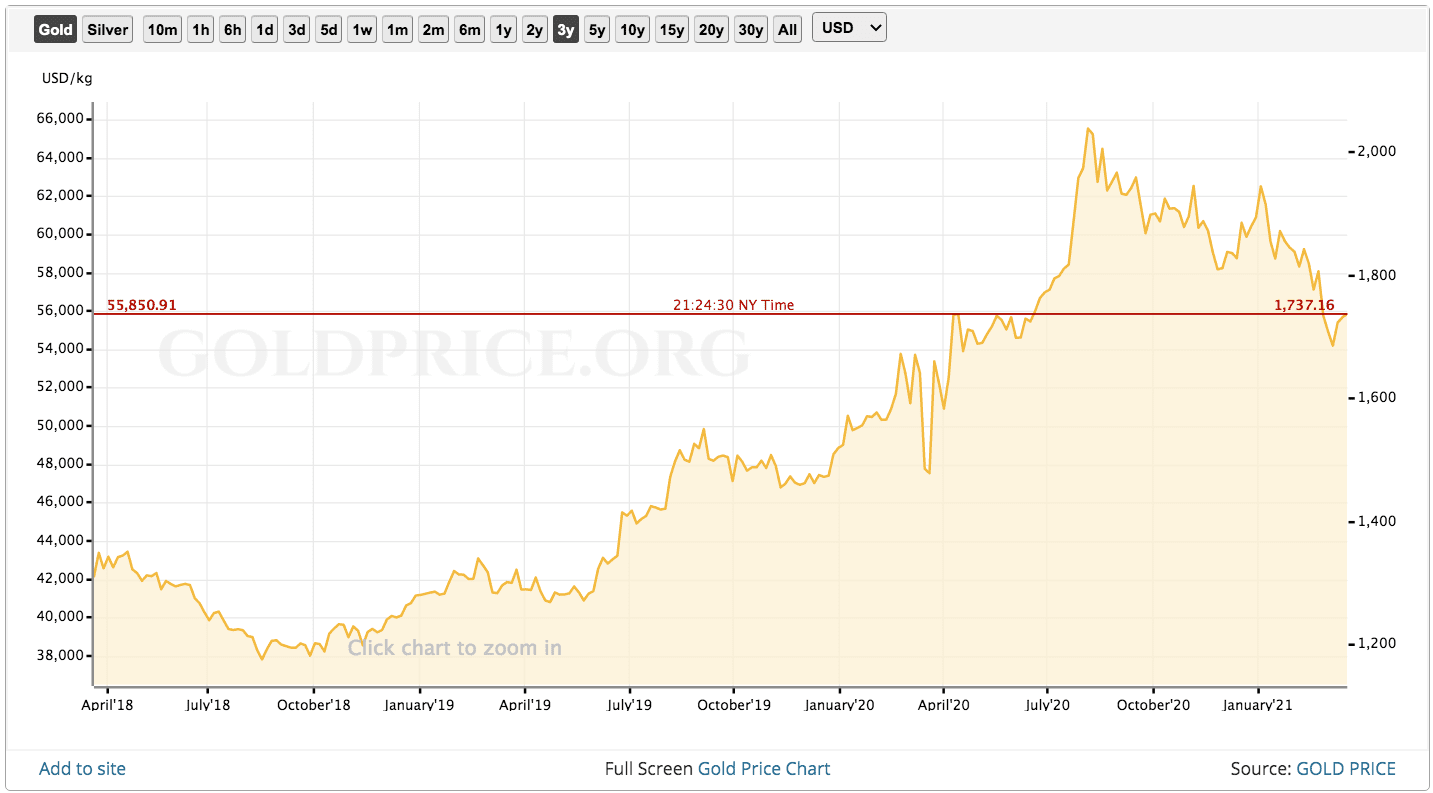
The price of gold is also up around 34% since 2018. (this chart exaggerates the increase as it is not baselined at zero). However, notice that gold’s run-up in price was the middle of last year.

The price of silver is up more around 41%, with the trigger clearly being Coronavirus, as the increase is just a few months after the Coronavirus hit in the US. It shows a similar pattern to gold, in that it spiked in the middle of 2020 but has since declined but is much higher than before the Coronavirus hit.
Copper Price History

This is one of the only cases where I am showing the price back to 1960. The problem with doing this, and why I left this out period of time off later graphs, is that there was high inflation in the 1970s. Copper’s increase was in the early 2000s and has stayed roughly stable since 2008,
If we go back to 1980 instead of 1960, the price increased from $1 to $4. But this is far less of an increase than it appears. We will cover the issue of analyzing graphs with continual inflation further on in the article.
Forecasts from Dr. Michael Burry
Micheal Burry, of The Big Short fame, has been tweeting about US hyperinflation. He was intimidated into not tweeting and deleting his tweets by a visit from the SEC. The SEC appears when a prominent person predicts a reduction in something. The SEC’s “market stabilization” seems to only go in one direction.
This video the SEC’s censorship of Michael Burry.
A few videos cover Burry’s views.
And this video.
In this video, Burry explains the case for inflation.
This video brings up the issue of margin debt. Here is a quotation on the topic.
As the pandemic hit last March, total margin debt – money borrowed to invest in the stock market – stood at $479 billion. Since that time, the stock market has boomed, and margin borrowing has only increased. This past January, it hit an all-time high of $798.6 billion.
In response, mainstream commentators and iconoclasts alike are sounding alarms about systemic risk and warning of a repeat of the crash of 1929, arguably the worst in the nation’s history. But they are citing some history while missing critical pieces of it, relying on an old narrative that has proven deeply flawed.
Then there’s the question of whether margin debt is a reliable indicator of the stock market’s direction. Here, too, the research runs counter to conventional wisdom. While it’s clear that rising margin debt mirrors the rising stock market, it’s hard to know when levels signal danger. – Bloomberg
This is important, but not for the reason that the quote is accurate. Bloomberg is a financially aligned publisher. Their job is to keep bubbles going, not to provide accurate information to the public.
Burry is against Bitcoin and sees inflation and pop in the US stock market. This video also includes other analyses.
Jeremy Grantham
The highly accurate fund manager Jeremy Grantham proposes that a serious decline is imminent. And this is from January of 2021.
In this article, Grantham lays out his case.
Trying to Stoop the Decline of US Treasuries
The Federal Reserve has been serially pumping up asset bubbles to prevent the decline of Treasuries. The reason for this is to keep the return on Treasury Bonds to stay low. If Treasury Bonds decline in value, it means that all other returns on other assets also have to decline. Here is Bill Gross, an expert on Treasuries on the decline of Treasuries.
Cryptocurrency is marked as TBD because after reading about Bitcoin and others, it is unclear what the future of cryptocurrency is.
Conclusion
The Asset Allocation Model’s top options are going short in the stock market, moving US currency to a foreign currency, and investing in agricultural commodities. The two worst options are staying in cash in the domestic US currency or going long on the stock market. Going long on the US stock market will provide short-term gains as it’s difficult to predict when the US stock bubble will pop.
However, that is just the high-level allocation. What is required is a specific strategy for each of the options. Agricultural commodities are the easiest, as all of the major agricultural commodities appear to be good values. Buying other currencies is easy, but the question arises of “which ones.” As for going short on the US stock market, this is the most complicated option. Furthermore, one needs a rough approximation of the probability of gain within an asset category. While the Asset Allocation Model shows three asset categories as the best current options, it does not say anything about what percentage of one’s assets one should allocate to any of them or what relative gain or appreciation there is likely to be in each asset category.
Trading Currencies
As a continuation into more detail, I have written this article, 2021 Analysis of Currencies Versus the US Dollar, which analyzes the probability of gains from trading the US currency for another currency.
Going Short on the Stock Market
The article The 2021 Analysis of Going Short on the US Stock Market, analyzes the probability of gains from going short on the US stock market.
Other analysis will be added to this area as they are completed.