
The 2021 US Stock Bubble
Executive Summary
- In June of 2021, multiple financial bubbles require analysis in the US.

Introduction
This article covers the 2021 US stock bubble and will propose an investment strategy based upon this analysis.
Bubble #2: Stock Bubble
There are many overvalued stocks, but one stock stands out among the rest. And it has had an enormous runup in 2020 that was likely due to factors unrelated to the stock’s long-term potential.
Tesla
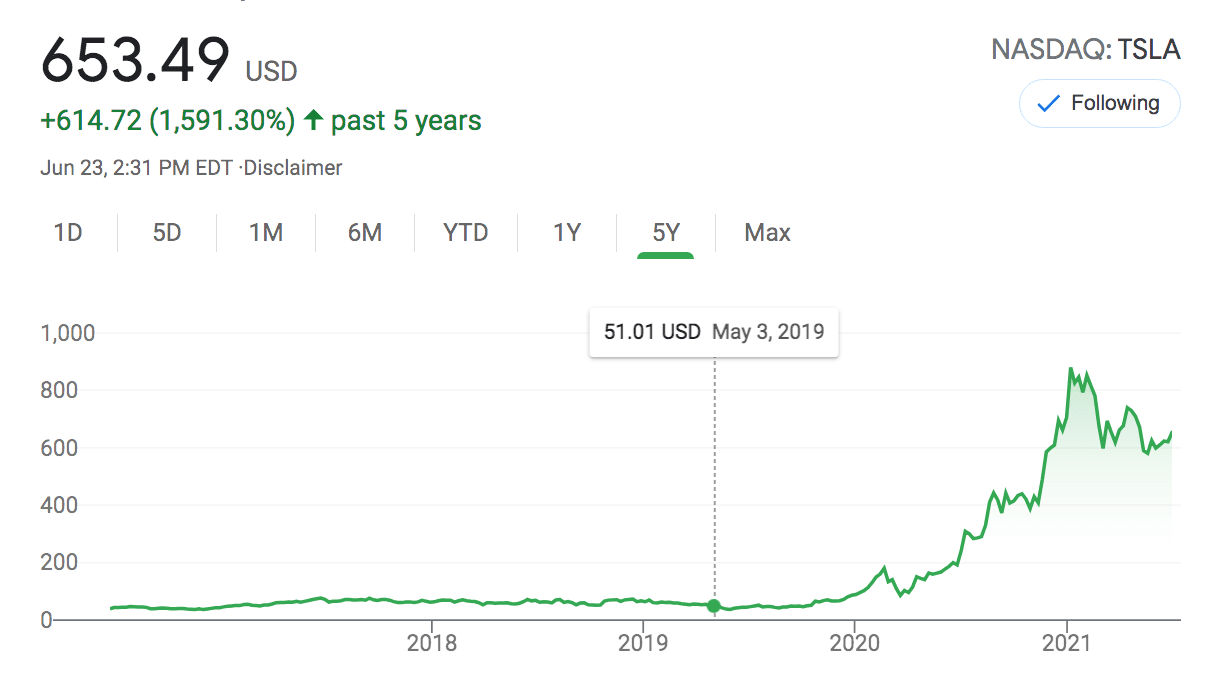
(On August 20 of 2021, Tesla rested at $680, so higher than when this article was written.)
The Logic of Shorting Tesla Now (In June 2021)
Tesla was run-up due to inclusion in S&P 500 in 2020.
“From looking at academic research, however, one catalyst really sticks out to me, which is the inclusion in the S&P 500 index. Index funds are designed for simplicity. They buy and hold the stocks in their index, and that’s all there is to it. However, one issue with index funds is that they have to add and delete stocks periodically, which creates an opportunity for Wall Street to front-run them by buying the stocks that will be added to the index and selling the stocks that will be deleted ahead of the index funds.
In my opinion, market participants drove up the price of TSLA stock in 2020 because they knew they could get S&P 500 index funds to pay any price they asked. The higher they drove the price, the more the index funds were forced to buy. In this, they found the ultimate “greater fool,” meaning a buyer that would not only buy at any price but would buy proportionally more the higher the price went. Tesla finally joined the S&P on December 21 at nearly twice the price it traded for a few months earlier. As index funds began to buy in their required amounts, the stock continued to rise, topping out in late January with concurrent speculation that Tesla would invest in Bitcoin. In all, index funds were forced to buy over $80 billion in Tesla stock, the largest single addition to the S&P 500 index in history. Market commentators immediately drew parallels to the December 1999 inclusion of Yahoo in the S&P 500 index. The Yahoo inclusion was one of the biggest single-stock wealth transfers in history when the index was made to buy Yahoo stock at dramatically higher prices than were natural due to the same situation occurring.
With index funds now having nearly 50 percent of the financial market share for the US, Buffett’s thoughts were prescient. Since the move in Tesla stock cannot be explained effectively by a change in business fundamentals, chicanery is the most likely explanation. As index funds continue to grow and an increasing amount of investors believe that financial statements are irrelevant, this represents both a problem for the American public and an opportunity for smart and patient investors.”
Institutions No Longer Shorting Tesla
“Some of this is likely related to convertible arbitrage with Tesla’s debt, meaning that the true short interest is lower. ~6 percent short interest is above average, but by no means is an abnormal amount of short interest, as the 99th percentile for short interest usually corresponds to a level of 20 percent of shares outstanding or higher. The institutional appetite for betting against Tesla is simply not there anymore. Short sellers in Tesla have long ago thrown in the towel.” – Seeking Alpha
https://seekingalpha.com/article/4415391-why-is-tesla-stock-dropping
And in this article.
“Three years ago, Tesla’s short-interest ratio was about 25%—one of every four shares was borrowed and sold by investors betting on price declines. That’s high. The average for stocks in the S&P 500 is about 3%.
But now, Tesla’s short-interest ratio is about 6%. Though it’s still higher than average, there is an important mitigating factor: Tesla has hundreds of millions in convertible bonds outstanding. Most were issued long ago and can be converted into Tesla stock at a price of around $65 a share.” – Barrons
https://www.barrons.com/articles/the-battle-over-tesla-stock-is-overfor-now-51617334560
The Overhyping of Electric Cars
https://www.wsj.com/articles/toyotas-chief-says-electric-vehicles-are-overhyped-11608196665
“Toyota President Akio Toyoda said Japan would run out of electricity in the summer if all cars were running on electric power. The infrastructure needed to support a fleet consisting entirely of EVs would cost Japan between ¥14 trillion and ¥37 trillion, the equivalent of $135 billion to $358 billion, he said.
“When politicians are out there saying, ‘Let’s get rid of all cars using gasoline,’ do they understand this?”“
Gas Versus EV
“Then there are the lithium batteries required to store all this energy. Lithium extraction would need to increase 2700%. Lithium requires 500,000 gallons of water to produce a single ton. This is already robbing communities in places like Chili from water.”
https://seekingalpha.com/article/4382875-clean-energy-vs-oil-and-gas-biggest-lie-of-2020
Why Did Micheal Burry Choose the Beginning of 2021 to Really Begin Shorting Tesla?
“The timing of Burry’s trade is interesting because you could have made the same argument at any time in the second half of last year that Tesla’s business can’t support the stock price in the long run. Burry must see a fundamental or technical catalyst for Tesla stock to continue falling to have bet hundreds of millions of dollars against the stock. Scion is leveraging the trade with put options, increasing the potential for gain or loss relative to the capital invested.”
https://seekingalpha.com/article/4429919-dr-michael-burry-shorting-tesla-and-treasuries
The Problem with Shorting Tesla
Comment #1
I see the Tesla short as a very different kind of trade than the subprime housing market in the mid 00s. Burry showed the housing short was a matter of simple math. He saw the defaults coming and that was that.
Tesla on the other hand has been backed by a lot of ideological fans who want to see Musk’s vision through. I maintain that up to recent months Tesla has effectively been more like a crowd funding endeavor as anything.
The traditional fundamentals of valuing a stock is almost beside the point with Tesla. I think this is what Tesla shorts up to now have failed to grasp. So I wonder now if Burry really knows what he is doing with this trade. So far it obviously seems like he does.
Comment #2
Exactly. People who shorted Tesla were “wrong for all the right reasons.” They did not understand that Tesla is a sort of tech-cult, and devotion to the Leader trumps all else — valuation, profitability, moat, etc.
https://seekingalpha.com/article/4429919-dr-michael-burry-shorting-tesla-and-treasuries
Strategy: Short Tesla
How to Short Tesla
Using Graniteshares inverse Tesla ETF.
“This index that seeks to provide -3 times the daily performance of Tesla Inc shares.
For example, if Tesla Inc rises by 1% over a day, then the ETP will fall by 3%, excluding fees and other adjustments. However, if Tesla Inc falls by 1% over a day, then the ETP will rise by 3%, excluding fees and other adjustments.”
https://graniteshares.com/institutional/uk/en-uk/etps/3sts
Shorting the S&P 500
In addition to any specific stock, another question is whether to short the overall S&P 500.
The overall S&P 500 is, as of June 2021, quite high. The following shows the graph of the P/E ratio of the S&P 500 for over a hundred years.

This graph shows the very high recent PE ratios of the S&P 500. (from the book Irrational Exuberance.)
There are four periods in the history of the S&P 500 where the PE ratio has been over 19 for more than 2 years. These epochs are as follows.
- From 1992 to 1994 (3 years)
- From 1997 to 2005 (9 years)
- From 2008 to 2010 (3 years)
- From 2015 to 2021 (8 years)
This means that the current bull run from 2015 is the second-longest run in the history of the S&P 500.
In the 9th year of the 1997 run, the PE the following 3 years was around 18. This means the PE declined from an average of 28 to 19.
The PE of the S&P 500 has only been over 42 only 3 times in the S&P 500s 150-year history. That is 2% of the time it has achieved this level.
These years were the following.
- 2021
- 2009
- 2002
2021 is now, so two times before this year, this has occurred.
The following year the PE declined to the following levels.
- 2021: Nothing yet, of course.
- 2009: From a PE of 70 to 20
- 2002: From 46 to 31
This is an average of (70 + 46) and (20 + 31) = (116-51)/116 = 65/116 = 56%.
Curiously, I have never once run into this analysis being published online. While there is commentary that there is a bull market, there are very few articles that compare the PEs per year from the beginnings of the S&P 500.
Why Are Investors Willing to Pay So Much For Earnings as of the 1990s?
- In the 120 years from 1871 to 1990, the average PE was 13.7.
- However, in the 30 years since 1990, the average PE of the S&P 500 has been 25.25.
Why has the average PE of stocks in the S&P 500 increased by (25.25 – 13.7)/13.7 = 84%?
And the story is more extreme than this because the average dividend yield from 1871 to 1990 was 4.91%. However, since 1990 it has been 1.97%. This is roughly a 3 percentage point declined. Looking at it comprehensively, it means that stock buyers (and we will draw an important distinction in just a moment between the company as a stock buyer and others) were willing to pay 84% more for earnings, even though the dividend yield dropped on average 3 percentage points.
The trick to figuring this out is that many of the stock buyers were buying stock not with their own money but with the company’s money that they were running.
This brings up the topic of stock buybacks.
Stock Buybacks
The stock market has morphed from a way to raise money to almost entirely about enriching underwriting firms and the executives at the companies.
This is the only explanation for the incredible rise in stock buybacks illustrated in the following graphic.

As one can see from the graph, corporations have been on a buyback binge since around roughly 1995. This lines up with the strongest performing period in the history of the S&P 500, which is the 1990s until now. And the number of shares has been on an upward swing, pausing briefly in 2009 and 2010.
The problem with these buybacks is explained in the following quotation.
How Buybacks Increase Corporate Debt
Even as the United States continues to experience its longest economic expansion since World War II, concern is growing that soaring corporate debt will make the economy susceptible to a contraction that could get out of control. The root cause of this concern is the trillions of dollars that major U.S. corporations have spent on open-market repurchases — aka “stock buybacks” — since the financial crisis a decade ago. Making matters worse, the proportion of buybacks funded by corporate bonds reached as high as 30% in both 2016 and 2017, according to JPMorgan Chase.
Close to 1/2 of Companies Spend Nothing on R&D
In fact, in 2018, only 43% of companies in the S&P 500 Index recorded any R&D expenses, with just 38 companies accounting for 75% of the R&D spending of all 500 companies.
The Drain on Treasuries from Buybacks And Increases Fragility
Buybacks’ drain on corporate treasuries has been massive. The 465 companies in the S&P 500 Index in January 2019 that were publicly listed between 2009 and 2018 spent, over that decade, $4.3 trillion on buybacks, equal to 52% of net income, and another $3.3 trillion on dividends, an additional 39% of net income. JPMorgan Chase has constructed a time series for 1997 through 2018 that estimates the percentage of buybacks by S&P 500 companies that have been debt-financed, increasing the financial fragility of companies. In general, the percentage of buybacks that have been funded by borrowed money has been far higher in stock-market booms than in busts, as companies have competed with one another to boost their stock prices.
This means that stock buybacks are pro-cyclical. Rather than trying to get a good price for the company (which would be a low price), executives choose to get a bad price for the company but a good price for the executives.
Paying Executives
Why have U.S. companies done these massive buybacks? With the majority of their compensation coming from stock options and stock awards, senior corporate executives have used open-market repurchases to manipulate their companies’ stock prices to their own benefit and that of others who are in the business of timing the buying and selling of publicly listed shares. In contrast to buybacks, dividends provide a yield to all shareholders for, as the name says, holding shares.
https://hbr.org/2020/01/why-stock-buybacks-are-dangerous-for-the-economy
The following shows the rise in corporate debt predicts a decline.

The S&P 500 came off its high of 46 PE in 2002 and became 31 in 2003 and continued down until 2007.
The stock market did decline after 2009 from a PE of 70 to a PE of 20.
Therefore, the question initially asked
“Why are investors willing to pay 84% for earnings than pre 1990 than after 1990.”
.. may be considered misleading. The major distinction is that stock buybacks became increasingly common as a way for executives even further to increase their compensation.
In this way, US executives of S&P 500 companies may be considered to be engaging in control fraud.
Why Did Stock Buybacks Mushroom After 1990?
This is explained in the following quotation.
For most of the 20th century, stock buybacks were deemed illegal because they were thought to be a form of stock market manipulation. But since 1982, when they were essentially legalized by the SEC, buybacks have become perhaps the most popular financial engineering tool in the C-Suite tool shed. And it’s obvious why Wall Street loves them: Buying back company stock can inflate a company’s share price and boost its earnings per share — metrics that often guide lucrative executive bonuses.
Consider the case of American Airlines, a company two years out of bankruptcy, facing down $19 billion in debt — and continuing to buy back billions of dollars worth of company stock. – Forbes
Before reading this article, I had never heard that what was considered market manipulation is now legal. Without this understanding, the reason why stock buybacks have become so enormous since 1990 would be a mystery. Furthermore, the financial media does not discuss stock buybacks or the impact of stock buybacks when they talk about an increase in stock prices. Instead, they present all stock increases as “demand-driven,” or authentic demand. This provides a distorted view of the increase in stock prices.
The Move Away from Dividend Yields as a Way of Valuing Stock
Stocks do not give the buyer rights outside of selling the stock. There are situations where a wealthy entity can buy up a portion of the company and force changes or demand a buy-out to go away (a good example of this is Carl Icahn who has done this to multiple companies), but this is not applicable for most stock buyers.
Stocks have dramatically changed since the US stock market began in 1871. At this time there was high skepticism regarding stocks. To get buyers interested in the stock, companies offered a dividend. Therefore, the stock was very similar to a bond. Companies could cut the dividend (that is, it was not guaranteed) but not without impacting the value of the stock. However, as the stock market became more established, the dividend has declined.
As dividends have declined, virtually the entirety of the value of the stock is the ability to resell the stock. This is problematic because there is less incentive to hold the stock and more incentive to flip the stock when times are good.
The change in how stocks functions in the past versus the past 30 years is explained in the following quotation.
Prior to the past several decades, earnings forecasts were not nearly so important a factor in assessing the value of corporations. In fact, I do not recall price-to-earnings ratios as a prominent statistic in the 1950s. Instead, investors tended to value stocks on the basis of their dividend yields. Since the early 1980s, however, corporations increasingly have been paying out cash to shareholders in the form of share repurchases rather than dividends.
In 1982, the SEC gave companies a safe harbor to conduct share repurchases without risk of investigation. This action prompted a marked shift toward repurchases in lieu of dividends to avail shareholders of a lower tax rate on their cash receipts. More recently, a desire to manage shareholder dilution from the rising incidence of employee stock options has also spurred repurchases.
As a consequence, dividend payout ratios, which in decades past averaged about 55 percent, have in recent years fallen on average to about 35 percent. But because share prices have risen so much more than earnings in recent years, dividend yields — the ratio of dividends per share to a company’s share price – have fallen appreciably more than the payout ratio. – New Republic
One might think that as time passes, the float of shares would become very small as the stock buybacks are so consistently high. However, this is not the case because the companies are constantly issuing new shares to their executives. These shares do not bring money into the company. They are sold or given to the executives at no cost. Therefore, the existing shareholders are constantly being diluted by executives, who then approve stock buybacks.
The buybacks can be timed to match when the executive’s options vest and can be executed.
This is explained more in the following quotation.
But shareholders don’t benefit a great deal from all this paper revenue because shares are constantly being diluted by stock options granted to corporate executives, which were given a tax preference in 1981. The net benefit to shareholders is much less since much of the share buybacks simply offsets the dilution.
Financial analyst Will Becker explains another problem: Buybacks are typically initiated in good times when stock prices are high…. Corporations end up purchasing their own stock at inflated prices, only to have many of these same shares then redeemed by management as compensation committees increasingly hand out these perks in good times.
https://newrepublic.com/article/159504/corporations-scam-shareholders-screw-workers
Evaluating Value
What this means is one cannot look at the stock market post-1982 the same way as pre-1982. This is because stock buybacks are now a powerful factor in increasing stock prices. This is because many stock buyers are not looking for value (recall that stock buybacks normally happen when the stock price is high, maximizing the buyback cost).
Instead, the buybacks are designed to maximize the financial gain to executives who are making the buyback. This seems to be a very likely reason why the stock market has a different valuation per earnings after 1982, or even more so after 1990 when stock buybacks really began to increase.
More Debt Due to Using Funds to Buy Back Shares to Enrich the Executives
To fund these stock buybacks means that companies must take on more debt. This debt is directed towards propping up the stock price. That is, companies are taking on debt to increase off the books executive compensation.
An Inverse S&P Fund?
Using historical values makes appropriately valuing the S&P 500 difficult. Due to stock buybacks, the S&P 500 has been “recalibrated” to a higher level. Although at 45 times earnings, this is still 20 percentage points higher than the post-1990 stock buyback era. This would make an inverse S&P fund seem to be a good option.
There are both the Short (-1x) and Ultrashort (-3x) S&P 500 funds.
https://www.proshares.com/funds/sh.html
https://www.proshares.com/funds/spxu.html
The Problem with Shorting the S&P 500
If the S&P drops back to a PE of say 22, this is still only a 100% return. Such a drop is probably not very likely given how much money the Fed has put into the system. A more likely drop is to say a market PE of 32 or 34.
Shorting such a large number of stocks is less risky, but lower return than shorting specific stocks. However, it would be a good investment to balance out the risk of more specific investments.
Stocks like Data Dog or Teva, that sell for 700 times earnings are tricky to short as you must guess the date they decline.