
The Lack of Filtration in Both SAP APO and Other Planning Systems
Executive Summary
- A question on filtration in APO.
- How the Alert Monitor restricts one’s options for what can be seen to a relatively narrow set.
- How most planning systems work in this regard.
Introduction
A big part of any planning system’s effectiveness and usability is focusing on specific products and product characteristics in the planner view and the alert system. I recently had this question sent to me, which I thought would be interesting for other people to read.
“Hi Shaun,
I read your great article “How to use the APO Alert monitoring for reporting” and have a question I hope you can answer. In your article you have the section quoted below – my question is has this changed in the newer versions of SAP APO? I.e. is it possible to sum the quantities and placing it as a denominator over another key figure, e.g. Gross Sales. The purpose as you surely know is to sort of all of the alerts that are not important, e.g. we are not interested in an alert for product that sells 4 instead 2 for a given subsidiary where the total sales is 40.000, but we most surely interested in knowing is a product sells 4 instead for 2 where the total sales is 10 (just examples).
Is there any way to accomplish this in the latest version of APO?” – Questioner
Here was my answer.
“Unfortunately, no. The alert monitor has many choices as to what to “report” on, but there is no flexibility to essentially create your own metric by combining other metrics in the way you describe. I actually put in a change request for a different software application I was working with to do something essentially similar. Planning systems need the ability to type in expressions to allow the alerts and the views to be totally controlled by the user because no developer can anticipate every view or alert that the planner would want or need.
Your next option would end up being a BW report, and that is an issue because then it would be some separate dashboard, and the BW team, if you have one, likely has a huge number of requests for reports, and this one may or may not make the final cut due to the project budget.”
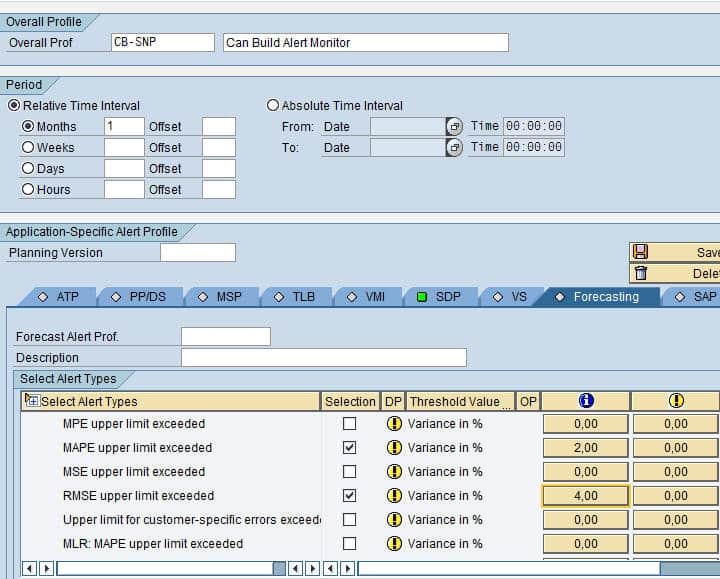
The Alert Monitor Configuration
Below you can see a screenshot of the Alert Monitor configuration and how there are not options for creating your own combination of metrics. The Alert Monitor is very straightforward. You select a metric and then a tolerance, which, if exceeded, creates an alert.
 The Alert Monitor segments the alerts by the module.
Interesting Topic
This is actually a significant topic. It is not a problem exclusive to SAP SCM. Most planning systems I have worked with have restricted ways of setting up alerts and setting up the filers for what is shown in the user interface. When one thinks about it, it is really the same thing. You are trying to set up a particular view that limits very specifically what the user sees. A more advanced filter described in the question above is actually based upon a formula or expression. That is a combination of different metrics. This is the type of functionality that is really necessary and can really be used by planners. The application I referred to in my response was Demand Works Smoothie. In this case, the client wanted to type in expressions into the Smoothie filter to get precisely targeted results. A big part of planning is simply shrinking down the product database to exactly what you want to work with to apply things to different adjustments. The planning book provides more control than the alert monitor but is still not where it should be. Outside of APO, improvement in other applications is needed a well. Any application that could type regular expressions into both its alert system and its filter would really differentiate itself in the market.
Post Note
The most flexible viewing I have seen to this point is in a product called Optimza by Barloworld. I am not sure about its ability to use expressions; however, it can effectively segment the product database. A few supply and demand planning tools run their system primarily based on segmentation (A, B, C, D, etc..).