
The Problem of Gartner and Real Research in Not Publishing Data Sets
Executive Summary
- Gartner does not publish their supporting data. However, even when data is published, there can also be limitations with accessing research data.
Introduction
In the article The Brightwork Research Analysis rating of IT Analysts Like Gartner, Forrester, and More, I covered how none of the private companies say they research the IT field do much more than provide marketing collateral for vendors. In the article Why is There Near Radio Silence by Vendors on Criticizing Gartner, I cover that not only does Gartner never publish any of the supporting data for its Magic Quadrants, but that this is premeditated to hide the fact that Gartner moves the dots around on the MQ in great part based upon how much each vendor pays Gartner. And secondly, not publishing the table allows Gartner to hide this fact from readers of its Magic Quadrant.
This article will broaden the conversation around sharing research data into the academic research area, where real research, rather than passive marketing drivel, is produced. An enormous amount of our collective understanding of what is true is based. I will start by bringing up a major error discovered in widely used research that was only eventually found by another research team by looking through the original spreadsheet of the research. This is from economics, not IT, but the same lesson applies to IT research and, in fact, all research.
Our References for This Article
If you want to see our references for this article and other Brightwork related articles, see this link.
Notice of Lack of Financial Bias: You are reading one of the only independent sources on Gartner. If you look at the information software vendors or consulting firms provide about Gartner, it is exclusively about using Gartner to help them sell software or consulting services. None of these sources care that Gartner is a faux research entity that makes up its findings and has massive financial conflicts. The IT industry is generally petrified of Gartner and only publishes complementary information about them. The article below is very different.
- First, it is published by a research entity, not an unreliable software vendor or consulting firm that has no idea what research is.
- Second, no one paid for this article to be written, and it is not pretending to inform you while being rigged to sell you software or consulting services as a vendor or consulting firm that shares their ranking in some Gartner report. Unlike nearly every other article you will find from Google on this topic, it has had no input from any company's marketing or sales department.
The Debt to GDP Ratio
In economics, there is a statistic called the debt to GDP ratio. This ratio is a measurement of the public debt (so a US budget deficit in one year contributes to a running debt. The debt is the accumulated total of what the government owes).
I found this quote from the book The New Great Depression.
The Reinhart and Rogoff research reveals that a 90% debt to GDP ratio is not just more of the same, rather it’s what physicists call a critical threshold at which a phase transition occurs, the first effect is that the Keynesian multiplier falls below one, the dollar of debt and spending produces less than $1 of growth, no net growth is created by added debt while interest on the debt increases the debt to GDP ratio on its own.
What is being referred to is very widely referred to research in government deficits and debt. It has been quoted in many books and used to inform public policymakers all around the world. Let us review the research in the authors’ own words.
The Reinhart-Rogoff study is described as follows.
We study economic growth and inflation at different levels of government and external debt. Our analysis is based on new data on forty-four countries spanning about two hundred years. The dataset incorporates over 3,700 annual observations covering a wide range of political systems, institutions, exchange rate arrangements, and historic circumstances. Our main findings are: First, the relationship between government debt and real GDP growth is weak for debt/GDP ratios below a threshold of 90 percent of GDP. Above 90 percent, median growth rates fall by one percent, and average growth falls considerably more. We find that the threshold for public debt is similar in advanced and emerging economies. Second, emerging markets face lower thresholds for external debt (public and private)–which is usually denominated in a foreign currency. When external debt reaches 60 percent of GDP, annual growth declines by about two percent; for higher levels, growth rates are roughly cut in half. Third, there is no apparent contemporaneous link between inflation and public debt levels for the advanced countries as a group (some countries, such as the United States, have experienced higher inflation when debt/GDP is high.) The story is entirely different for emerging markets, where inflation rises sharply as debt increases.
However, in 2013, a major problem surfaced from a review of this research. And this was that the Reinhart-Rogoff study was based on a spreadsheet error.
Harvard’s Carmen Reinhart and Kenneth Rogoff are two of the most respected and influential academic economists active today.
Or at least, they were. On April 16, doctoral student Thomas Herndon and professors Michael Ash and Robert Pollin, at the Political Economy Research Institute at the University of Massachusetts Amherst, released the results of their analysis of two 2010 papers by Reinhard and Rogoff, papers that also provided much of the grist for the 2011 bestseller Next Time Is Different. – The Conversation
This is taken from this study.
We replicate Reinhart and Rogoff (2010a and 2010b) and find that coding errors, selective exclusion of available data, and unconventional weighting of summary statistics lead to serious errors that inaccurately represent the relationship between public debt and GDP growth among 20 advanced economies in the post-war period. Our finding is that when properly calculated, the average real GDP growth rate for countries carrying a public-debt-to-GDP ratio of over 90 percent is actually 2.2 percent, not −0.1 percent as published in Reinhart and Rogoff. That is, contrary to RR, average GDP growth at public debt/GDP ratios over 90 percent is not dramatically different than when debt/GDP ratios are lower. We also show how the relationship between public debt and GDP growth varies significantly by time period and country. Overall, the evidence we review contradicts Reinhart and Rogoff’s claim to have identified an important stylized fact, that public debt loads greater than 90 percent of GDP consistently reduce GDP growth. – Does High Public Debt Consistently Stifle Economic Growth? A Critique of Reinhart and Rogoff
Yes. This is a massive change.
Economies normally only grow a few percentage points in a year. The percentage decline or increase was always going to be small. So this error correction takes a previous assertion of minor decline and converts it into a major increase. This reverses the original conclusion. Furthermore, many books and articles have been written based on a false conclusion, including the book The Great Depression.
And something else is also concerning. The book The Great Depression was written in 2020. However, this paper by Hernon, Ash, and Pollin was written in 2013!
The Great Depression is one of the most popular books on Amazon regarding the US economy’s current situation under the coronavirus. Why has that book not been corrected? Secondly, why was the author not aware of the 2013 paper in the first place? The corrected math means that the paper goes from arguing against high debt to GDP ratios to arguing in favor of them. That is once the full data set is used.
This means that every person who relied upon this research, must now go back and change their statements to reflect that the updated version of the research now says the exact opposite of what the uncorrected version asserted.
How many places the Reinhart-Rogoff study has been used is instructed and a bit scary.
The paper was cited by the 2012 Republican nominee for the US vice presidency Paul Ryan in his proposed 2013 budget The Path to Prosperity: A Blueprint for American Renewal.
While many different types of errors were involved in these calamities, the fact that the errors in the Reinhart-Rogoff paper were not identified earlier can be ascribed by the pervasive failure of scientific and other researchers to make all data and computer code publicly available at an early stage – preferably when the research paper documenting the study is submitted for review.
We’ve discussed this topic in a previous article on Math Drudge and another in the Huffington Post – emphasising that the culture of computing has not kept pace with its rapidly ascending pre-eminence in modern scientific and social science research.
Most certainly the issue is not just one for political economists, although the situation seems worst in the social sciences. In a private letter now making the rounds – which we have read – behavioural psychologist Daniel Kahneman (a Nobel economist) has implored social psychologists to clean up their act to avoid a “train wreck”. – The Conversation
Time to Begin Sharing Research Data With Links in Published Articles to Google Sheets?
This brings up the other researchers to publish their results in Google Sheets, allowing for their data to be analyzed. It is a simple thing to create one Google Sheet, the master, and then make a copy or allow the Google Sheet to be viewed but not edited.
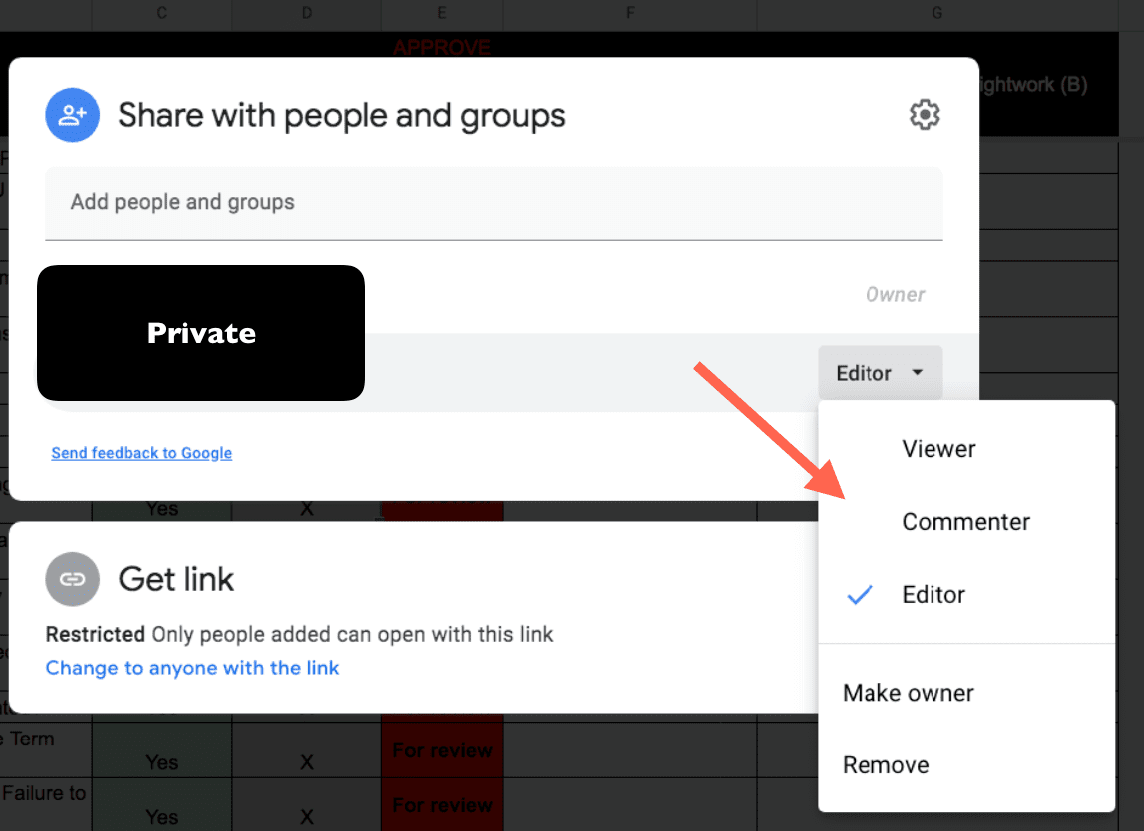
Any Google Sheet can set up a recipient as a Viewer, Commenter, or Editor. Editors are normally collaborators. However, just viewing a sheet allows a person to validate the calculations and other factors in the sheet. And, of course, several master copies can be kept in Google Drive as well. One wonders why Google Sheets links are not included with research results. This is consistent with open source, where a community gets to perform bug checking and recommend changes.
Before the internet and Google Sheets or similar types of data sharing, there was never the ability to do this. Long after computers arrived on the scene, data sets were still kept on private drives. However, increasingly high-quality data sets are available on the internet.
There are too many sites to mention for data, however, one is called Kaggle.
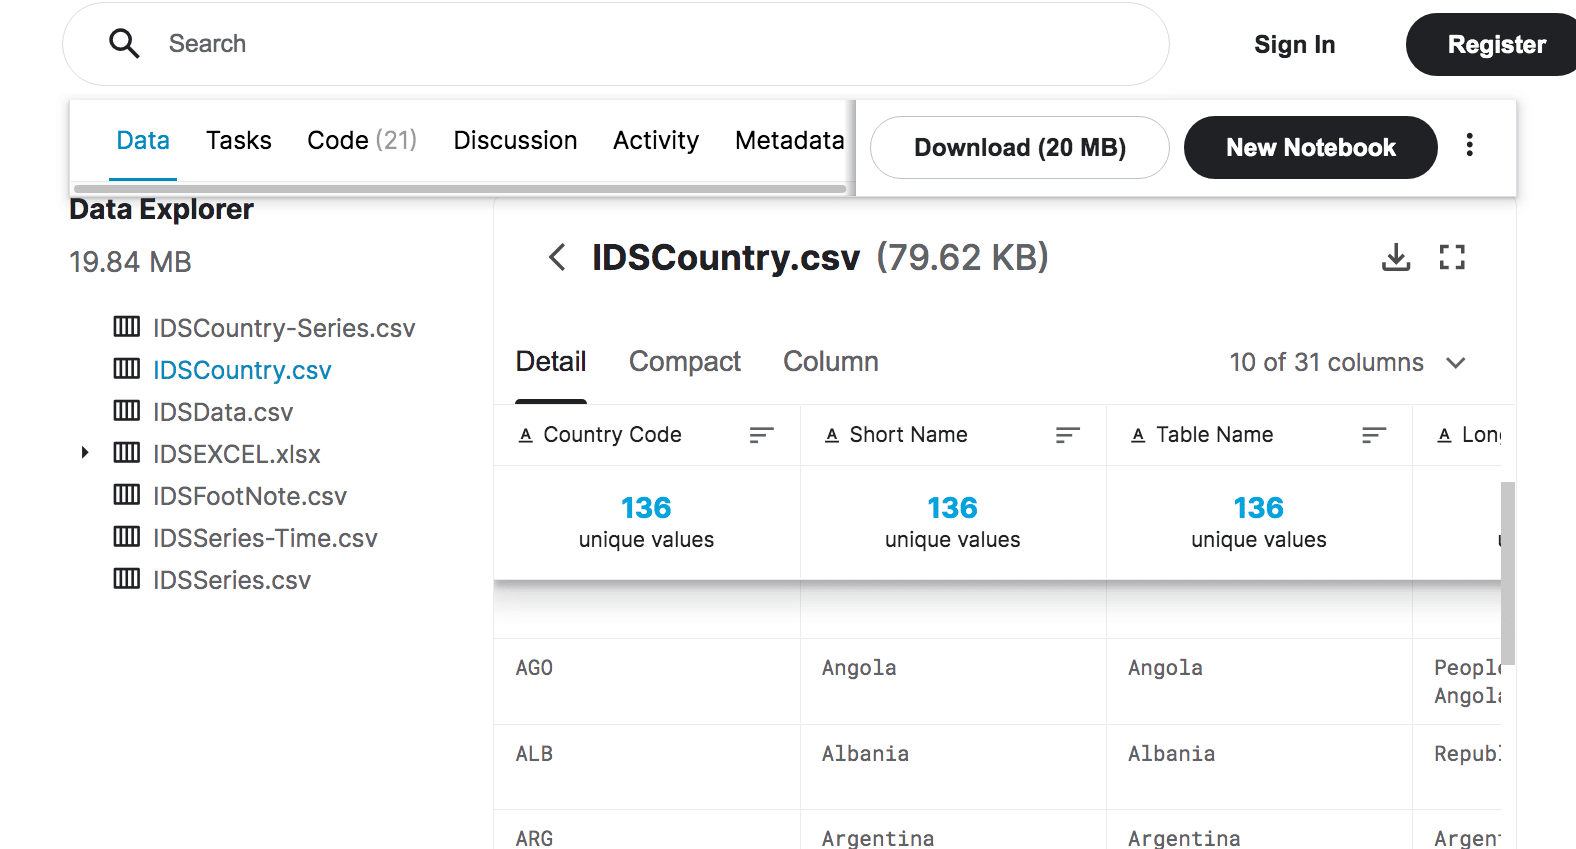
One these types of data set sites, you can download a wide variety of data sets.
Google Sheets is not only beneficial for sharing results, but it is beneficial for collaboration. Five researchers can all keep connected through a Google Sheet. And previous revisions are shared.
However, here is a comment from a journal editor on the CEPR website.
As a journal editor, I wonder how we would actually implement these sensible suggestions within the peer review system. As it is, the biggest problem an editor faces is actually finding reviewers who have the time and inclination to review papers. If those reviewers had to review underlying code and datasets as well, they would virtually be repeating the work that went into the paper in the first place and I think we would run out of reviewers real quick. Also, preparing that sort of material in a publication-ready-form is a big task for somebody. Perhaps the solution is for journals to offer unrefereed data and code repositories on a “what you see is what you get” basis. I think this happens in some areas already.
There is no doubt that taking this aspect of the publication cycle more seriously is a lot more work and would slow down the rate at which papers get published. Maybe that wouldn’t be a bad thing.
How Most Research Papers Are Published
Most papers don’t include the data in an easily accessible form. Instead, they are printed in tables that cannot be manipulated. Of course, Gartner does even less than this, not even bothering to publish the table of mathematical values that supports their Magic Quadrants. However, most legitimate research publishes tables when the research is based upon data.
Published Research Before and After the Internet
Before the internet, there was a logic to this, as the paper was published on paper, and there was no way to make the data set interactive. However, with the internet, there is no excuse not to publish the actual data so that the reader can interact with it. Furthermore, it is straightforward to create a Google Sheet and to include the link. The reader selects the link, and the Google Sheet immediately opens. In most cases, the reader would open a sheet that where they have a Viewer role. However, while a Viewer can’t change anything, they can copy their Google Drive and then manipulate the sheet. And of course, some people prefer Excel or LibreOffice, and they may only want to use the Google Sheet in Google Drive as the beginning point. After that, they can do whatever they like and use the analytical tool of their choice.
This quote describes the incentives that exist in academic publishing.
Secondly, the research system must offer institutional rewards at every level from departmental decision making to grant funding and journal publication. The current academic and industrial research system, which places primary emphasis on publications and project results and very little on reproducibility matters, effectively penalizes those who devote extra time to develop or even merely follow community-established standards.
Along this line, it is a regrettable fact that software development is often discounted in the scientific community. It is typically compared unfavorably, say, to constructing a telescope, as opposed to doing real science with the telescope. Thus, serious scientists are discouraged from spending much time writing code or testing it and, are they are certainly not rewarded for the hard work of properly documenting their projects.
For example, it is a sad fact that NSF-funded web-projects remain accessible, on average, for less than one year after the funding stops. Typically these researchers are busy running a new project and have no free time or money to look after the old. Given the substantial and ever-increasing importance of computation and software, such attitudes and practices must change. – Experimental Math
This is all good insight. However, placing data into Google Sheets is no extra overhead. In fact, starting from Google Sheets improves the collaboration between the editors as well while the research is being performed. I collaborate with several people using Google Sheets. And Google Sheets not only holds the data, but it also is where the to-do list can be stored. I know what is accomplished by other people and our status based upon what line item is filled in as complete. I then know what part I have to do. Each participant is given a task, and Google Sheet integrates the collaboration. Research data tabs and collaboration tabs can all be kept in the same Google Sheet, with the workbook being a type of history for the overall project. I have several projects going on at once, and therefore I have to review several Google Sheets to both see what is happening and to update my input, which the others are reacting to as I am reacting to them. This cuts down on communication overhead with each participant.
It is somewhat surprising to me that project managers tend not to leverage this collaborative capability. There are many workflow vendors that have popped up in the past few years, and they are integrated messaging systems. And that is fine. But I am quite satisfied with a simple Google Sheet as the primary integration mechanism.
Conclusion
Gartner, Forrester, and others aren’t in the business of producing knowledge. They, like nearly all private research (see the article on How Gartner is a Fake Research Entity Like JD Power and Associates), are about promoting industry and profit-maximizing all while posing as a research entity. So they will never follow the rules of research or seek to have their results replicated. However, even what has considered real research has a problem with a lack of sharing the data on which the study’s conclusions were based.
Online Data Sheets Can Be Easily Leveraged for Sharing Research Data Sets
With the internet and easily publishable data, there is no longer any excuse for keeping data sets private. If research is of good quality, and reproducible, then others with the domain expertise can review the paper and review and manipulate the data. This can be accomplished with a link published with the study that opens a Google Sheet in Viewing mode.