
How to Use the SAP SNP Optimizer Log for Analysis
Executive Summary
- The optimizer log can be audited in the SNP optimizer to provide critical information about the optimization run.
- We cover the product locations’ view, the parameters, input log, result log, the costs, and the trace field views.
Introduction to the SNP Optimizer
The SNP optimizer has a log, which provides information on a variety of inputs and outputs. These inputs and outputs outline what material master data the optimizer looks at to calculate a solution, outputs a recommendation to act on, and then displays a completed result.
What is an Optimizer Log?
An Optimizer log is useful for understanding the system’s output and aids in troubleshooting issues that may occur in the system. The log can be read within SAP or exported as a flat file. The SAP version provides information quickly, while the exported flat file provides a soft copy through the trace file view to archive for future reference. The logs kept in SAP are kept for two weeks, while a flat file with an unlimited number of logs can be maintained and compared indefinitely. IT has been keeping flat files to compare runs to understand what the optimizer has been doing over time.
Here is the pathway to the Log.
The log can be obtained by going to the transaction /N/SAPAPO/SNPOLOG.
After you type in this transaction, the following screen will come up.
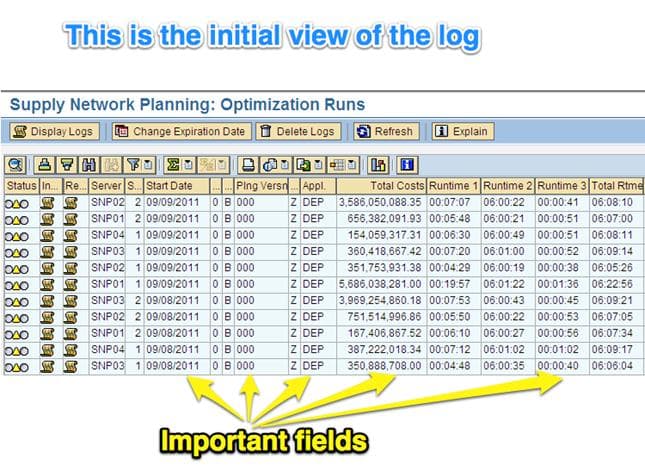
The fields that are reviewed to understand input and outputs are:
- Start Date: Date optimizer was kicked off or started.
- Planning Version: describes the optimizer version (example: active or simulation).
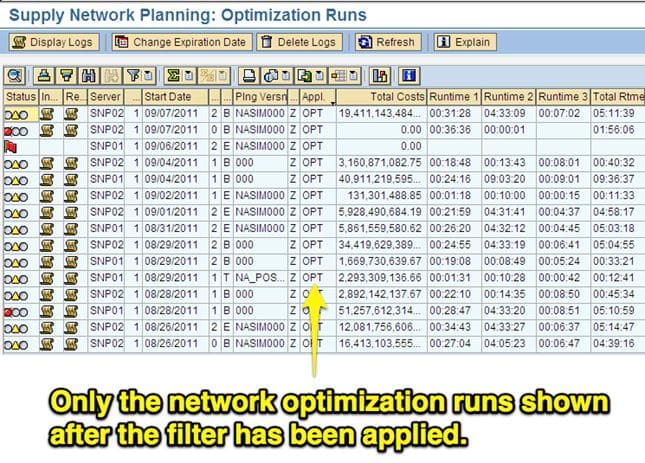
- Application: defines which optimizer was run – OPT (the network run) or DEP (the deployment run).
- Total Cost: the summation of the cost that was calculated by the optimizer.
- Total Runtime: how long it took the optimizer to run.
The initial log view can be sorted and filtered to easily find the optimizer application they are looking for.

When the user has selected the run that they want to drill into, double-clicking on that run will take them into the screen below.
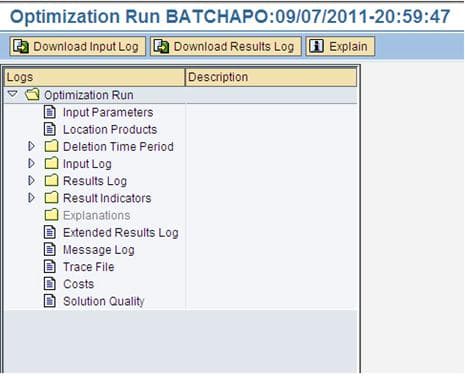 The log is broken into the segments listed above; these are defined as follows:
Input Parameters View
Not utilized by the user.

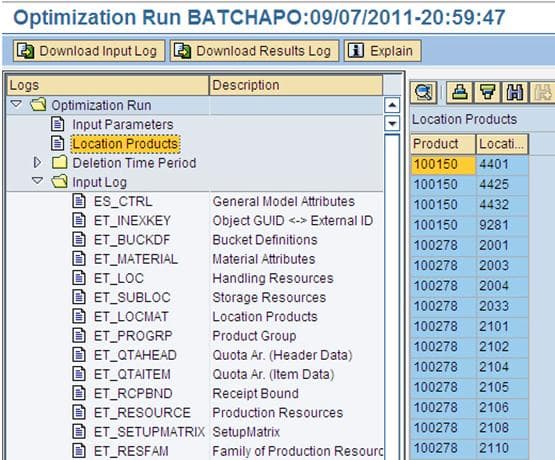
Location Products View
Location Products: location product combinations, which run through the optimizer
Input Log View
- Input Log: shows the master data setup for use in the optimizer. The master data is segmented into many different areas, making it simple to find the master data category of interest.
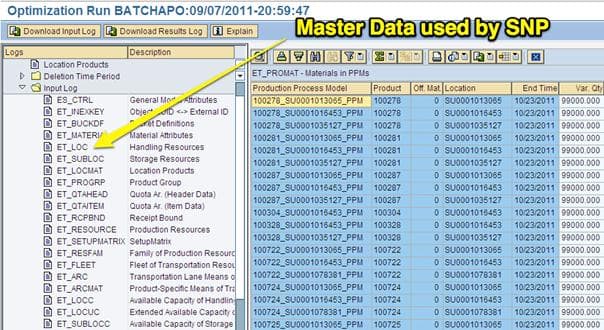 This selection shows the capacity of the Production Process Models or PPMs, which are 99,000 cases.
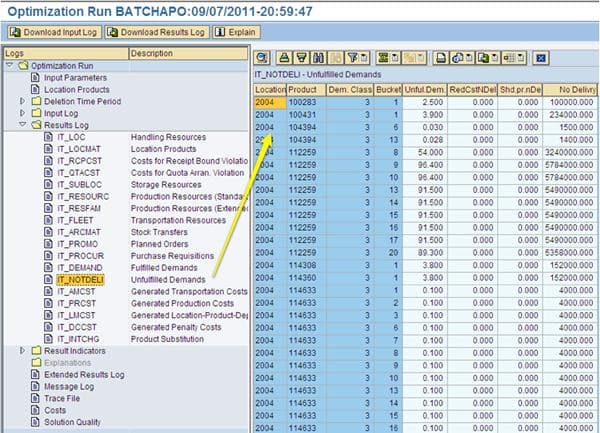
Results Log View
Results Log: shows the output of the optimizer. This view is important because it displays what the optimizer decided to do definitively. While the normal planning views such as the Product View and the Planning Book are useful, they can be adjusted by planners and are not the definitive reference of what the optimizer did.
In this particular subview, the Unfulfilled Demands shows the total unfulfilled demand costs incurred for each location product combination per time bucket. (For example, at location 2004 for product 114633 for the 14th time bucket, the cost incurred was 4000.000).
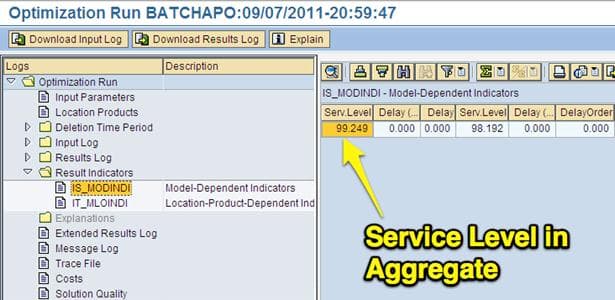
Results Indicators View
- Results Indicators View: displays primary metrics for the overall optimization run, including multiple measurements for service level and the stock level.
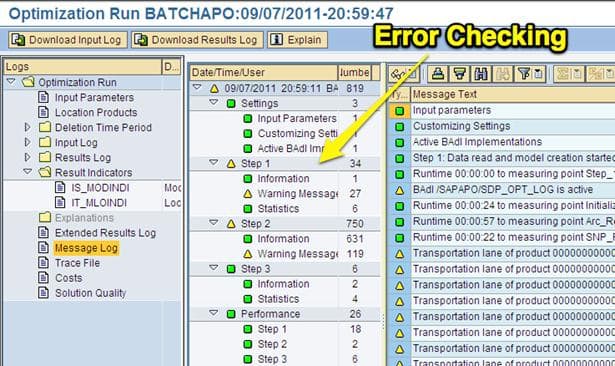
Message Log View
Message Log View: This is the location in the optimization log that will display errors. The different steps that the optimizer goes through organizing the errors.
It provides the count of each of the various error types. Every optimizer run will have some mistakes. Many of them are inconsequential. It’s hard to determine, in many cases, if the errors are important. Errors are essentially pointers of where to go and check the system to make changes. Problematic optimizer runs have more errors.
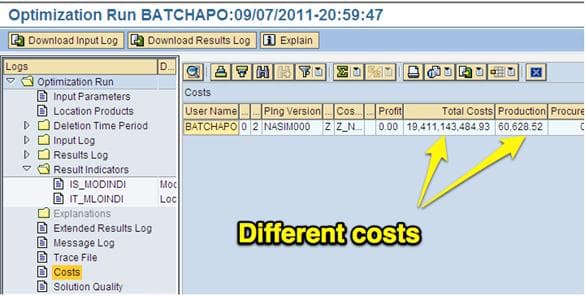
Costs View
- Costs View: Costs are how the optimizer makes decisions. The costs are listed by different categories in this view and were incurred by the optimizer during the run. The objective of the optimizer is to minimize total costs. Unless major changes were made to the model (adding locations, making configuration changes, etc.), the costs should be similar from run to run. An easy indicator of a problematic run has very high total costs compared to previous optimizer runs.
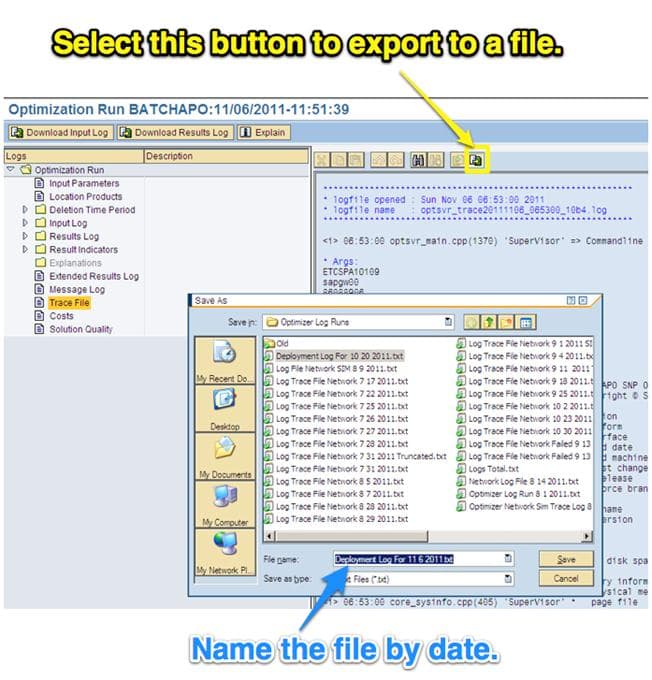
Trace File View
- Trace File View: The trace file is the master view and file within the log. It contains all of the information discussed up to this point, albeit in a less “digestible” form. Using the log should be more frequently used by those interested in getting more depth on the optimizer. The trace file also has the advantage of being able to be exported. APO only keeps two weeks of history from the optimizer runs. However, by performing successive exports, the logs can be archived on a user’s computer for as long as needed. Successive exports and documenting the results in a standard format are how IT determines how the current run compares against the historical average on major optimizer KPIs. To export the trace file, one selects Trace File selection, which brings up the trace file on the right pane. The trace file can be directly scrolled through or searched through in this view within SAP. However, for better and faster searching and scrolling and archival, it is normally a good idea to export the trace file. Selecting the export button, which is highlighted above, performs this. This will create the file, which can be saved to the desktop.
Naming Log Files
When naming these file types, it is beneficial to show the log name and date for ease of finding for future review. This file can then be opened in any text editor, including Word. However, while Word may be more comfortable for people because Word formats the text and the file is so large, there can be performance problems unless the user has a powerful computer. A text editor can reduce the overhead the document takes to work with.
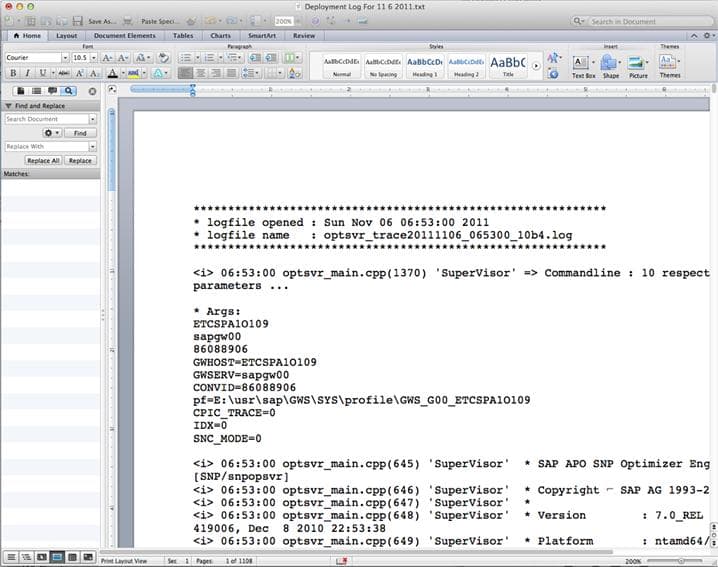
This information that is highly organized in the previous views is distributed throughout the document. The best way to find the different statistics desired is by using the search function. For instance, the service level is found by searching for delivered, which can be seen below.

Conclusion
The optimizer log is a significant and useful transaction and contains many diagnostic information about the optimizer runs. This document was designed to make it more straightforward for any user to learn how to access and use the log.