How to Constrain on Storage Capacity Planning in SNP
Executive Summary
- Capacity resources can be constrained in SAP SNP.
- There are tradeoffs in inaccuracy in the various approaches to storage capacity.
- There is a better approach than the standard functionality in SNP, which is little used at actual customers.

Introduction
This document describes the current design of the storage capacity view and recommends what should be done to make this capability best meet the business requirement.
Warehouse capacity planning functionality in SAP SNP is not used. One reason is that the view is not inherently understandable and requires explanation. Secondly, the solution has not been adequately socialized, and little documentation exists to explain the capacity view. This is now the most comprehensive documentation on this functionality.
Getting to the Storage Resources
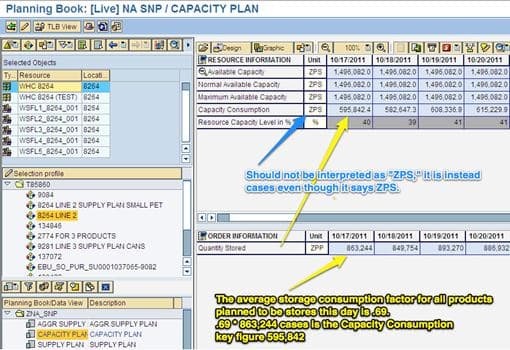
The first step to reviewing the storage capacity view is to view it in the planning book. All the resources should be brought up in the planning book for a location to view the storage capacity view.
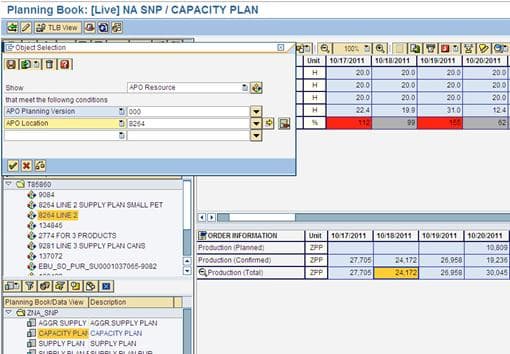
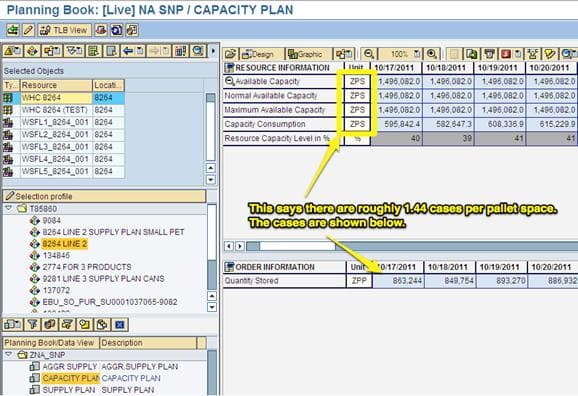
ZPS stands for pallet spaces at a location, and ZPP stands for cases. A natural interpretation is that there are multiple ZPPs / cases per ZPS / pallet spot in the screenshot, but the ratio is low. That is 1.44 cases per ZPS. That would mean that 1.44 cases would take up a pallet spot (the ZPS declares the key figure as a pallet spot when it is not). That, of course, would not make any sense.
As we will see later, while this appears to be what is shown, a few confusing aspects of how this design was assembled result in a capacity view that requires translation.
The Storage Capacity as Entered in the Resource
The top key figures in the capacity-planning book come from the value entered directly into the storage resource.
The Storage Capacity Consumption Adjusted Cases
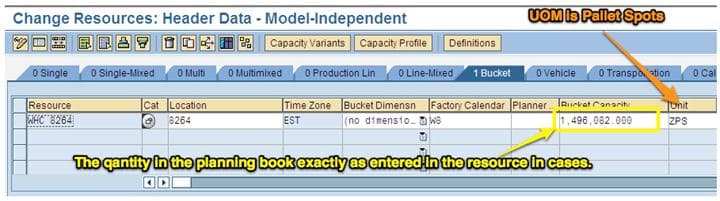
While the UOM listed on the Capacity key figures in the planning book states it is ZPS / Pallet Spots, the bucket capacity that has been
This can be seen in the storage resource screenshot (there is a single storage resource for each location) for location 8264. (In fact, all the storage resources that have been checked have been entered in cases.) Therefore, the maximum capacity of location 8264 is 1,496,082 cases. Thus, the value entered is in cases, while the measuring unit is listed as ZPS / Pallet Spots.
Value Entered as the Storage Capacity
One obvious problem is that this is not anywhere close to the Storage Consumption adjusted case quantity Capacity at this location. All key figures at the top of the planning book for the storage capacity are listed in “Storage Consumption Adjusted Cases” (SCAC) quantities. The storage capacity in cases at 8264 is 825,000. Multiplying this by the average storage consumption factor of the overall products at 8264 (which is .69) brings the following.69 * 825,000 = 577,000. This is a little more than 1/3 of the capacity entered into this resource. This also explains that the storage resources always show such a low utilization. 8264 is slightly overcapacity, not at 40% of its capacity. This is further evidence that this view is not being used. The resource entries do not appear to have been validated.
The Ratio Between ZPS (Pallet Spots) and ZPP (Cases)
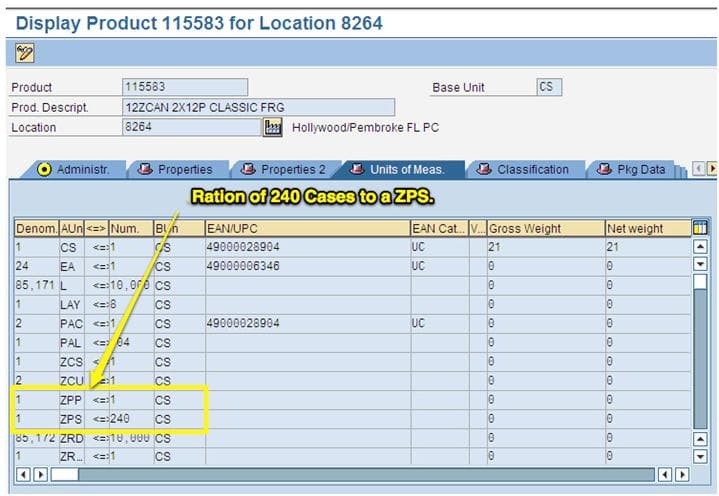
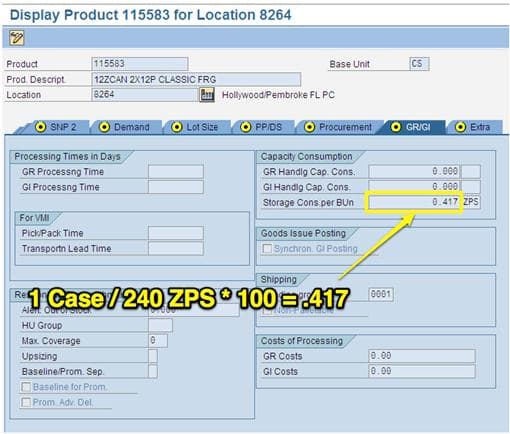
The values we have been looking at thus far have been for the entire location. In the example below, one of the products (115583) for the location (8264) shows 240 ZPP / cases per ZPS. However, the estimation of the total number of ZPS / Pallet Spots used is the number of units of different types of products planned to be stored at a location. The screenshot below shows how the ZPS is entered as an alternate unit of measure on the Product Location Master in APO (although initially entered in R/3 and flows over to APO.
This is, of course, only for this product. An extract of all products at location 8264 shows that the average ZPP / Cases to ZPS / Pallet Spot value is 165. Here is a sample of the ZPS unit of measure for products at 8264 below:

The Original Design
The number of ZPP / Cases per ZPS / Pallet Spots is only one part of the overall calculation.
ZPS Definition
ZPS is the estimated number of cases that consumes one pallet space. The ZPS changes depending upon the product.
ZPS Formula
ZPS = Cases Per Pallet * Stackability Factor (the number of pallets that can be placed on top of each other; this is an entered value that changed depending upon the product)
Storage Capacity Consumption
The storage consumption is a fraction of which is then applied to the case quantity.
This is one case divided by the ZPS value. So if a ZPS = 200, its Storage Consumption would be 1/200 * 100 = .5. This is then added to the product master in the Storage Consumption field. This results in a Storage Consumption that is then entered into the Material Master in R/3, which flows over to the Product Location Master in APO.
This is the value; the Storage Consumption is multiplied by the number of cases planned to be in the location to bring the Storage Consumption Adjusted Cases (SCAC). Therefore, to illustrate this, we will show the previous screenshot of the capacity view again, but this time within the context of what we have described up to this point.
Objectives of the Storage Capacity View
The goals to be met with the storage capacity view is the following:
- To obtain reasonably accurate visibility into the storage capacity.
- To develop an approach that has a reasonable effort level in terms of long-term maintenance.
- To have a storage capacity view that is simple to understand
- To try, as much as is feasible, to use a unit of measure commonly used within operations and planning at CCR.
- Tradeoffs in Inaccuracy in the Various Approaches to Storage Capacity
The premise behind using the ZPS factor and not cases is that the number of cases that fill that location changes depending upon the “mix” of products in a location. This desire for higher accuracy in how many cases fill a facility leads to a unit of measure that takes into account the cases per pallet and how many pallets of various products can be stacked on top of one another in one pallet space.
Accuracy of ZPS
While using a ZPS value reduces the product mix’s inaccuracy in a facility, it imposes another inaccuracy. Part of the ZPS calculation is based on the stackability factor. However, because of limitations on the R/3 side, this stackability factor must be applied uniformly for an SKU across all locations. This is a problem because there is a wide variation in the stackability by location. This means that the stackability factor at the shortest facilities sets the standard for all the facilities. For instance, the average stackability factor in a file filled with 7875 products was only 2.21. The average stackability factor would be 3 (2 for PET and 4 for cans) at larger facilities. This inaccuracy level is 35% (3 – 2.21)/2.21 for the more extensive facilities. The overall accuracy level determination would have to account for how much volume moves through smaller facilities versus larger facilities. However, the business need for storage capacity visibility is greatest at the larger facilities, exactly where the currently designed storage capacity is least valuable.
Disadvantages
However, while the ZPS approach provides a dubious improvement in accuracy in cases, it comes with another set of obstacles. These can be easily enumerated by repeating the list of objectives for this capacity view design and adding orange comments after each objective.
- To obtain reasonably accurate visibility into the storage capacity (Not more accurate than cases)
- To develop an approach that has a reasonable effort level in terms of long-term maintenance (More effort than cases, less likelihood of being maintained)
- To have a storage capacity view that is simple to understand (More difficult to understand)
- To try, as much as is feasible, to use a unit of measure that is commonly used within operations and planning at CCR (Pallet Spots or ZPS is not a widely used term in planning or operations)
- Therefore, ZPS combines both dubious improvements in the accuracy of the current design (its original intent) with negatives in all the stated objectives of the storage capacity view compared to using cases.
Tradeoffs in Inaccuracy in the Various Approaches to Storage Capacity
The current design accepts a limitation, which is unnecessary to accept. This limitation has been accepted because it has been assumed that the logic for the cases per pallet spot must be included in the unit of measure. However, this is not correct. Under the current design, different ZPSs and different storage consumption per unit of material (which can be in any UOM) are assigned per product. However, the approach is more complex. It provides lower accuracy than an alternative method, which I will describe below, as only one ZPS / Cases per Pallet Spot can be applied for all locations.
Alternate Design
The alternate design can meet the following objectives in the following ways in blue:
- To obtain reasonably accurate visibility into the storage capacity (Stacking factors can be adjusted per location)
- To develop an approach that has a reasonable effort level in terms of long-term maintenance (Complexity can be reduced, and all storage consumption logic can be reduced from two numbers to one number)
- To have a storage capacity view that is simple to understand (The storage capacity view can be made more simple to understand, although not as easy to understand as if straight cases were used)
- To try, as much as is feasible, to use a unit of measure that is commonly used within operations and planning at CCR (This alternate approach would not meet this objective)
The alternate design is made up of the following steps:
- Remove the ZPS Unit of Measure and use ZPP instead. The logic will not be contained in the Storage Consumption per B.Un field.
- Develop a standard pallet spot average (150, or 165, etc..)
- Rate each product at a percentage above or below the average. This is the storage consumption factor (SCF).
- Use a location adjustment factor for each location. This is the location consumption factor (LCF)
- The SCF is then multiplied by the LCF. The result is the Storage Consumption Location Factor (SCLF).
Apply the SCLF to the Storage Consumption per Unit field on the GR/GI tab. - Locations will report on their maximum storage capacity in cases, which the SCLF will adjust before entering the location storage resource. (This can be arrived at by dividing the actual value shown in the Capacity Consumption key figure of the planning book by the Quantity Stored key figure)
- Planners must explain that what they see is the SCLF (adjusted cases), not the cases at the top of the storage capacity planning book.
- The system will then calculate an adjusted case quantity per location.
The spreadsheet below shows how the SCLF would be arrived at.
Only three pieces of data are required for this design:
- An (average) number of cases per pallet spot for all products
- A product specific number of cases per pallet spot
- A location factor (to adjust for the stackability of the location)
Advantages
- The method can work with any location estimation method that is desired.
- The changes in the mix can be adjusted as often as desired and is a simple calculation.
Conclusion
This investigation began with attempting to understand the design of the storage resource view and see how it could be recovered and improved, as it is neither used nor understood by planners. That objective was accomplished; however, the outcome of the analysis is twofold:
The current design could be used but with better socialization of the design to planners. If this current design is kept, this can be done with minimal effort and would only require a few screenshots and included in the training documentation.
The current design does not provide demonstrably better accuracy than only using cases and scores poorly in all the stated design objectives.
The recommended alternate design would be significantly superior to many criteria, including accuracy. The simplest approach would be to move to cases; however, this would be less accurate than the alternative design. It would, however, be less work.