
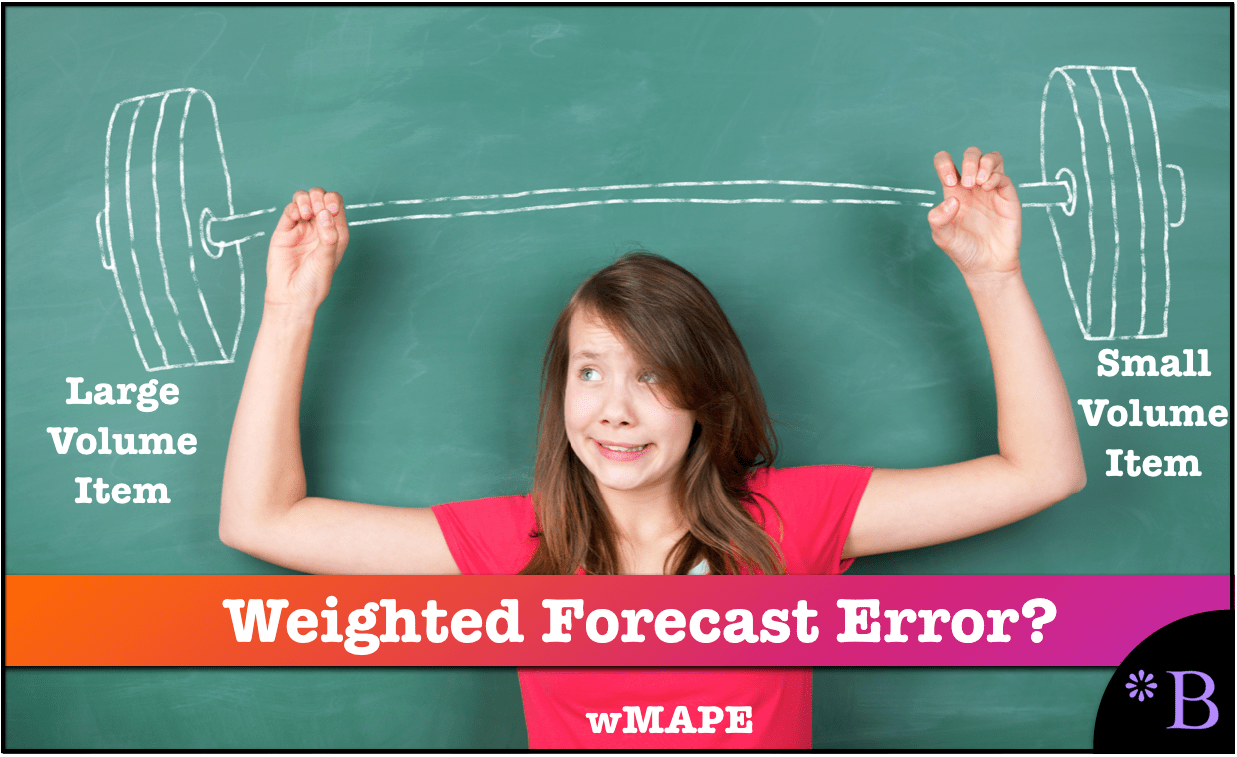
How to Use Weighed MAPE for Forecast Error Measurement
Executive Summary
- MAPE, or Mean Absolute Percentage Error, is a method of forecast error calculation that removes negatives from the equation.
- The MAPE calculation must be weighed to obtain a view of the actual forecast error in relation to the overall forecast database.
Introduction (Skip if You Watched the Video)
MAPE, or Mean Absolute Percentage Error, is a forecast error calculation method that removes negatives from the equation. It is easy to understand and easy to calculate. It also is proportional. MAPE is a universally accepted forecast error measurement, even though MAPE is generally moderate in effectiveness in providing feedback to improve the forecast. However, as with other forecast error measurement calculations, the MAPE calculation must be weighed to view the actual forecast error concerning the overall forecast database. You will learn about MAPE calculation, different ways of calculating weighted MAPE, and broader implications for forecast improvement using the MAPE.
Our References for This Article
If you want to see our references for this article and related Brightwork articles, visit this link.
Weighed Forecast Accuracy 1
| Forecast | Actual | 6 Month Average Forecast | Unweighed Accuracy | Weighed Accuracy | |
|---|---|---|---|---|---|
| Product B | 20 | 5 | 20 | 25% | .045 |
| Product A | 200 | 150 | 200 | 75% | 1.36 |
| Average | 50% | 70% |
Weighed Forecast Accuracy 2
| Forecast | Actual | 6 Month Average Demand | Unweighed Accuracy | Weighed Accuracy | |
|---|---|---|---|---|---|
| Product B | 20 | 5 | 28 | 25% | .078 |
| Product A | 200 | 150 | 150 | 75% | 1.26 |
| Average | 50% | 67% |
Demand History Weight Comparison
| Jan | Feb | Mar | Last Month | Three Months Average | |
|---|---|---|---|---|---|
| Product B | 20 | 30 | 6 | 6 | 18.66 |
| Product A | 100 | 100 | 200 | 200 | 133 |
For instance, if a forecast is generated for one month, and last month’s demand is used, the weight of product location combinations that happen to be having a big month will increase versus either stable items or those having a down month.
A disadvantage to using shorter durations is if the demand history varies significantly throughout the year.
The Coverage on Weighting Forecast Error
Curiously, virtually no videos are explaining how to weigh forecast errors. (Searching for the term “weighted forecast error” instead of “weighing forecast error” delivered the same results you see above.)
Virtually all forecast error coverage depends on which forecast error measurement method or mathematics is used. However, forecasting error weighing is critical to report on a grouped error. And non-weighed forecast error does not have any meaning. Most of the material on forecast error coverage seems comfortable explaining how to measure and report on forecast error at the line time — or at the product location combination.
The Practical Issues with MAPE
| Issue Name | An Issue Shared With Other Error Methods? | Description |
|---|---|---|
| MAPE cannot process periods of zero demand in history. |
Why Do the Standard Forecast Error Calculations Make Forecast Improvement So Complicated and Difficult?
It is important to understand forecasting error, but the problem is that the standard forecast error calculation methods do not provide this good understanding. In part, they don't let tell companies that forecast how to make improvements. If the standard forecast measurement calculations did, it would be far more straightforward and companies would have a far easier time performing forecast error measurement calculation.
What the Forecast Error Calculation and System Should Be Able to Do
One would be able to for example:
- Measure forecast error
- Compare forecast error (For all the forecasts at the company)
- To sort the product location combinations based on which product locations lost or gained forecast accuracy from other forecasts.
- To be able to measure any forecast against the baseline statistical forecast.
- To weigh the forecast error (so progress for the overall product database can be tracked)
 Getting to a Better Forecast Error Measurement Capability
A primary reason these things can not be accomplished with the standard forecast error measurements is that they are unnecessarily complicated, and forecasting applications that companies buy are focused on generating forecasts, not on measuring forecast error outside of one product location combination at a time. After observing ineffective and non-comparative forecast error measurements at so many companies, we developed, in part, a purpose-built forecast error application called the Brightwork Explorer to meet these requirements.
Few companies will ever use our Brightwork Explorer or have us use it for them. However, the lessons from the approach followed in requirements development for forecast error measurement are important for anyone who wants to improve forecast accuracy.