
When to Use Lean or Reorder Point Planning Versus MRP
Executive Summary
- The question of when to use Lean versus MRP is what sets part of the planning strategy.
- We cover when to use reorder points versus MRP planning.

Video Introduction: When to Use Lean or Reorder Point Planning Versus MRP
Text Introduction (Skip if You Watched the Video)
The question of when to use Lean versus MRP is critical to determine when to use a non-forecast based method of supply planning (reorder points) and forecast based planning (like MRP). Many companies do not have a method of segmenting their reorder point planned from their forecast based or MRP planned production location combinations. You will learn the logic behind this segmentation, and why changes have increasingly pushed a higher percentage of the product location database at many companies into non forecast based planning.
Our References for This Article
If you want to see our references for this article and related Brightwork articles, see this link.
Differentiating Planning From Physical Shop Floor Movements
Lean is a combination of techniques based on principles that have already been covered up to this point. If we put aside the management and the process aspects of Lean for a moment, some of them relate to planning in terms of the specific techniques. Therefore, they are competitive with MRP and other planning procedures, and others are related to execution movements that occur after planning is performed. KANBAN (also developed by Taiichi Ohno) is a perfect example of one of these Lean techniques. KANBAN, as pointed out by Wikipedia, is not an inventory control system. Instead, KANBAN is a technique for scheduling the movement of material within a factory floor. KANBAN and other Lean techniques are very focused on keeping WIP as low as possible. MRP, if capacity leveling is not performed, is only concerned with meeting demand. If capacity leveling is performed, it is also concerned with scheduling production in a way that meshes with the resources’ capacity. Other planning methods, such as cost optimization, maybe more sophisticated in planning while accounting for constraints. But they are also unconcerned or are not designed to minimize WIP.1 The question becomes how to integrate two control mechanisms (MRP/planning and Lean/execution) in a way that leverages the best of each. While reorder points can be used, in most cases, it is not desirable to use reorder points exclusively for planning. On the other hand, MRP/planning does not have much to “say” concerning what happens after the plan is generated.
Indeed, any planning method can be rerun up until the product is produced; however, it does not make very much sense while many companies do this. MRP and similar planning systems have a frozen period, which declares a timeline where changes cannot be made. This frozen period in the supply and production planning system determines the hand-off of responsibility for managing the activity. If a company has a one-week frozen period, then changes should not be made, and in fact, MRP should not even be run for this period.
This can be easily controlled in the system in its configuration. Continuing to run MRP for this period produces two undesirable outcomes. First, it, of course, moves the schedule around – but secondly, it creates confusion as to what mechanism controls the process. Frozen periods are very appropriate because the MRP system’s frozen period declares when MRP no longer controls what is happening and the responsibility for the production and procurement shifts to another system, and often another group of people. MRP and Forecastability MRP and all other supply planning procedures are forecast-based planning methods. They all assume a certain level of forecast accuracy, which bears a certain level of forecastability on the part of the product location combinations. However, if we consider the environment where Lean was developed in Japan, we can see that Toyota was facing a situation of low forecastability:
“Levels of demand in the Post War economy of Japan were low and the focus of mass production on lowest cost per item via economies of scale therefore had little application. Having visited and seen supermarkets in the USA, Taiichi Ohno recognized the scheduling of work should not be driven by sales or production targets but by actual sales. Given the financial situation during this period, overproduction had to be avoided, and thus the notion of Pull (build to order rather than target driven Push) came to underpin production scheduling.” – Wikipedia
Many products that are difficult to forecast have no discernible pattern in their demand history, and no mathematical algorithm can create a reasonable forecast without one. This is a well-observed phenomenon, is increasing as a trend, and is in significant part driven by forces inside, rather than outside, of the company.
“Nearly every company is 30 t0 40 percent unprofitable by any measure. In almost every company, 20 to 30 percent of the business is highly profitable, and a large proportion of this profitability is going to cross-subsidize the unprofitable part of the business. The rest of the company is marginal. The most current metrics and control systems (budgets, etc.) do not even show the problem or the opportunity for improvement.” – Islands of Profit in a Sea of Red Ink
“Some managers argue that it is a good idea to accept business that contributes, even marginally, to covering overhead. However, when you take on a lot of business that contributes only marginally to overhead, in almost all cases it will absorb a significant amount of sales and operations resources that otherwise would have been devoted to increasing your “good” business. And it will remain and grow into the embedded profitability that drags down earnings in company after company. “If the underlying reason for taking marginal business is to fill unused capacity, you need a sunset policy to stop taking the marginal business once capacity is filled and to remove it when full freight business is available. Not many companies have the information and discipline to do this.” – Islands of Profit in a Sea of Red Ink
So first, most companies carry far too many products, which reduces forecast- ability. This is referred to as product proliferation.
Product Proliferation
Product proliferation is the increase in the number of products carried, which dramatically impacts when to use Lean versus MRP. Often the marketing differences between the products are only incidental and illusory. Proliferation would be even worse than it currently is, but retailers only have so much space to offer. An excellent example of product proliferation is toothpaste.

Most of these toothpaste containers essentially contain a similar set of chemical compounds; however, marketing provides customers with different varieties of the same product to promote purchases.
Many of the claims are unfounded, but because there is very little regulation (in the US at least), they can say what they like regarding what the toothpaste will do for consumers. Whether something is true or not is barely mentioned (that is written on the packaging). Anyone who might bring this up is considered hopelessly naïve, as the primary focus is whether or not the claim will increase sales. This is the problem – when you create incentives for groups that are entirely focused on maximizing sales, it is quite predictable that the company will metastasize into areas that are not profitable. There may be no better example of an industry that has gone to the extreme with unnecessary product proliferation than the grocery industry. The typical US grocery store has between 35,000 and 50,000 SKU’s, which is a massive increase in SKU’s over the past several decades. When standing, one can no longer see over most grocery store shelves. However, one grocery chain takes a different path, which is a major reason they perform so much better than the industry average. I covered Trader Joe’s in my first forecasting book, Supply Chain Forecasting Software.
A fundamental principle of Lean is smooth production. This is referred to as Heijunka, and the approach to smoothing production through scheduling is called the Heijunka Box, which is one factor in when to use Lean versus MRP. One of the “Seven Zeros” described by Edward Deming and outlines the ideal production environment is Zero Surging. However, Sales and Marketing are destroying the Heijunka! This is because of their insistence on having the company carry so many products and having them available at such high service levels. Toyota controlled its demand variability by controlling the product mix. This is explained in the following quotation from Factory Physics:
“Toyota’s product design and marketing were so successful that demand for its cars consistently exceeded supply. This helped in several ways. First, Toyota was able to limit the number of options of cars produced. A maroon Toyota would always have maroon interior. Second, Toyota could establish a production schedule months in advance. This virtually eliminated all demand variability seen by the manufacturing facility.”
Thus Toyota controlled most of the demand variability, which left it only with manufacturing and supplier variability. Therefore, Lean and the high variability of demand self-generated within companies by Sales and Marketing are a poor fit for Lean – something I have never heard brought up. Of course, product proliferation is only one of the negative externalities caused by Sales and Marketing – another is promotions.
Promotions
In many companies, Sales and Marketing increasingly view promotions as a major part of the overall strategy. Promotions have significantly increased in their frequency. According to Gartner, roughly 20 percent of manufacturers’ revenue is spent on promotions, up from 0.5 percent in 1985.2 This is one of the largest increases of any expense item.
For many consumer packaged goods companies, promotions are the majority of their overall advertising expense. Furthermore, the use of promotions is likely to increase in the future. One of the limitations to performing more promotions is related to technology – something that vendors of promotion management software are alleviating by increasing their software sophistication. We can tell because it’s evident in software vendors’ marketing literature that sells promotion management software to companies. Retalix is one of the software vendors that specialize in this type of software.
“’With hundreds of promotions happening across thousands of items simultaneously, oftentimes more than one department is promoting the same item,’ said Bob Smith, product manager for Retalix Loyalty. ‘This becomes a critical business problem for everyone involved, because not only will the item have a lower margin, it can even sell at a loss.’”
Software vendors ranging from JDA to IBM to Junction Solutions make promotion management software, and this category of software is quite broadly implemented at CPG clients. These applications are singularly focused on allowing companies to implement increased numbers of, and increased complexity of, promotions. However, these applications do nothing to update the promotion information in the forecasting system.
Of course, any system can have its data extracted and put into another system with an interface, but this is not the focus of these software vendors’ marketing literature. They also do not bother to mention that there is increased overhead in accounting for promotions in demand history. They are focused on selling their software to companies by offering them compelling options to run increasingly complex promotions. Once again, the line of reasoning is that promotions are “free.” They are actually “all benefit and no cost.”
At least somewhat amusing is that JDA, which sells this promotion management software, also sells forecasting software. However, once again,
JDA’s marketing literature on promotion management software makes no mention of the overhead and complexity that all of these complicated promotions create for forecasting generally. Therefore, just as with the corporate buyers of software that often work towards conflicting objectives, JDA does the same thing in its software lines as a software vendor. It offers functionality to Sales and Marketing that optimizes their needs at the expense of forecasting. While providing a forecasting solution that then attempts to deal with the extra forecasting complexity driven by the company’s promotions, the company can now run more of because they purchased JDA’s promotion management software. All of this is covered in detail in the book Promotions Forecasting: Techniques of Forecast Adjustments in Software.
Sales and Marketing still feel quite hamstrung by not being able to run more promotions. Some in Sales and Marketing question whether there may be too many promotions and whether they have negative consequences, but most of the sentiment lies with increasing the use of promotions.
“CPG companies often spend anywhere from 8 percent to 20 percent of revenue on promotions. Various studies suggest that anywhere from 25 to 70 percent of CPG suppliers’ trade promotion spend (their expenditure) is ineffective. Some quick math suggests that for every billion dollars in revenue, at least $20 million to $50 million, and likely significantly more, is being poorly spent. That is a substantial amount of money that could be better applied to product innovation or other more significant drivers of growth and brand equity.” – Uncovering the Hidden Costs of Trade
The Complexity Added by Promotions
Promotions are an added complexity to any business. There is what is referred to as a churn caused by constant promotions, introducing chaos into the management of products. Lean proponents talk a great deal about reducing mura, which is Japanese for unevenness. However, promotions produce nothing but unevenness. Lean uses various techniques for keeping mura in check, such as control charts that leverage statistical process control. However, that can only help control for unevenness that is part of the supply chain process – but promotions are unevenness imposed from outside the supply chain process. The control chart’s entire concept is that the root cause of the variability is found and then addressed.
However, the root cause of promotion variability cannot be addressed because, at most US and European companies, the supply chain does not have any influence over the number of promotions run by Sales and Marketing. 4 No control chart will help with this type of unevenness. After all, it requires a confrontation with the Sales and Marketing entities responsible for the unevenness.
“We have found that trade promotions can play havoc with the sales forecasting process, creating promotion-driven seasonality in historical sales data when distributors increase their inventories in response to periodic price promotions from manufacturers rather than to anticipated increases in consumer demand.” – Sales Forecasting Management
If you read a typical book or article covering this topic, there is often a great willingness to point out that the product database has “exploded” and that product life cycles are decreasing, but a remarkable unwillingness to explain why this is the case. The reader is left with the definite impression that all of these changes are driven by the market. In fact, companies themselves, specifically sales and Marketing within these companies, are driving these changes. I believe that it is misleading the reader not to point out that much of these changes are, in fact, self-imposed by the company itself.
Determining Forecastability
Products that have a very stable history exist at the other end of the continuum of forecast difficulty. Typically, it is effortless to forecast for products with a stable demand history. However, if this is the case, actively forecasting the product does not add value to supply planning (the ultimate consumer of the demand plan). A product with stable demand history does not need to be forecasted. Products with stable demand can be managed effectively and efficiently with reorder point logic, where orders are based upon a reorder point or a reorder period. Intermittent – or “lumpy” – demand is one of the most common features of a product’s demand history that makes a product unforecastable. Service parts are the best-known example of a product with lumpy demand. However, I have come across intermittent demand in many different types of companies. For instance, one of my clients was a textbook publisher. A large percentage of their product database had an intermittent demand history, which would typically not be expected of this product type. However, because different US states buy textbooks in large volumes whenever funding comes through, the demand ends up being quite unpredictable for many books. A school system will not make any purchases for some time and then buy many textbooks all at once. For example, California is on a seven-year procurement cycle, which means they wait seven years between purchases.
Managing Products With No Forecast With Supply Planning
When speaking of supporting supply planning, it is, in fact, not necessary to forecast the entire product database. This leads directly to the question of when to use Lean versus MRP. However, the vast majority of companies think that they should, and they do so. The only products that can be forecasted using statistical forecasting have a discernible pattern of demand, and not all products have this. Without a discernable pattern, no mathematical forecasting method can beat a many-period moving average. In many cases, the most effective approach of dealing with products that are very hard to forecast (or so easy to forecast that forecasting becomes unnecessary) is to remove their forecast from the supply planning process. Although they will typically still be forecasted by the demand planning systems, these forecasts can be used for other purposes.
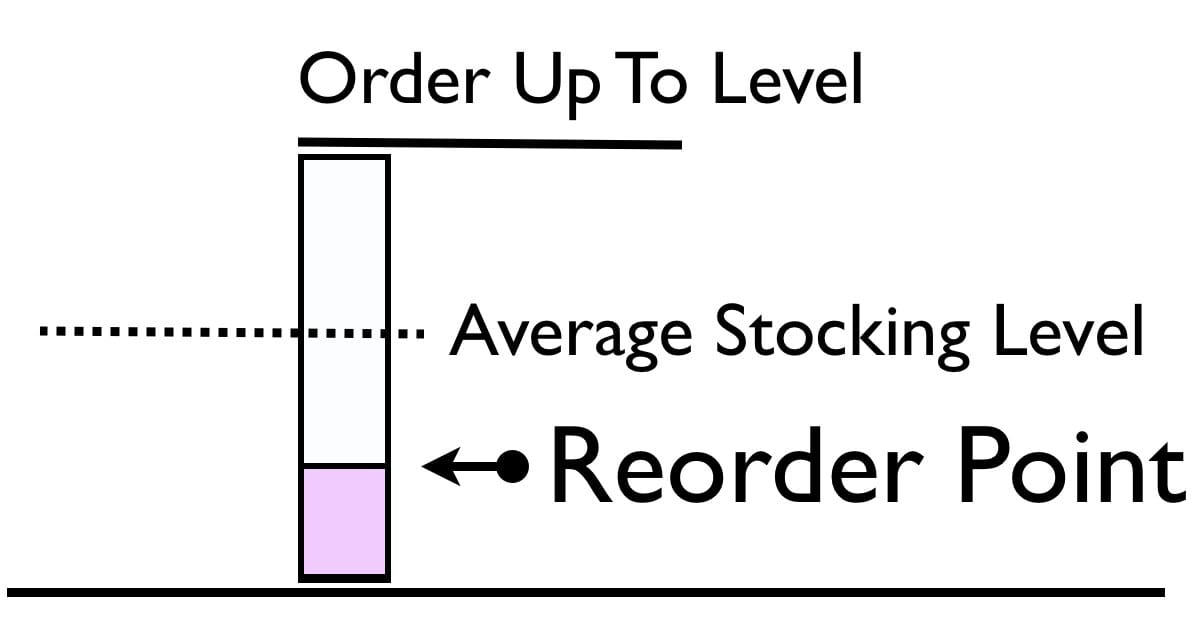
These product location combinations can be placed on reorder point planning. At one company I consulted for, reorder point planning could have been used for around half of the product database. The percentage varies with the product type and the activities of the company, among other variables. Reorder point planning works for both items with uniform consumption and erratic consumption. In the case of difficult to forecast items, they have an unstable demand history. The reorder quantity is therefore high, and the safety stock is high. Because it cannot be predicted when demand will arrive, there is no other solution than to carry a large amount of stock (relative to average monthly demand) to fulfill demand when it arrives.
This is simple to do with reorder point planning. For stable items, the amount of stock (average monthly demand) is low. The safety stock is relatively low. Therefore, reorder points work for both types of demand history; however, the distinction is how high, relative to average demand, the stocking level can be set, and the reorder quantity (or reorder duration).
“The reorder point, on the other hand, always orders materials whenever the on-hand balance is below the reorder point, regardless of whether more is actually needed. In this case, there is enough on hand to satisfy the demands. But the reorder point system doesn’t look at what is needed. Instead, it blindly attempts to keep a certain amount of inventory on hand at all times.
“Examples show that reorder points are an obsolete technique – an invalid inventory model – and should not be used in any situations where inventory is maintained. They simply do not provide the visibility to see when product is actually needed and when problems are likely to occur.” – Distribution Requirements Planning
This criticism of reorder point planning only holds for forecastable items. However, for erratic demand items, the system cannot “look at what is needed” because it is inherently unknowable. The fact that the item has such a high forecast error means that the supply planning system is already “blind.”
Applying a supply planning method does not change this fact. For highly stable products, the reorder point that is set can easily order the right amount. Items with a stable demand pattern are easy to model with reorder points, so it is, in fact, not blind at all. There is simply a little benefit to passing a forecast to the supply planning system in this scenario.
“It is normally reserved for products without dependent requirements, like spare parts or consumables. However, it is also possible to use reorder point planning in combination with future requirements. An example of use for products with an erratic demand, like spare parts for customer service.” – Delaware Consulting
This is not necessarily a criticism of reorder point planning; however, I do not see how the reorder point planning should be limited to products without dependent requirements. Reorder points can be set in the supply planning system for finished goods, and then the BOM can be exploded with or without MRP for all the dependent items. However, I agree that it makes little sense to set dependent products on reorder point planning.
“Manual reorder points are even less effective in larger organizations. When an organization must plan across a large enterprise, particularly a vertically integrated enterprise, it is left with few viable and satisfactory options. The lack of visibility means that organizations of size or even moderate complexity are flying blind to the overall materials and inventory picture. Furthermore, manual reorder points and KANBANs do not consider the bill of materials in its totality. The KANBAN is defined only at each discrete connection. This means that stock positions must be placed at every position in the bill of material. This strategy, in turn, increases the number of stocked positions to manage and potentially raises total inventory.” – Orlicky’s Material Requirements Planning (3rd Edition)
Orlicky criticizes reorder point planning from several directions in this quotation. The clearest way to address each of his points is to list them one by one in a numbered format.
- The enterprise’s size is irrelevant to whether reorder point planning should be used, and Orlicky provides no evidence to support the statement as to “why” this would be organization-size-dependent. Rather than the organization, it is the attributes of the product demand history that determine whether reorder point planning should be used.
- Again, the statement regarding a lack of visibility is true for erratic demand products no matter what method is used. A low forecast accuracy means that visibility is, by definition lacking. Using a supply planning method does not change the basic unforecastability of a product. “Visibility” is provided by merely setting the reorder point to something consistent with the average demand.
- Reorder points do not have to consider the bill of materials in their totality because, as I stated earlier, they can only be set for the finished good. All dependent demand can be extrapolated from a BOM explosion without MRP or a BOM explosion with MRP. Something that needs to be considered by critics of reorder point planning, but seems to be frequently ignored, is that all items in the BOM don’t have to be planned the same way.
All of the criticisms listed above and the complaints generally suffer from a need to make a universal statement regarding reorder point planning usability when a universal statement cannot be made. Reorder point planning is useful under certain conditions. One might think that it’s not possible to stop using the forecast generated by the demand planning system for supply planning. It is quite possible and easy to implement. However, there can be a fair amount of complexity in the methods designed to calculate reorder points (something that is not commonly understood by those that oppose reorder point planning because it is too simple).
In the book Supply Planning with MRP/DRP and APS Software, I cover reorder point planning differently from covered in several supply planning books so that I won’t repeat the information here. Suffice it to say that there are many cases where it is better not to send a forecast to the supply planning system, and the supply planning system will still manage quite well. Therefore, a simple moving average forecast can be sent for unforecastable products or no forecast at all.
Reorder Point Settings
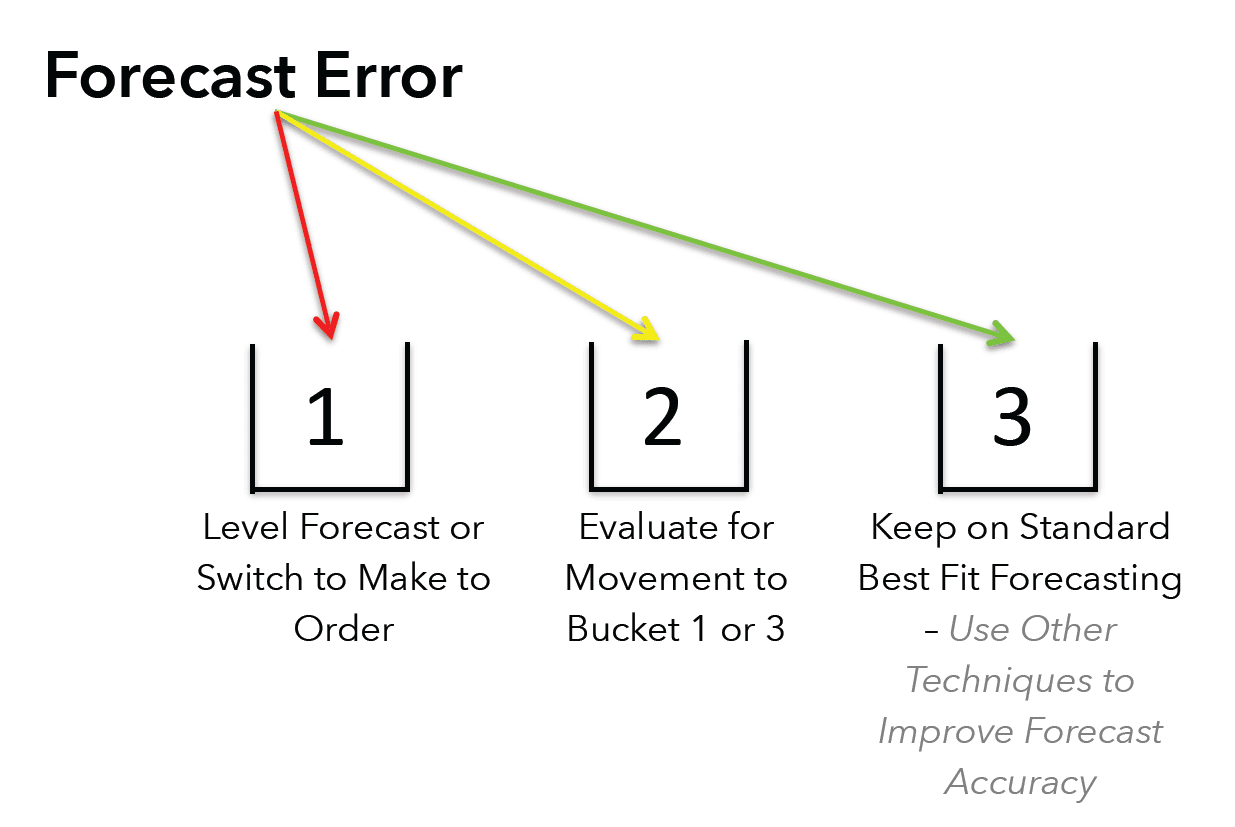
Reorder point setting does not require a forecast because the order is placed when the inventory drops to a certain level. However, there is no one “right way” of doing this. Regardless, the company gets away from continuing to invest effort in forecasting unforecastable products. Analyzing the product database’s forecastability is one of the critical steps to moving toward a more effective way of managing the forecasting process. A more advanced forecasting method cannot reasonably be expected to be an improvement over a simple, long duration, moving average forecast for some products. Several trends are reducing the product database’s forecastability, including actions by Marketing (such as promotions) and SKU proliferation (spreading the same demand over more products).
Interestingly, the connection is not frequently made between these trends and forecastability. The more erratic demand becomes, the less forecasting can add value, and increased inventory amounts must be carried to ensure that sufficient stock exists when demand does arrive. This fact is lost on people who are unfamiliar with forecasting.
The Concept of Coding a Product Location Database
Companies tend not to correctly code their product location database so that different product locations can be treated appropriately by the system. However, this coding can be valuable so that a short code can tell anyone who works with the product location combination (PLC) both the PLC’s basic properties and how the PLC is set up in the system. This coding is not static because the PLC is periodically reviewed or reviewed based upon market intelligence. However, if the coding is kept up to date, it can be beneficial for some supply chain planning purposes.
A PLC can then be coded for whether it is forecastable. If it is forecastable, this leads to another set of questions; if it is not forecastable, this leads to a different set of questions. To help people follow this conditional logic, it is programmed in the calculation form below. Try switching the first drop down between forecastable and unforecastable to see how the rest of the calculation form changes.
Master Data Review Cycle
As was explained earlier, the PLCs must be reviewed and updated on a periodic cycle. However, PLCs differ in terms of their review. Before computers were available, PLCs were placed on a review cycle for actually calculating order quantities. A review cycle might look something like this:
- Products 11234 to 11500 – 1st Monday of the Month
- Products 11500 to 15340 – 2nd Tuesday of the Month
- Products 15341 to 16201 – 3rd Wednesday of the Month
Computers did not compute the order quantities; this was something that inventory analysts had to perform. When computers did arrive on the scene, software vendors began touting their “perpetual inventory” abilities. This meant that when a goods receipt was recorded, the inventory was immediately recalculated. This also allowed companies to carry less inventory because, before computers, safety stock had to cover variability in lead time and forecasts and the longer period between reviews.
In a computerized system, if a larger than forecasted order comes in, it may reduce the planned stock below the reorder point – and the instantaneous calculation will cause a new order to be generated. In a manual periodic review system, that product may need to wait until recalculation by an inventory analyst (unless the analysts reviewed all of the large orders and then recalculated just those PLCs ahead of the rest of the PLCs in their rotation.) Interestingly, the book Decision Systems for Inventory Management and Production Planning does propose an advantage to periodic review and periodic ordering.
Items may be produced on the same piece of equipment, purchased from the same supplier, or shipped in the same transportation mode. In any of these situations, coordination of replenishment may be attractive. In such a case, periodic review is particularly appealing in that all items in a coordinated group can be given the same review interval. In contrast, under continuous review, a replenishment decision can be made at practically any moment in time; hence the load is less predictable. A rhythmic, rather than a random, pattern is usually more appealing to the staff.
This master data review cycle concept is the same as was applied previously to inventory management, but of course, a lot less work because this review cycle is for setting master data and prevents the settings from falling out of date. This is also important because master data is often changed in reaction to short-term needs but then not changed back. This is a crucial quality checking process and an essential process for adjusting the PLCs as things change over time.
How Should EOQ and Other Supply Planning Parameters be Calculated?
One would be able to, for example:
Item #1: Simulation
Set the supply planning parameters in a way that one can simulate the impact on the overall supply plan. When using supply planning systems, inventory parameters are typically managed on a "one by one" basis. This leads to individual planners entering values without considering how inventory parameters are set across the supply network.
Item #2: Interactivity of Changes
This is the ability to see the relationship between changes to service levels and the simulated output.
Item #3: Seeing Financial Implications
This is the ability to see the impact on the dollarized inventory for different aggregate settings.
Item #4: Mass Change for Efficient Maintenance
This allow the parameters to be changed en mass or as a mass change function. Both supply planning systems are designed to receive parameters; they are not designed to develop the parameters.
 Getting to a Better Parameter Setting Capability
We developed an approach where EOQ and reorder points are calculated externally, which allows for a higher degree of control. And for the average inventory to be coestimated in a way that provides an observable total system inventory, holding cost, service level, and a picture of what is happening to the overall system. Calculating individual parameters like EOQ without an appreciation for the systemwide does not make any sense. Also, in many, perhaps even most cases, there is no reason to use EOQ for the purposes given above. Instead, an alternative custom order batching method can be created to replace EOQ. There is nothing magical about EOQ. It is not a "best practice." It will not provide you with "digital transformation." It is not "Six Sigma." You will not get a "black belt" for using it.
After observing ineffective and non-comparative supply planning parameter setting at so many companies, we developed, in part, a purpose-built supply planning parameter calculation application called the Brightwork Explorer to meet these requirements.
Few companies will ever use our Brightwork Explorer or have us use it for them. However, the lessons from the approach followed in requirements development for supply planning parameter maintenance are important for anyone who wants to improve order batching and supply parameters.
Conclusion
We tried to answer the question of when to use Lean versus MRP in this article.
Now that we have identified the PLCs that will go out on either the appropriate procedure or the Lean approach, the next step is implementing this coding system. Of course, there are many systems out there that perform supply planning, so it isn’t easy to precisely guess the system you, the reader, will use. However, by providing an example, it should replicate the configuration in your supply planning system. In ERP systems, there are only two methods that can be used. There is MRP for the initial supply and production planning run and then DRP for the deployment planning run. Reorder points can also be used at any product location combination. In APS systems, there are many more options for the supply planning method. However, each product location combination can be coded for any of these procedures or reorder point planning. How to implement this in systems will be the subject of the next chapter.
It is a relatively simple matter in a supply planning system to convert some product location combinations to pure reorder point planning and other product location combinations to being processed with a supply planning method. Furthermore, a product may be planned in one way at one location and planned a second way at a different location.
We developed an approach where reorder points are calculated externally, which allows for a higher degree of control and for the average inventory to be coestimated in a way that provides an observable total system inventory, holding cost, service level, and a picture of what is happening to the overall system. Calculating individual parameters like reorder points without an appreciation for the systemwide does not make any sense.