
When to Use Reorder Point Planning
Executive Summary
- The question of when to use reorder point planning relates to several important factors.
- We cover when to use reorder points versus forecast based planning.

Video Introduction: When to Use Reorder Point Planning
Text Introduction (Skip if You Watched the Video)
When determining when to use reorder point planning, it is critical to determine when to use a non-forecast based method of supply planning like reorder points and forecast-based planning, like MRP. Some product location combinations cannot have their forecast accuracy improved sufficiently to make them worth planning with a forecast best method unless that forecast is level or a many period moving average. You will learn how to determine when a product location combination should have one or the other planning approach applied.
Our References for This Article
If you want to see our references for this article and related Brightwork articles, see this link.
When to Use Reorder Point Planning
Items placed on a reorder point methodology could be placed there for the following reasons.
- Forecastability: They are difficult or impossible to forecast… or they have a level forecast because their demand history is so stable.
- Lead Times: Their supply is relatively unconstrained, and their lead times are short.
Any products in these categories are essentially either not worth the effort to plan with more advanced methods, or advanced methods do not add value to their planning over the simpler reorder point planning process. This does not seem to be a very well understood point by those that work in MRP/procedural planning. As is pointed out by E. A. Silver in his well-regarded paper on ideas related to inventory control for items with erratic demand patterns:
Most useable inventory control procedures are based upon assumptions about the demand distribution (e.g., unit sized transactions or normally distributed demand in a replenishment lead-time) that are invalid in the case of an erratic item. If this is not the case, the procedures tend to be computationally intractable.
This paper was written back in 1970. However, an enormous increase in computational power since that time has not made the problem more “tractable.” Although often overlooked, all supply planning methods are designed to be used with products forecasted within a particular accuracy range.
If the forecast accuracy is too low, the procedural methods of supply and production planning are undermined. If the forecast accuracy is too high, reorder point planning can provide equal quality but with much less effort. Procedural planning is the best fit for product location combinations with accuracy levels that are neither too low nor too high. Paradoxically, the understanding of where supply planning procedures can add value is different than this, with the concept being that the worse the forecast accuracy, the more a sophisticated planning system can add value.
There is a strong orientation within companies to create forecasts for all items in the product database. However, this does not necessarily mean that the forecast should be used for every product location combination in the supply planning system. A forecast is created in the demand planning system. However, for most companies, some portion of the product database cannot be reliably forecasted. Thus, forecasts are emphasized by demand planning for some product location combinations that add no value to the supply planning process.
Specifically, not all product location combinations can have their forecast improved by a more complex forecasting method (which is the continual hope of many) than a simple long-horizon moving average resulting in a level forecast. This applies equally to very stable products, as they also will use a level forecast. Reorder point planning for the finished good (as the associated finished and raw material supply plan is driven from the finished good supply plan) is an effective and low effort/low cost approach for product location combinations that fall into this category.
When is Reorder Point Used: The Relationship Between MRP and Forecastability
MRP is a forecast-based planning system. It assumes a certain level of forecast accuracy, which in turn implies a certain level of forecastability on the part of the product/location combinations. I have analyzed a good number of product databases over the years, and many of the products that I have examined from different companies are unforecastable. There is a simple reason for this. Many products that are difficult to forecast have no discernible pattern in their demand history and, without a discernible pattern, no mathematical algorithm can create a good forecast. For statistical forecasting, the only products that can be forecasted are those that have a discernible pattern to their demand history, and not all products have this pattern.
Published Material and Coverage of Reorder Points
There are very few books that cover reorder points. I am not sure why this is, but I have an inkling because reorder points are considered passé. Reorder points are not trendy. Reorder points are covered in many supply chain books, but it is almost always from a high level, with most stopping at simply explaining the reorder point calculation. However, on the other hand, there seems to be an innumerable number of books on Lean. I find it strange how Lean could be considered a “hot” topic, while reorder points would be regarded as passé because reorder points are among the dominant methods within the Lean toolkit. For some reason, Lean books tend to be promotional. Several consultants work in Lean, and clearly, many of these books are designed to help increase their consulting business.
There is quite a bit on the topic of reorder points in terms of the academic literature, with older publications providing a more basic reorder point coverage and with more modern publications providing quite esoteric reorder points calculations.
Determining Forecastability
Forecastability can usually be determined – or at least indicated -without any math by merely observing a line graph of a product’s three-year demand history. If there is no discernible pattern, it is unlikely that the product is forecastable with mathematical methods. (Products that are using just the last few periods to create a forecast are the exception to this rule.) An algorithm that can appear to be predictive can be built for unforecastable products. But more often than not, this is an illusion created by the forecaster who over-fitted the forecast.
Products with Stable Demand History
Products that have a very stable history exist at the other end of the continuum of forecast difficulty. Typically, it is effortless to forecast for products with a stable demand history. However, if this is the case, actively forecasting the product does not add very much value to supply planning (the ultimate consumer of the demand plan) because a product with stable demand history does not need to be forecasted. Products with stable demand can be managed.
Intermittent – or “lumpy” – demand is one of the most common features of a product’s demand history that makes a product unforecastable. Services parts are the best-known example of a product with lumpy demand. However, I have come across intermittent demand in many different types of companies. For instance, one of my clients was a textbook publisher. A large percentage of their product database had an intermittent demand history, which would typically not be expected of this type of product. However, because different US states buy textbooks in large volumes whenever funding comes through, the demand ends up being quite unpredictable for many books. A school system will not make any purchase for some time and then will buy many textbooks all at once. For example, California is on a seven-year procurement cycle, which means that they wait seven years between purchases.
Examples of Unforecastable Demand
The central premise of this chapter is that many products are inherently unforecastable. As was stated earlier, a lack of forecastability can be determined mathematically, and it can also be determined visually. I find that displaying the graphics of unforecastable products is a very educational exercise, and I have used this technique with clients to get the point across. A visual representation of unforecastability is better, in my view than representing the same thing with a series of numbers in columns. The following graphics are examples of unforecastable demand history. An analysis of each is provided below the screenshot.
This product is statistically unforecastable, as there is no discernible pattern. This product has one demand peak in month seven (July), and several other smaller demand points, but simply not enough to forecast another demand point. This is a relatively apparent unforecastable demand pattern. The next example is a bit more complicated.
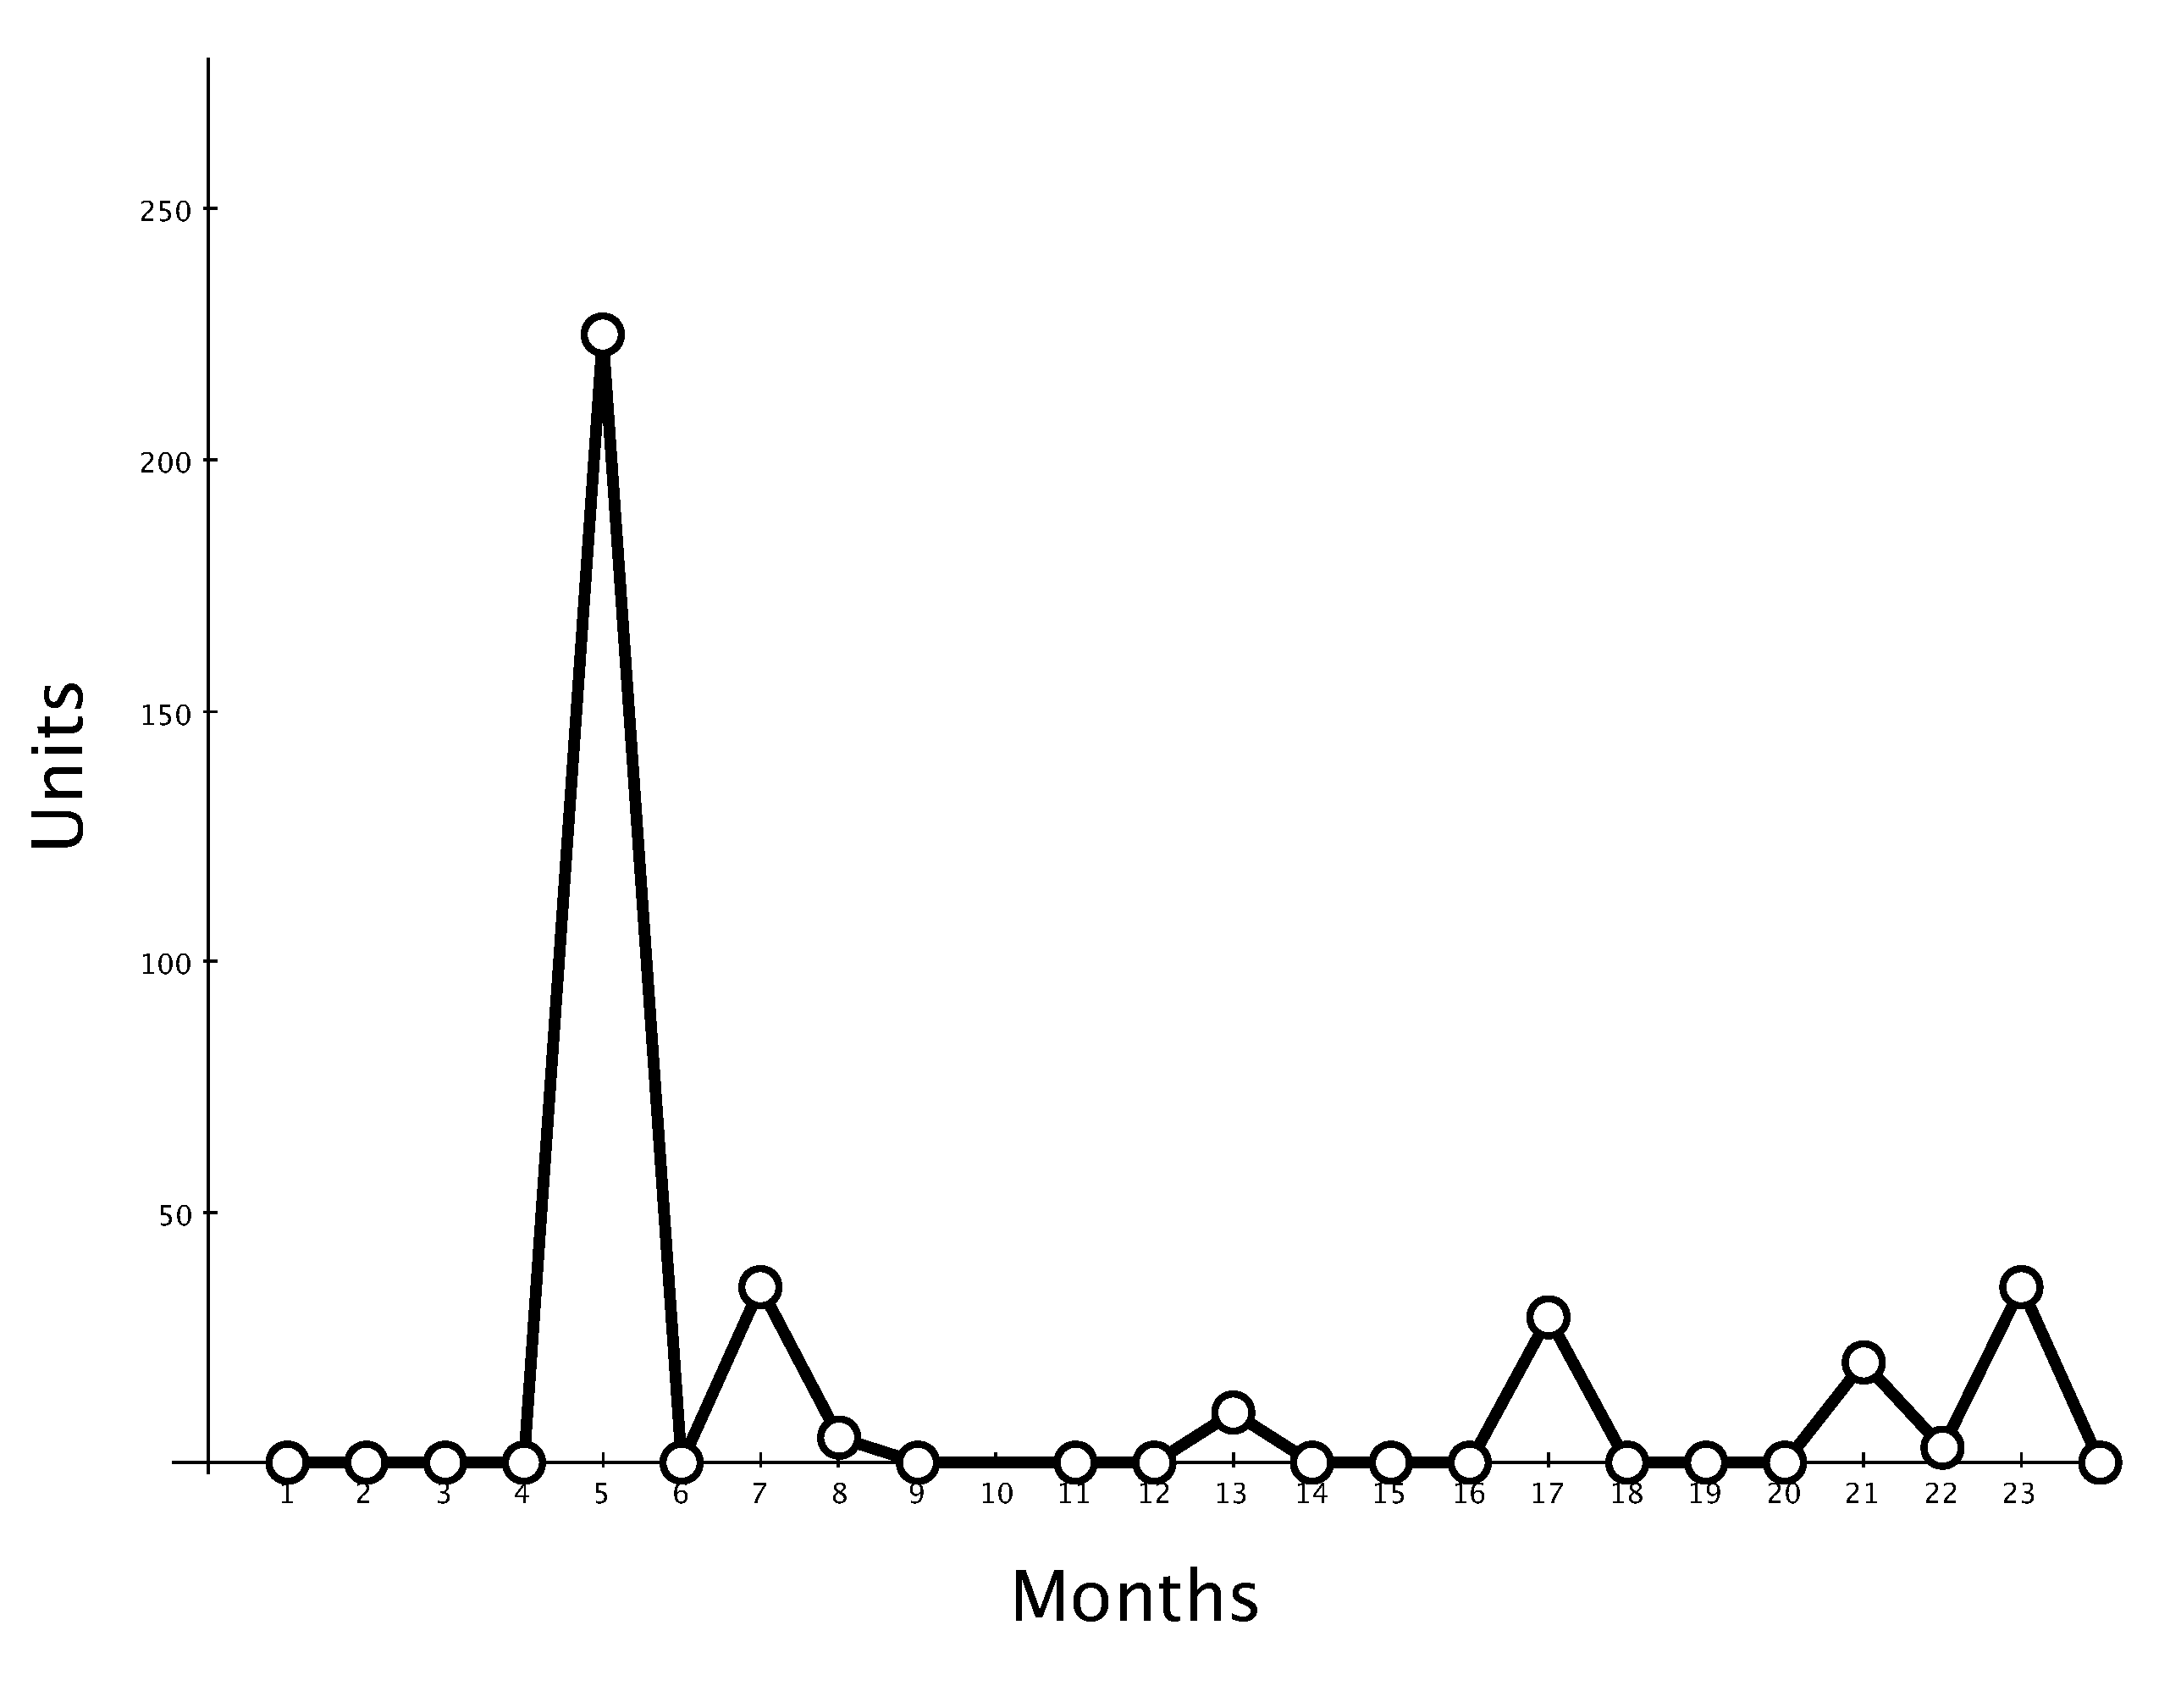
This product is statistically unforecastable, as there is no discernible pattern. This product has one demand peak in month seven (July), and several other smaller demand points, but simply not enough to forecast another demand point. This is a relatively apparent unforecastable demand pattern. The next example is a bit more complicated.
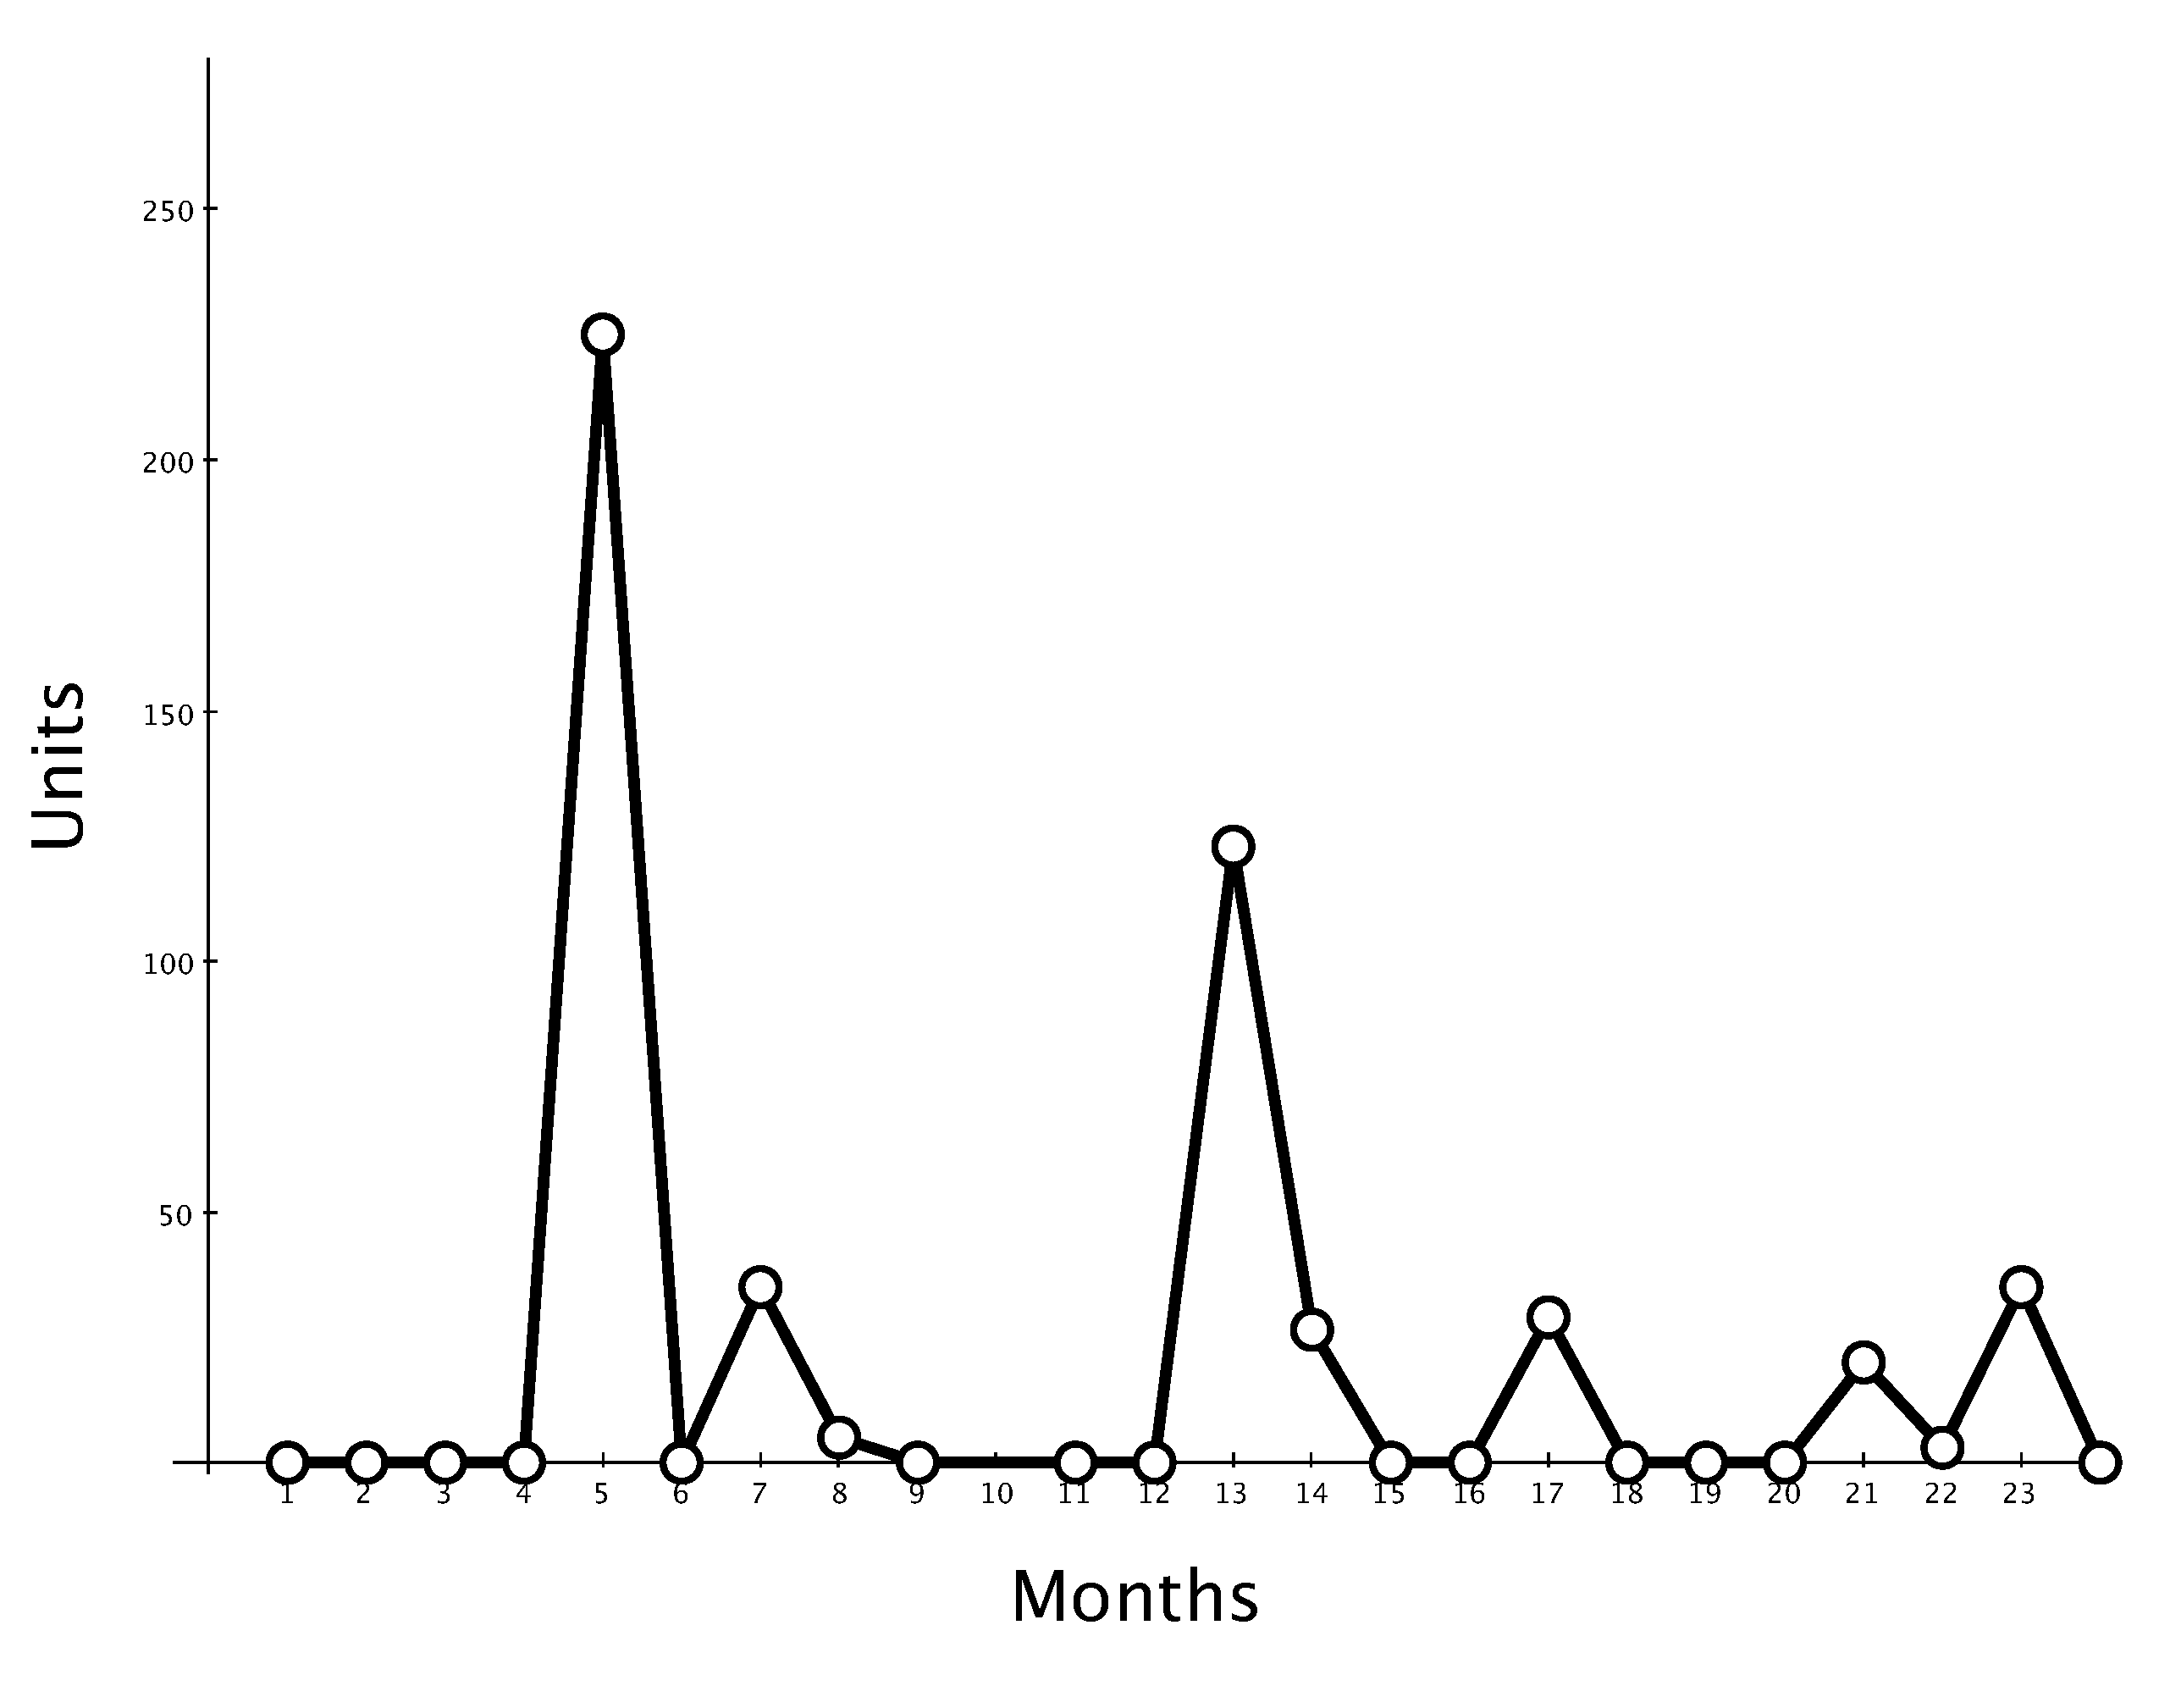
In this case, there are two demand peaks, and it might appear to be a good bet that the demand peak will repeat a third time…except it is not a good bet, because the first peak is in month five (May) of the first year, and the second peak is in month one (January) in the second year. Where this product is going next is anyone’s guess. This product is also unforecastable.
Managing Products with No Forecast with Supply Planning
One might think that it’s not possible to stop forecasting products. It is quite possible and easy to implement. However, there can be a fair amount of complexity in the methods designed to calculate reorder points (something that is not commonly understood by those that oppose reorder point planning because it is too simple). In the book, Supply Planning with MRP/DRP and APS Software, I cover reorder point planning differently than it is included in some supply planning books. So I won’t repeat the information here. Suffice it to say that there are many cases where it is better not to send a forecast to the supply planning system, and the supply planning system will still manage quite well. Therefore, a simple moving average forecast can be sent for unforecastable products or no forecast at all.
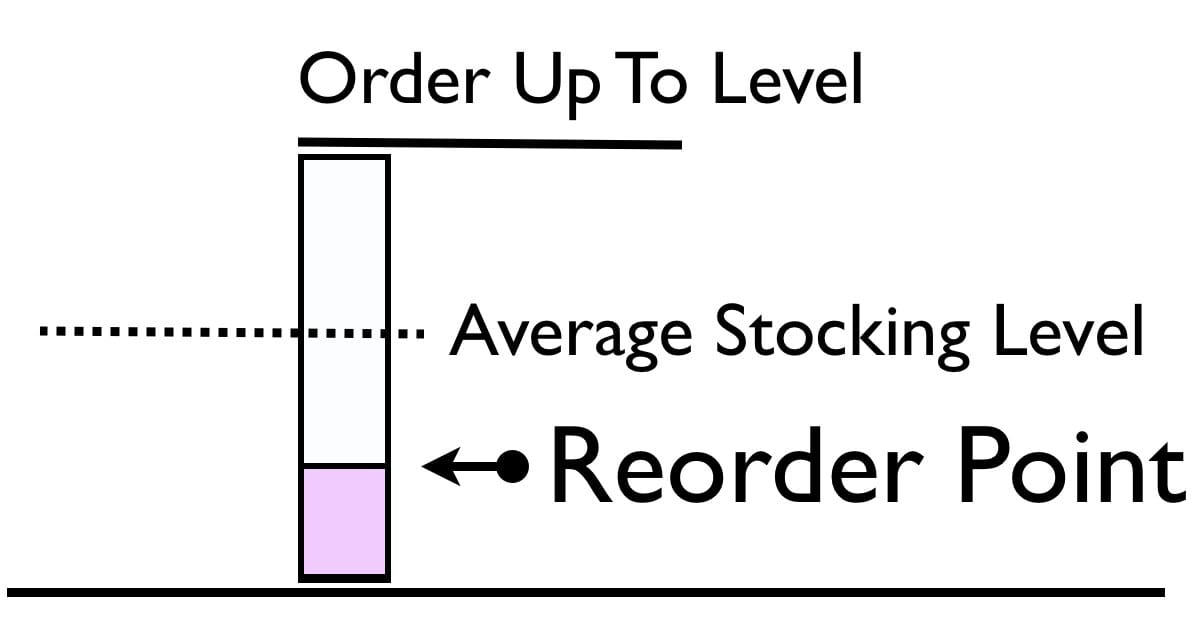
A graphical presentation of how reorder points are set.
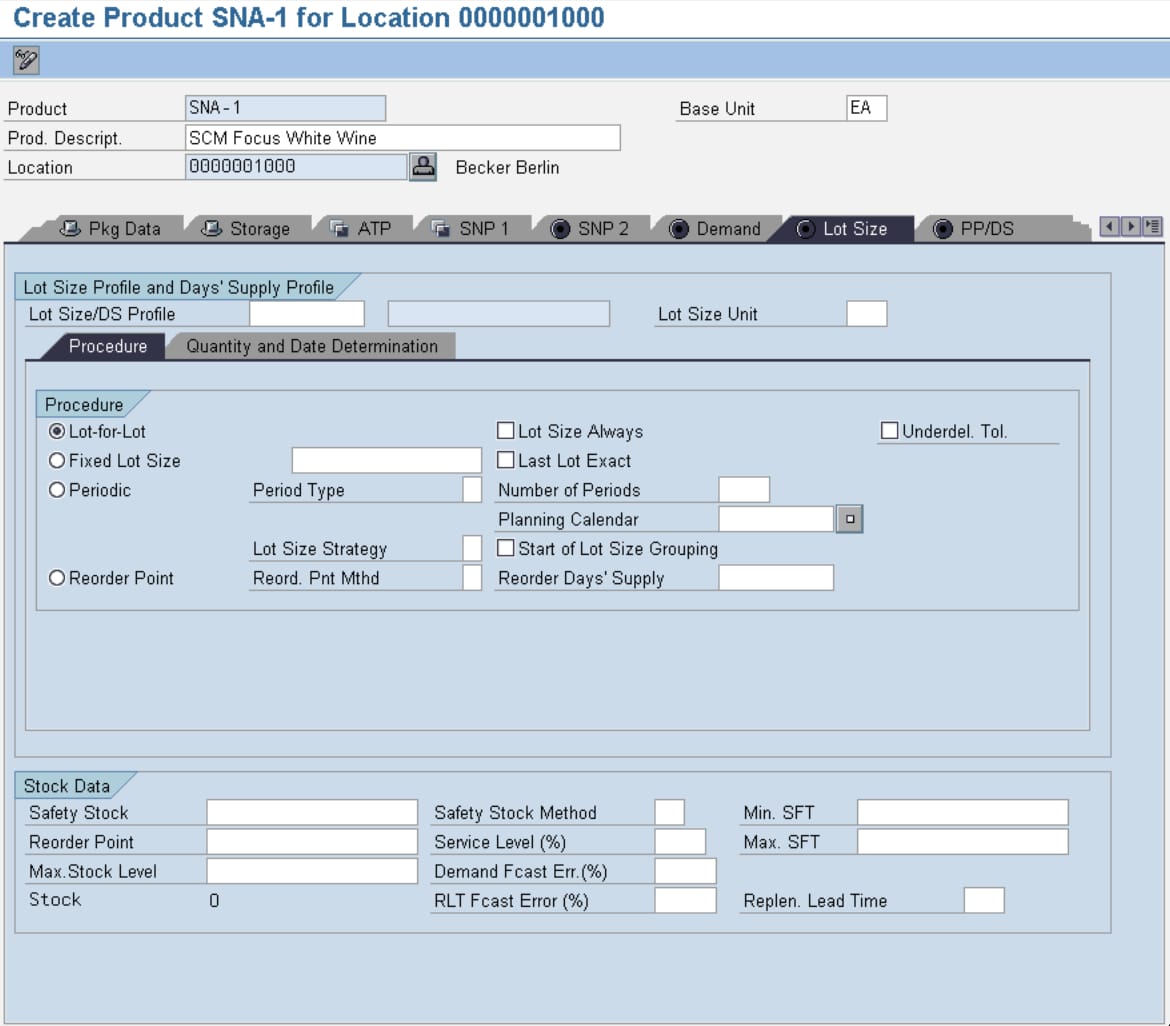
Where reorder points are set in SAP APO, see the bottom of the screen. Further, we will describe the importance of setting reorder points external to ERP or the planning system.
Reorder Point Planning for Deployment/Outbound Supply Planning
Until this point, we have discussed reorder point planning for the initial supply plan, which generates the purchase requisitions and the planned production orders. However, replenishment/reorder parameters are available at all the locations in a supply network. Therefore, there is nothing to say that reorder point planning cannot be used throughout the entire supply network, both inbound to the plant or regional distribution center and outbound for deployment. In this way, reorder point planning can be used for deployment, which would mean removing them from the product location combinations from the planning procedure that is used. With most supply planning applications that I have used, this is simple to do.
The business should be given the task of re-determining the reorder point parameters for the product locations to be transitioned off the active planning track. If they are new to doing this, they may need some outside help from someone with a strong mathematical understanding of creating intelligent reorder points.
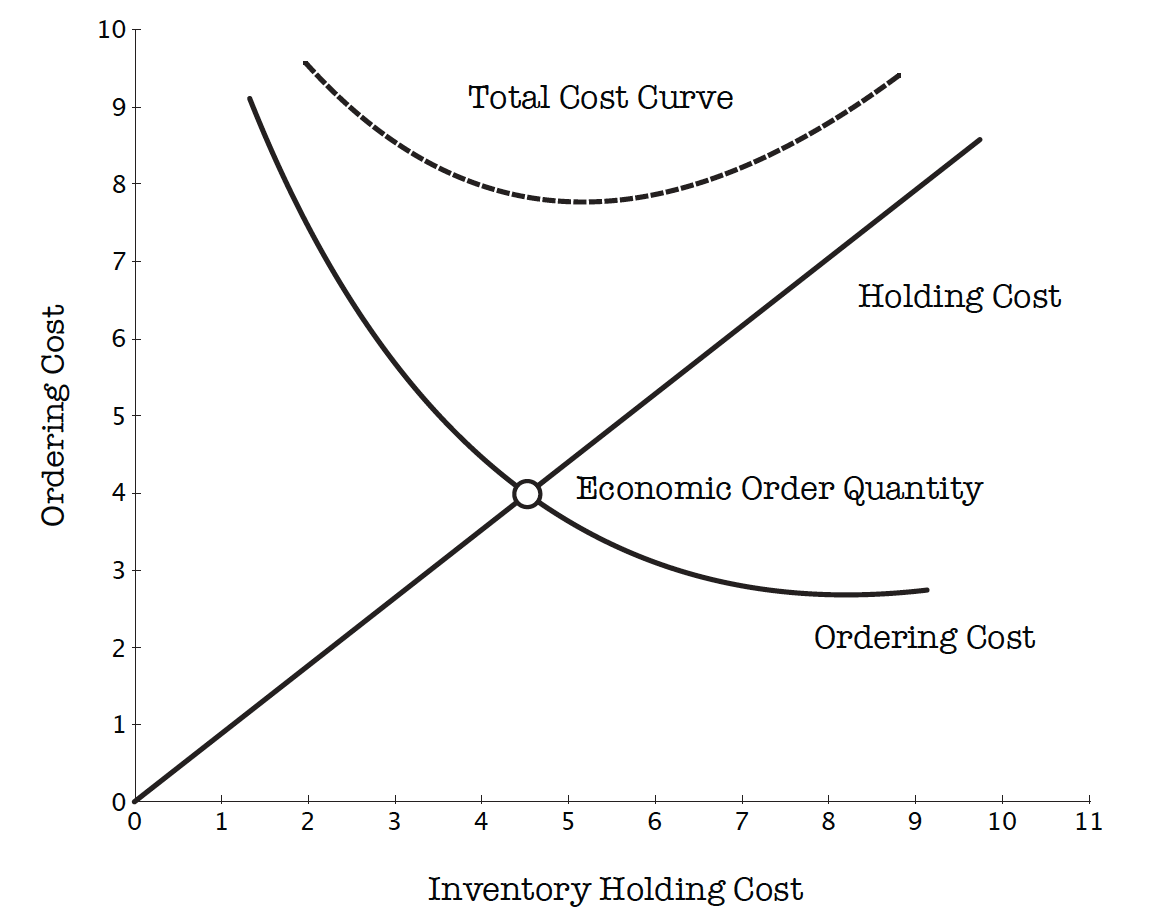
How Should EOQ and Other Supply Planning Parameters be Calculated?
One would be able to, for example:
Item #1: Simulation
Set the supply planning parameters in a way that one can simulate the impact on the overall supply plan. When using supply planning systems, inventory parameters are typically managed on a "one by one" basis. This leads to individual planners entering values without considering how inventory parameters are set across the supply network.
Item #2: Interactivity of Changes
This is the ability to see the relationship between changes to service levels and the simulated output.
Item #3: Seeing Financial Implications
This is the ability to see the impact on the dollarized inventory for different aggregate settings.
Item #4: Mass Change for Efficient Maintenance
This allow the parameters to be changed en mass or as a mass change function. Both supply planning systems are designed to receive parameters; they are not designed to develop the parameters.
 Getting to a Better Parameter Setting Capability
We developed an approach where EOQ and reorder points are calculated externally, which allows for a higher degree of control. And for the average inventory to be coestimated in a way that provides an observable total system inventory, holding cost, service level, and a picture of what is happening to the overall system. Calculating individual parameters like EOQ without an appreciation for the systemwide does not make any sense. Also, in many, perhaps even most cases, there is no reason to use EOQ for the purposes given above. Instead, an alternative custom order batching method can be created to replace EOQ. There is nothing magical about EOQ. It is not a "best practice." It will not provide you with "digital transformation." It is not "Six Sigma." You will not get a "black belt" for using it.
After observing ineffective and non-comparative supply planning parameter setting at so many companies, we developed, in part, a purpose-built supply planning parameter calculation application called the Brightwork Explorer to meet these requirements.
Few companies will ever use our Brightwork Explorer or have us use it for them. However, the lessons from the approach followed in requirements development for supply planning parameter maintenance are important for anyone who wants to improve order batching and supply parameters.
Conclusion
Reorder point planning is an early approach to supply chain planning; however, while often dismissed as passé, it has applicability in some circumstances. Reorder point planning can be used effectively for products that are both easy and difficult to forecast. What works well for products with erratic demand history works equally well for products with extremely stable demand history.
n this article, we, in part, answered the question of when is reorder point used. For MRP to work well, the forecast for any particular item must be of a reasonable level. However, many products do not meet this qualification. Sometimes this is due to the skill level, training, system, etc. on the part of the company. Yet, other times it is due to the nature of the demand history itself for a particular product. Forecastability can usually be determined – or at least indicated – without any math by merely observing a line graph of a product’s three-year demand history. If there is no discernible pattern, it is unlikely that the product is forecastable with mathematical methods.
Intermittent – or “lumpy” – demand is one of the most common features of a product’s demand history that makes a product unforecastable. Unfortunately, as is covered in the book Promotion Forecasting: Techniques of Forecast Adjustment in Software, several factors are combining to reduce the forecastability of product databases. This includes factors such as the increase in the number of SKUs carried – called product proliferation, reduced product lifecycles and higher turnover, and increases in promotions. The less forecastable the product database, the less than an MRP, or any other supply planning method, can do to provide a good supply plan. With Sales and Marketing running strategy at most companies, companies are making it increasingly difficult for themselves to have a manageable supply chain. It also means that some maintenance areas must be performed with increased frequency on the MRP system. This is a good segue into our next topic, which is how to improve MRP systems.
It is a relatively simple matter in a supply planning system to convert some product location combinations to pure reorder point planning and other product location combinations to being processed with a supply planning method. Furthermore, a product may be planned in one way at one location and planned a second way at a different location.