
Testing Results Using Complex Methods for Lumpy Forecasting
Executive Summary
- Intermittent or lumpy demand is often thought to be better forecasted with sophisticated methods. As per J. Scott Armstrong’s research and our research, more complex methods do not work with intermittent or lumpy demand.
- In this article, we cover using Crostons, smoothing, and the moving average for intermittent demand.

Introduction: The History of Crostons
Crostons has benefitted from being little questioned as to how much better it works than using simpler approaches. You will learn how crostons’ works and how it compares and when and why it is used.
Our References for This Article
If you want to see our references for this article and related Brightwork articles, visit this link.
What is Crostons?
Croston is a method that has been specialized for dealing with intermittent demand. The literature is inconclusive about whether Croston is much more beneficial over exponential smoothing with a tiny alpha and a high beta value (more emphasis placed on earlier periods).
Croston is also presented as more useful than using moving average forecasting. In this article, we will use moving average forecasting without zeros for intermittent demand.
Intermittent or Lumpy Demand
Intermittent—or “lumpy”—demand is one of the most common features of a product’s demand history that makes a product unforecastable. Services parts are the best-known example of a product with lumpy demand. However, I have come across intermittent demand in many different types of companies. For instance, one of my clients was a textbook publisher. A large percentage of their product database had an intermittent demand history, which would normally not be expected of this product type. However, because different US states buy textbooks in large volumes whenever funding comes through, the demand ends up being quite unpredictable for many books. A school system will not make any purchases for some time and then buy many textbooks all at once. For example, California is on a seven-year procurement cycle, which means they wait seven years between purchases.
Dealing with Lumpy Demand with Complex Methods
Lumpy or intermittent demand is the bane of effective forecasting. One of the major approaches to dealing with difficult-to-forecast products has been to apply increasingly sophisticated forecasting methods, the results of which have generally not been positive. However, this has not changed the belief that using more complex forecasting methods is an effective strategy. Executives often see complex forecasting methods as a magic bullet. It seems that the more indecipherable the forecasting method, the higher its status, as exemplified by one of the major intermittent forecasting methods called Croston’s. Croston’s has been a source of hope for executive decision-makers to improve the forecasting of lumpy demand items since it was first incorporated in enterprise demand planning software. It’s difficult to see where all of this confidence and enthusiasm is coming from, as various research papers on Croston’s are inconclusive regarding its benefits.
The Complexity of Crostons
Croston’s is one of the most complex forecasting algorithms used in demand planning, and few people understand the exact mathematics for what it does. This is, in my view, why it continues to be popular regardless of its value in improving forecast accuracy. It’s not difficult to predict that Croston’s will continue to be popular because of the general and entirely unfounded belief that difficult to forecast products benefit from more sophisticated mathematical forecasting models. Commercial incentives and pressures are at play in what vendors offer in their applications and what is written about forecasting. New forecast methodologies are not necessarily developed because they are superior to simpler and easier-to-implement techniques. They help get research papers published and help sell software and obtain consulting contracts. Some complex forecasting methods are incorporated into applications simply because clients demand them.
Why Croston’s Is Added to Software
One software vendor I am familiar with added Croston’s to their product, not because they thought it would be beneficial to customers, but because executives kept asking for it. Adding Croson’s made their applications seem more “leading edge.” The lack of benefit from more complex methods is described in J. Scott Armstrong’s research paper “Conclusions of 25 Years of Research”, quotes from which I have listed below:
“More important, Table 1 provides little evidence to suggest that sophistication beyond the methods available in the 1960s has had any payoff. Relatively simple methods seem to offer comparable accuracy; twentyone studies concluded that there were negligible differences, and for the eighteen studies showing differences, eleven favored sophistication, and seven favored simplicity. However, of the eleven cases favoring sophistication, three have since been challenged, and three cases were based on the superiority of exponential smoothing (available prior to 1960). We are left with five comparisons favoring sophistication and seven favoring simplicity. In general, the findings on sophisticated methods are puzzling, and it is unlikely that they could have been anticipated in 1960. Many of the sophisticated methods made good sense. For example, it seemed reasonable to expect that models in which the parameters are automatically revised as new information comes in should be more accurate.”
The Illusion of Forecast Improvement
However, more complex methods can produce the illusion of producing a more accurate forecast because they often fit better with demand history. This is called “over-fitting” and was pointed out by Michael Gilliland earlier in this chapter.
“Highly complex models may reduce accuracy. While these complex models provide better fits to historical data, this superiority does not hold for forecasting. The danger is especially serious when limited historical data are available.”
Results of J. Scott Armstrong’s Research
J. Scott Armstrong’s research is a meta-analysis—it combines the results of multiple studies that address a specific hypothesis. The breakdown is as follows:
- Eleven studies showed that complex methods outperformed simple methods
- Twenty-one studies showed no improvement by using more complex methods
- Seven studies showed that simple methods outperformed complex methods
Even though complex methods did not improve forecast accuracy on average, the performance of a more complex method in a tightly controlled research study gives an unfair and unmentioned advantage to that complex method. The more complex methods perform better in a controlled research study than in a real-life environment where they require more forecasting effort and maintenance.
Now that we have discussed the myth of increased model sophistication for difficult to- forecast products, we will move into the topic of how to identify unforecastable products.
The Standard Approach to Intermittent Demand
Regardless of the state of the academic literature, both companies have decided to improve the forecast accuracy of intermittent demand items and (most) software vendors. They have concluded that Croston shows benefits significantly higher than alternative solutions like exponential smoothing and moving average.
This post will investigate whether this assumption bears out with the facts, particularly with the events of real-life implementations. It will also bring up the question, often not discussed, about how much better Croston’s performs that exponential smoothing or moving average forecasting.
How Does Croston Work?
Croston has a complicated formula. However, its output is straightforward.
The spreadsheet screenshot below emulates what Croston does. Croston is very rarely directly compared to a moving average in the format shown below. In most circumstances, it is represented by a formula. The approach below does not get into the math of Croston but makes its output transparent and comparable.
The math behind this is complicated, but the output is remarkably similar to exponential smoothing, which includes more periods and does not weigh the most recent periods very highly. So is this all there is to Croston? No. There is a timing element that also must be covered to appreciate what the formula is doing thoroughly.
Timing of Occurrence
One of the commonly listed benefits by those technically knowledgeable in how Croston works are its timing benefits.
Below are two Croston forecasts based upon slightly demanding histories.

Below the Croston method, we have moving average forecasting that does not use any zeros. With more non-zero data points, Croston begins to show benefits.
Here is why:
- Firstly it tries to “detect” the cyclic/periodicity of demand pattern. In this case, it suggested an order could occur possibly after 3.5 (4 after roundup) zero period.
- Secondly, if the recent periods are zero periods, it further adjusts the next occurrence from the last non-zero period.
So the objects of the forecast are predicting the consumption at the right moment with the right quantity. Croston does try to predict the “right moment,” which is more sophisticated than the moving average. But, how relevant is this in “real life?” The following factors should be considered to answer this question, but most often are not when Croston is proposed on forecast improvement projects.

#1.) The Demand Over Risk Period and the Lead Time Duration
The benefit of Croston is very much dependent upon the lead-time of the product being forecasted. Eventually, it is an average demand across the periods. If the lead-time is short, then timing can be seen to have some benefits. The actual translation of this benefit is open to debate.
#2.) The Variance of the Risk Period
One common experience about Croston is that many people have, over time, become frustrated with forecast inaccuracy. This is actually due to the fact the forecast measurement is not only measuring the amount but also the timing.
For example:
Forecast: 0, 0, 5, 0, 0, 5
Actual: 0, 0, 5, 0, 0, 5
The forecast error in this example would be zero 0. But if the actual lags by one month and is…
0, 5, 0, 0, 5, 0
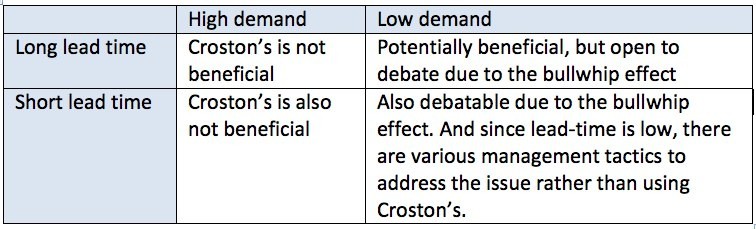
…then, the forecast error would be quite large. (This further exaggerates the problem of the bullwhip effect.) The Higher variance, of course, drives up the required safety stock. In this situation, using a straight average is the safer bet. The following matrix can help break down when Croston might be useful.
 #3.) The Implications of Supply Planning and Intermittent Demand
What much research misses out on Croston is the impact on supply planning, or more precisely, how supply planning already adjusts to intermittent demand. This is not a criticism restricted to how Croston is analyzed. Many demand planning methods are measured without consideration given to supply planning. Demand planning methods do not exist in a vacuum, and eventually, the demand plan will be released to supply planning.
The following are factors that must be considered in supply planning for a complete analysis of Croston.
- The safety stock (contributing to the final inventory position) calculation in supply planning is based on the demand over the risk period and the variance associated with the demand within the risk period.
- The effect on (S,s-1) ordering/replenishment policy. The standard ordering/replenishing policies are (r,q), (S,s), and (S,s-1). (r,q) And (r, S) can be discarded for this analysis as they are primarily used products with higher volume demand histories. Therefore, the one to focus on here is (S,s-1).
(To read about (S,s-1) see this post.)
Croston Benefits to (S, s-1)
(S,s-1) Environments can see benefits from the use of Croston. Let us move to the next example to see how.
In the earlier example, the forecast is 0, 0, 5.5, 0, 0, while the average is 1.33 over the five periods. Under an (S,s-1) inventory policy, the supply planning system will suggest an order of 1.33 units per month… There would be 2.66 units sitting in inventory before the demand for 5.5 occurring. The lower the average monthly forecast, the larger the problem. There are two factors to consider when analyzing the benefits of Croston on supply planning.
- Supply planning is always integer planning; it can’t order a percentage of an item; it must order 0 or 1 as part of a setup function. (This is a common problem in service parts planning which, due to low demand, optimal ordering quantities are often are percentages of a unit, which must then be rounded up or rounded down.)
- In many cases, items cannot be orders in single quantities but must be purchased in multiple units due to either economic order quantity considerations or pack sizes (the minimum packaged quantity sold by the supplier)
For more detail on the (S,s-1) inventory policy, see the post.
The Outcome of Croston when Supply Planning is Considered
Much of the benefit of Croston is eliminated when supply planning is taken into account. Croston may be able to create a slightly better “timed” forecast than a long-duration moving average. But if orders are naturally rounded by supply planning, the benefit is lost. Companies that should be focusing on Croston are those that use (S,s-1) (with low demand). This is because it is the only area Croston can provide value over and above a long duration moving average or another smoothing method.
As explained at the beginning of this article, this is not the general interpretation of Croston. Instead, Croston is viewed as not only marginally beneficial. It is considered highly advantageous to all products with low and or intermittent demand. This is primarily because many proponents of Croston are not considering supply planning. That is how the relatively minor benefits are already accounted for in supply planning.
This is not the only factor contributing to the continued promotion of Croston. Elements of wishful thinking element in the hopes that are pinned upon Croston. Frustrated by an inability to reduce the forecast error of difficult to forecast items, Croston is seen by decision-makers in companies as a magic bullet because “it’s so good at intermittent demand.”
Being Cognizant of the Effort Put Into Forecasting
Sophisticated forecasting approaches are often recommended without considering how much effort they are to implement and maintain versus their payoff. Michael Gilliland is one specialist in this area who makes this a focal point and writes very convincingly on the topic:
“Sometimes the best way to deal with forecasting problems is to just get rid of them. When a product has very low sales it may be hard to sense any patterns in the data. There may be long periods of no sales at all, with occasional spikes in sales. There are a number of techniques to deal with such intermittent demand, with Croston’s method and its variations being perhaps the best known. But there is no easy or sure answer, and trying to forecast these low volume items ignores a very important question: Is it worth our efforts to even bother?”
Conclusion
The output of Croston is not nearly as unique as thought and as generally presented. Croston is a complicated formula. Difficult enough, such that it is not understandable to most people without a mathematics background. The black box aspect of Croston tends to convince people who it must lead to significantly improved forecasts.
Croston can be easily emulated with exponential smoothing or move average forecasting. While for intermittent demand, Croston will provide higher accuracy than exponential smoothing or moving average forecasting, the relevance of forecast accuracy must be taken in concert with supply planning.
Any timing benefit is usually adjusted by order lot sizing and or safety stock in supply planning. Demand history must not only be lumpy but must also be very low for Croston to be of value. That is, the accuracy benefit is, in most cases, minimal compared to exponential smoothing or moving average forecasting. On the other hand, if there are no lot sizes at play, which may be the case for expensive items, then Croston may provide benefit over exponential smoothing and move average forecasting.
Even in these environments, both authors are skeptical as to its real-life benefits. Croston can be seen as a specialty forecasting method that provides value in certain limited circumstances.
References
Co-author thanks to Wayne Fu, who helped with all the math for Crostons.