
Executive Summary
- This is the Brightwork Research & Analysis software rating series.
- We rate both the software and estimate the risk of implementing each application.
MUFI Rating & Risk for Forecast Pro TRAK
MUFI: Maintainability, Usability, Functionality, Implement ability
Vendor: Business Forecast Systems (Select For Vendor Profile)
Introduction
Forecast Pro TRAK is the top of the line application offered by Business Forecast Systems. BFS offers several lower versions of this product that have various features disabled, but Forecast Pro TRAK is the appropriate application for serious forecasting.
Application Detail
Forecast Pro TRAK is one of the value leaders in the forecasting space. Forecast Pro TRAK has a similar feel to Demand Works Smoothie (although many of the comparisons stop at the user interface). Forecast Pro TRAK has a strong focus on attribute-based forecasting. Attributes all for the creation of flexible forecast hierarchies and the capability that any forecasting system has concerning managing attributes is one of the essential ways of grading any forecasting system. Forecast Pro TRAK’s characteristics are easy to use but are not the best in the category.
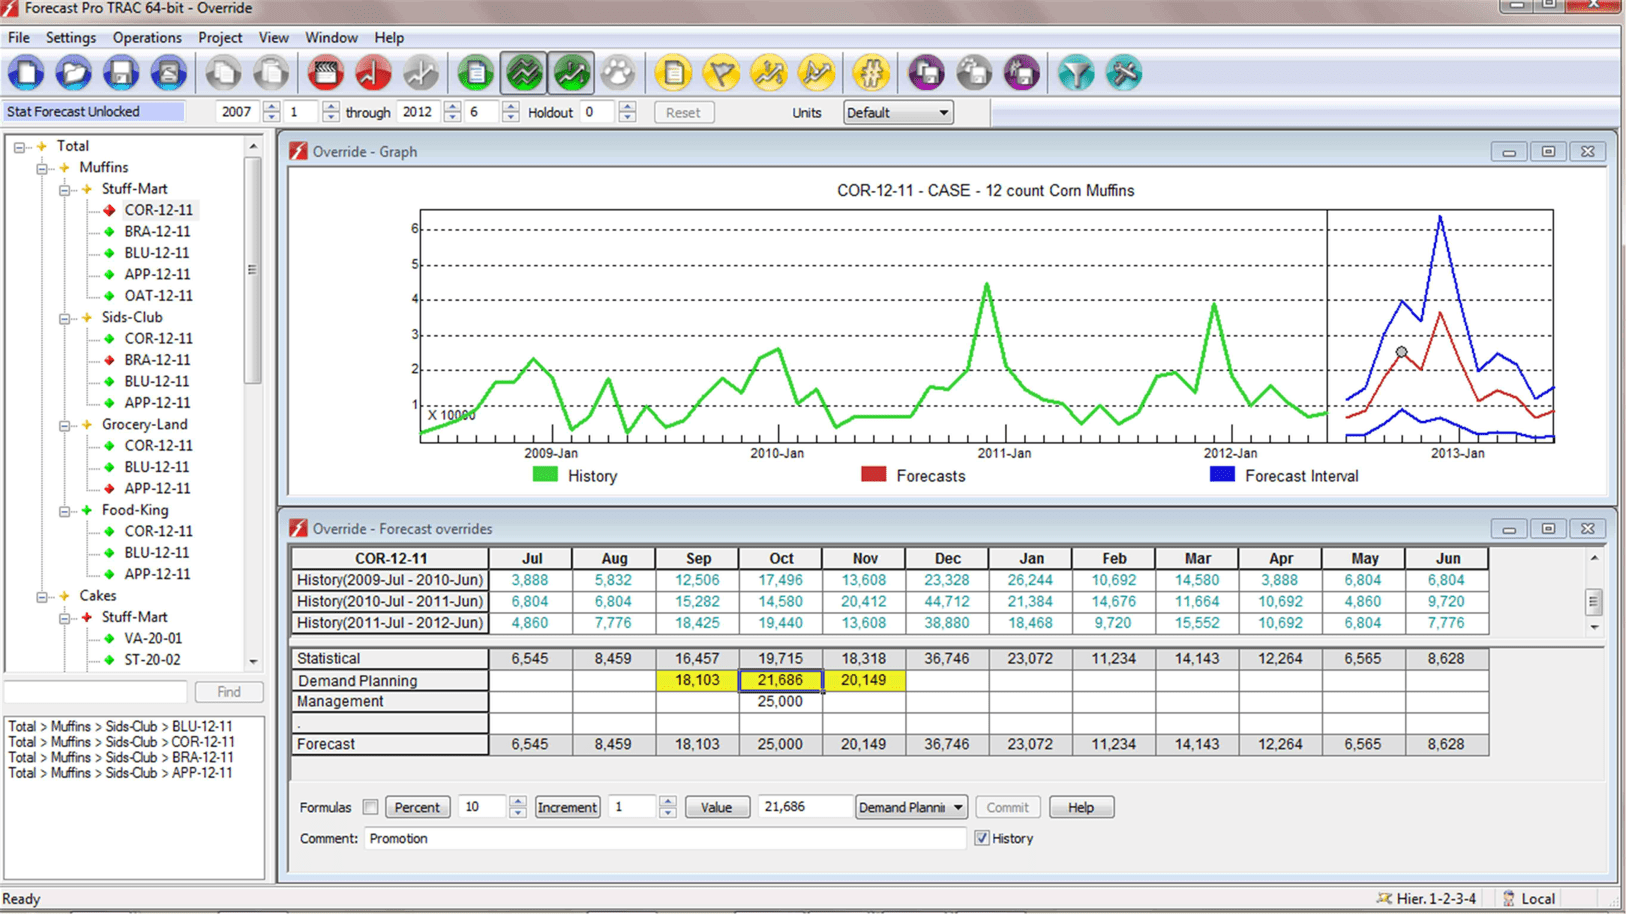
Notice the attribute hierarchy in the left pane. The hierarchy is not fixed but can be “shuffled” by moving any attribute over any other attribute. This is very valuable for both performing actions such as top-down forecasting as well as for navigation. New attributes can be added that are used for either purpose can be easily added.
In the lower-left pane favourites – which are specific locations within the virtual hierarchy can be saved – and reopened at any time. This area only has a few favourites saved, so searching is not applicable. However, if one had many favourites, they could be easily searched and found. This is a constant request that we have for almost any application – an easy search/filter box that can allow the user to zero in precisely on what they are looking. It is a significant factor in improving the productivity of the application.
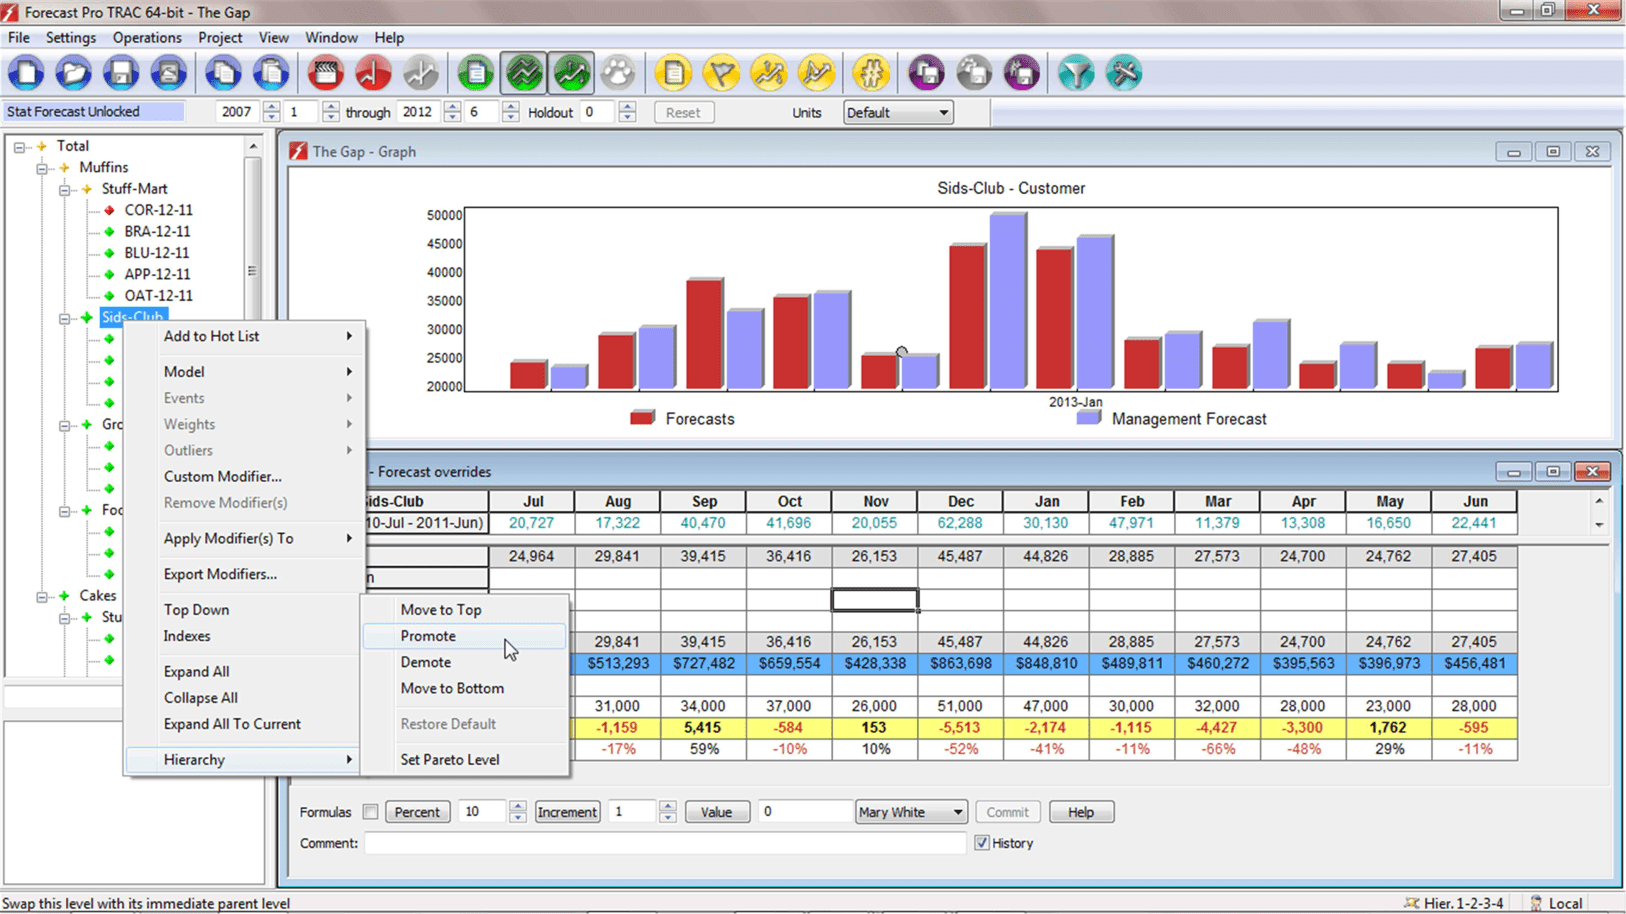
Moving one attribute above another can be performed by right mouse clicking on the attribute and selecting Promote or Demote. This moves the attribute above or below where it is currently in the virtual hierarchy.
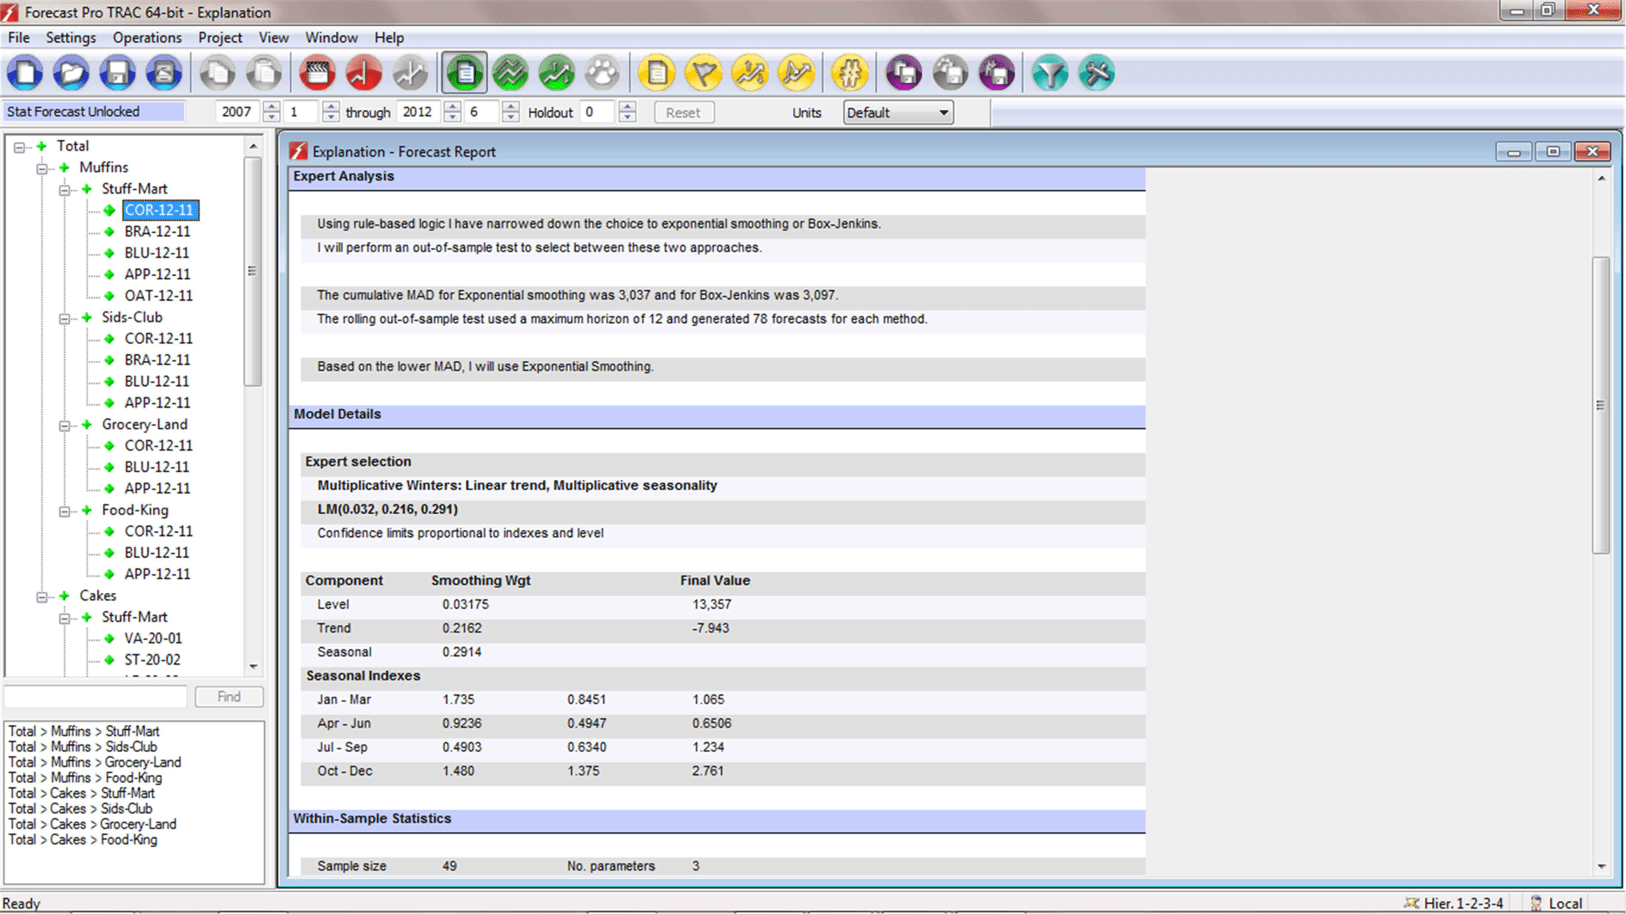
One of the differentiators for Forecast Pro TRAK is the easy accessibility of forecast statistics and other details that are available in the application, one example being within the Forecast Report that is shown here.
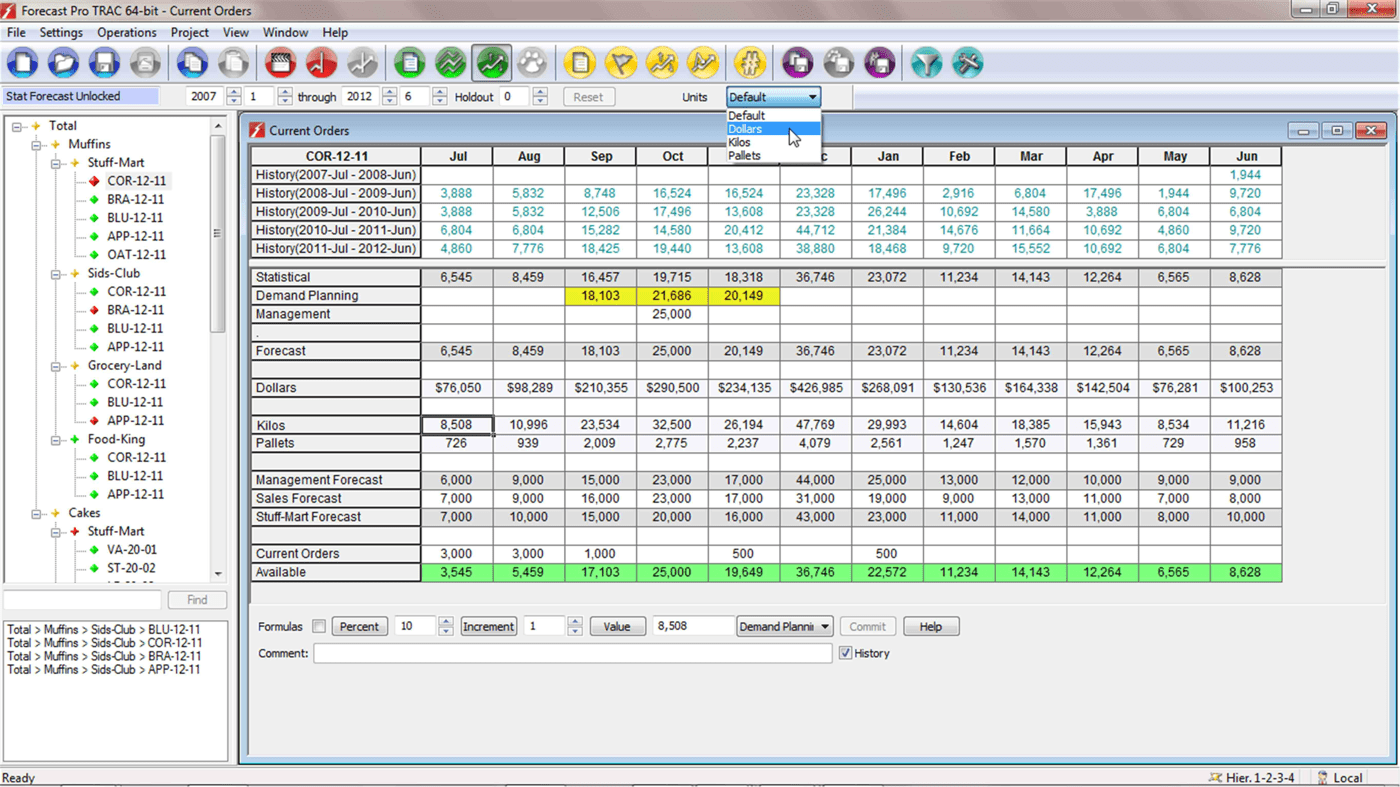
Forecast Pro TRAK has mastered essential details, such as being able to change the unit of measure easily. One can quickly move between the item to dollars, dollars being significant for S&OP forecasting. This, of course, only provides one side of the S&OP equation, the capacity side must be brought in as well – however, Forecast Pro TRAK delivers this critical functionality without any extra cost.

Forecast Pro TRAK has a nice comment field, which can be seen at the bottom of this screenshot. This is a new trend in many enterprise software applications. Salesforce’s platform has a functionality called chatter, which is a more sophisticated version of this comment field and allows for multiple comments and comment tracking as in a blog comment area. This type of functionality can partially replace email and reduce the need for emails. It is a significant productivity issue to have this commenting in any shared application.
Forecast Pro TRAK is a relatively straightforward application to implement, is very attractively priced, has modern functionality as well as some interesting productivity features that become more apparent with extended use. All of these product-specific features combine with positive vendor features like very experienced and st consulting as well as strong documentation from Business Forecast Systems. However, the application lags in several areas, including security and scalability. Furthermore, prospective customers should understand that Forecast Pro TRAK is a desktop application and BFS does not offer multi-user server version of the application, and therefore scalability will become an issue.
Forecast Pro TRAK has all the forecasting methods that one would expect including best-fit functionality. Forecast Pro TRAK offers collaboration functionality as well at around $1400 per collaborator for more than 11 licenses. This broadens out the use of Forecast Pro TRAK within a buyer and for instance would allow sales to enter their forecasts directly into the Forecast Pro TRAK application, without requiring that they have the full application license. This is a significant productivity enhancer for buyers, allowing collaborators to get out of using spreadsheets and make their adjustments directly in the application. These collaboration licenses can be used to obtain input from supply chain partners as well.
MUFI Scores
All scores out of a possible 10.
MUFI Scores
- Ma. = Maintainability
- Us. = Usability
- Fu. = Functionality
- Im. = Implementability
| App | Ma. | Us. | Ft. | Im. | Cat. |
|---|---|---|---|---|---|
| Average Score for Big ERP | 5.1 | 4.8 | 5.2 | 5.4 | Big ERP |
| Average Score for CRM | 6.2 | 6.2 | 5.1 | 5.9 | CRM |
| Average Score for Small and Medium ERP | 8.3 | 8 | 6.7 | 8.5 | Small and Medium ERP |
| Average Score for Finance | 8.8 | 8.8 | 8 | 8.8 | Finance |
| Average Score for Demand Planning | 7.6 | 7.2 | 7 | 7.1 | Demand Planning |
| Average Score for Supply Planning | 6.7 | 6.9 | 7 | 6.8 | Supply Planning |
| Average Score for Production Planning | 6.8 | 6.9 | 7 | 6.9 | Production Planning |
| Average Score for BI Heavy | 5.5 | 5.3 | 6.9 | 5.3 | BI Heavy |
| Average Score for PLM | 7 | 7.2 | 6.8 | 7.3 | PLM |
| Average Score for BI Light | 7.7 | 8.7 | 9 | 8.3 | BI Light |
| Arena Solutions Arena PLM | 10 | 10 | 10 | 10 | PLM |
| AspenTech AspenOne | 4 | 8 | 10 | 7 | Production Planning |
| Birst | 8 | 8.5 | 10 | 8 | BI Light |
| ERPNext | 10 | 10 | 7.5 | 10 | Small and Medium ERP |
| Delfoi Planner | 8 | 6 | 6.5 | 7 | Production Planning |
| Demand Works Smoothie SP | 9 | 10 | 7 | 10 | Supply Planning |
| Hamilton Grant RM | 10 | 9 | 8.5 | 9 | PLM |
| IBM Cognos | 2.7 | 3 | 1.5 | 3 | BI Heavy |
| Infor Epiphany | 7 | 8 | 6 | 5 | CRM |
| Infor Lawson | 8 | 7 | 6 | 7 | Big ERP |
| Intuit QuickBooks Enterprise Solutions | 9 | 9 | 5 | 9 | Finance |
| JDA DM | 9 | 7.5 | 8 | 8 | Demand Planning |
| Microsoft Dynamics CRM | 2 | 3 | 2 | 2 | CRM |
| NetSuite CRM | 6 | 4 | 3 | 3 | CRM |
| Netsuite OneWorld | 7 | 7 | 8 | 8 | Big ERP |
| OpenERP | 7 | 8 | 8.5 | 8 | 7 |
| Oracle BI | 4 | 4 | 3 | 6 | BI Heavy |
| Oracle CRM On Demand | 4 | 5 | 3 | 5 | CRM |
| Oracle Demantra | 5 | 3 | 3.5 | 4.5 | Demand Planning |
| Oracle JD Edwards World | 4 | 1 | 3 | 6 | Big ERP |
| Oracle RightNow | 6 | 7 | 4 | 5 | CRM |
| PlanetTogether Galaxy APS | 10 | 10 | 10 | 10 | Production Planning |
| Preactor | 8 | 7 | 3 | 7 | Production Planning |
| QlikTech QlikView | 9 | 9 | 10 | 9 | BI Light |
| Rootstock | 9 | 8 | 9 | 9 | Small and Medium ERP |
| Sage X3 | 8 | 8 | 7 | 8 | Big ERP |
| Salesforce Enterprise | 8 | 8.5 | 9 | 7.5 | CRM |
| SAP APO DP | 3 | 4 | 3 | 2 | Demand Planning |
| SAP APO PP/DS | 2 | 2 | 4 | 3 | Production Planning |
| SAP APO SNP | 3 | 4 | 8 | 4 | Supply Planning |
| SAP BI/BW | 1.5 | 2 | 4 | 2 | BI Heavy |
| SAP Business Objects | 3 | 2.5 | 7 | 3 | BI Heavy |
| SAP CRM | 4 | 3 | 6 | 4 | CRM |
| SAP ECC | 3 | 3 | 6.5 | 3 | Big ERP |
| SAP PLM | 1 | 2.5 | 2 | 3 | PLM |
| SAP SmartOps | 4 | 4 | 7 | 5.5 | Supply Planning |
| SAS BI | 6.5 | 7 | 9 | 6 | BI Heavy |
| SAS Demand Driven Forecasting | 7 | 8 | 9 | 7 | Demand Planning |
| Tableau (BI) | 9 | 10 | 10 | 10 | BI Light |
| Tableau (Forecasting) | 10 | 8 | 5 | 9 | Demand Planning |
| Teradata | 8 | 6.3 | 9.7 | 6 | BI Heavy |
| ToolsGroup SO99 (Forecasting) | 7 | 8 | 9 | 7 | Demand Planning |
| ToolsGroup SO99 (Supply) | 5 | 6 | 10 | 7 | Supply Planning |
Vendor and Application Risk
Forecast Pro has a similar risk profile as well as a similar implementation approach and consulting approach to Demand Works. Many of the same comments apply, except that Forecast Pro has been around longer than Demand Works and therefore finding independent consultants will tend to be easier.
Likelihood of Implementation Success
This accounts for both the application and the vendor-specific risk. In our formula, the total implementation risk is application + vendor + buyer risk. The buyer specific risk could increase or decrease this overall likelihood and adjust the values that you see below.
Likelihood of Application Implementation Success and Failure
Search for the application in this table using the search bar in the upper right of the table.
| Application | Prob of Implementation Success | Prob of Implementation Failure |
|---|---|---|
| Actuate | 0.77 | 0.23 |
| SAP Smartops | 0.39 | 0.61 |
| NetSuite CRM | 0.46 | 0.54 |
| Sugar CRM | 0.62 | 0.48 |
| Base CRM | 0.91 | 0.09 |
| SAP CRM | 0.35 | 0.65 |
| Salesforce Enterprise | 0.72 | 0.28 |
| QlikTech QlikView | 0.82 | 0.18 |
| Tableau (BI) | 0.98 | 0.02 |
| SAP Crystal Reports | 0.46 | 0.54 |
| Brist | 0.83 | 0.17 |
| MicroStrategy | 0.7 | 0.3 |
| SAS BI | 0.76 | 0.24 |
| Oracle BI | 0.35 | 0.65 |
| IBM Cognos | 0.23 | 0.77 |
| Infor Epiphany | 0.58 | 0.42 |
| Microsoft Dynamics CRM | 0.26 | 0.74 |
| Oracle RightNow CRM | 0.41 | 0.59 |
| Oracle CRM On Demand | 0.36 | 0.64 |
| Teradata | 0.76 | 0.24 |
| SAP Business Objects | 0.32 | 0.68 |
| SAP BI/BW | 0.25 | 0.75 |
| SAP PLM | 0.29 | 0.71 |
| Hamilton Grant RM | 0.89 | 0.11 |
| Arena Solutions | 0.96 | 0.04 |
| Delfoi Planner | 0.7 | 0.3 |
| Preactor | 0.64 | 0.36 |
| PlanetTogether Galaxy APS | 0.96 | 0.04 |
| AspenTech AspenOne | 0.55 | 0.45 |
| SAP APO PP/DS | 0.27 | 0.73 |
| Demand Works Smoothie SP | 0.93 | 0.07 |
| ToolsGroup SO99 (Supply) | 0.82 | 0.18 |
| Demand Works Smoothie | 0.96 | 0.04 |
| Tableau (Forecasting) | 0.9 | 0.1 |
| SAS Demand Driven Forecasting | 0.82 | 0.18 |
| ToolsGroup SO99 (Forecasting) | 0.86 | 0.14 |
| JDA DM | 0.57 | 0.43 |
| Oracle Demantra | 0.33 | 0.67 |
| SAP APO DP | 0.28 | 0.72 |
| FinancialForce | 0.92 | 0.08 |
| Intacct | 0.98 | 0.02 |
| Intuit QB Enterprise | 0.8 | 0.2 |
| ERPNext | 0.9 | 0.1 |
| OpenERP | 0.78 | 0.22 |
| Rootstock | 0.91 | 0.09 |
| ProcessPro | 0.93 | 0.07 |
| Microsoft Dynamics AX | 0.4 | 0.6 |
| SAP Business One | 0.49 | 0.51 |
| Sage X3 | 0.62 | 0.38 |
| Infor Lawson | 0.58 | 0.42 |
| Epicor ERP | 0.4 | 0.6 |
| Oracle JD Edwards World | 0.31 | 0.69 |
| Oracle JD Edwards EnterpriseOne | 0.36 | 0.64 |
| SAP ERP ECC/R/3 | 0.32 | 0.68 |
| NetSuite OneWorld | 0.65 | 0.35 |
Risk Definition
See this link for more on our categorizations of risk. We also offer a Buyer Specific Risk Estimation as a service for those that want a comprehensive analysis.
Finished With Your Analysis?
To go back to the Software Selection Package page for the Demand Planning software category. Or go to this link to see other analytical products for Business Forecast Systems.