
Executive Summary
- This is the Brightwork Research & Analysis software rating series.
- We rate both the software and estimate the risk of implementing each application.
MUFI Rating & Risk for QlikTech QlikView
MUFI: Maintainability, Usability, Functionality, Implement ability
Vendor: QlikTech (Select For Vendor Profile)
Introduction
QlikView is a very similar application to Tableau, although broader in scope, and a bit more heavy functionality. Along with Tableau, it has the highest buyer satisfaction level in the BI software category and one of the clear future leaders in the BI space.
Application Detail
QlikView like Tableau has the fastest implementation timelines in the BI arena, and in fact, these implementation timelines are so fast that it is curious why this is not more obvious and more embarrassing to many of the old-line BI companies. Media outlets are doing a bad job of getting the word out, and of course, the primary consulting companies are all aligned with the most extended implementing applications as shorter implementation times mean less revenue for them. Interestingly we reviewed the very popular and widely read Gartner Magic Quadrant for Business Intelligence and Analytics Platforms, completely missed out on the fact. However, Gartner never prints all the information available to it, only the data that helps it maximize revenue, and publishing the fact that the most significant financial contributors to them also have the most extended implementation timelines, will not maximize Gartner’s revenues.
Although QlikView is not entirely as self-service at Tableau as it requires some database skills that business users do not possess. However, QlikView’s IT load is still light at least relative to what it can do. The fact this story has not gotten out more is we have to assume that the significant consulting companies have a hand in keeping their clients from knowing about QlikView and Tableau as they would seriously cut into their BI consulting margins. We assume that IBM, Oracle, SAP have intensively analyzed QlikView for acquisition, and if any of these companies acquire QlikView, QlikView’s implementation timelines will drastically increase as they will be part of the ecosystem of these large an inefficient vendors. None of these software vendors can compete with QlikView, but they can stop customers from access this value by purchasing QlikView and changing the implementation approach and terms of sale.
Because of both the self-service aspect and the high-quality reports that can be generated by QlikView, it has a higher implementation success probability than other tools. Both QlikView and Tableau fall into the “pleasure to use” category. This is an entirely new category within BI as one of the significant underestimated areas of all enterprise software as the overall industry has tended to focus on technical specifications and integration aspects rather than usability and the user experience. QlikView can be implemented with fewer IT resources than most other BI solutions. QlikView also has outstanding performance, superior to most other BI solutions.
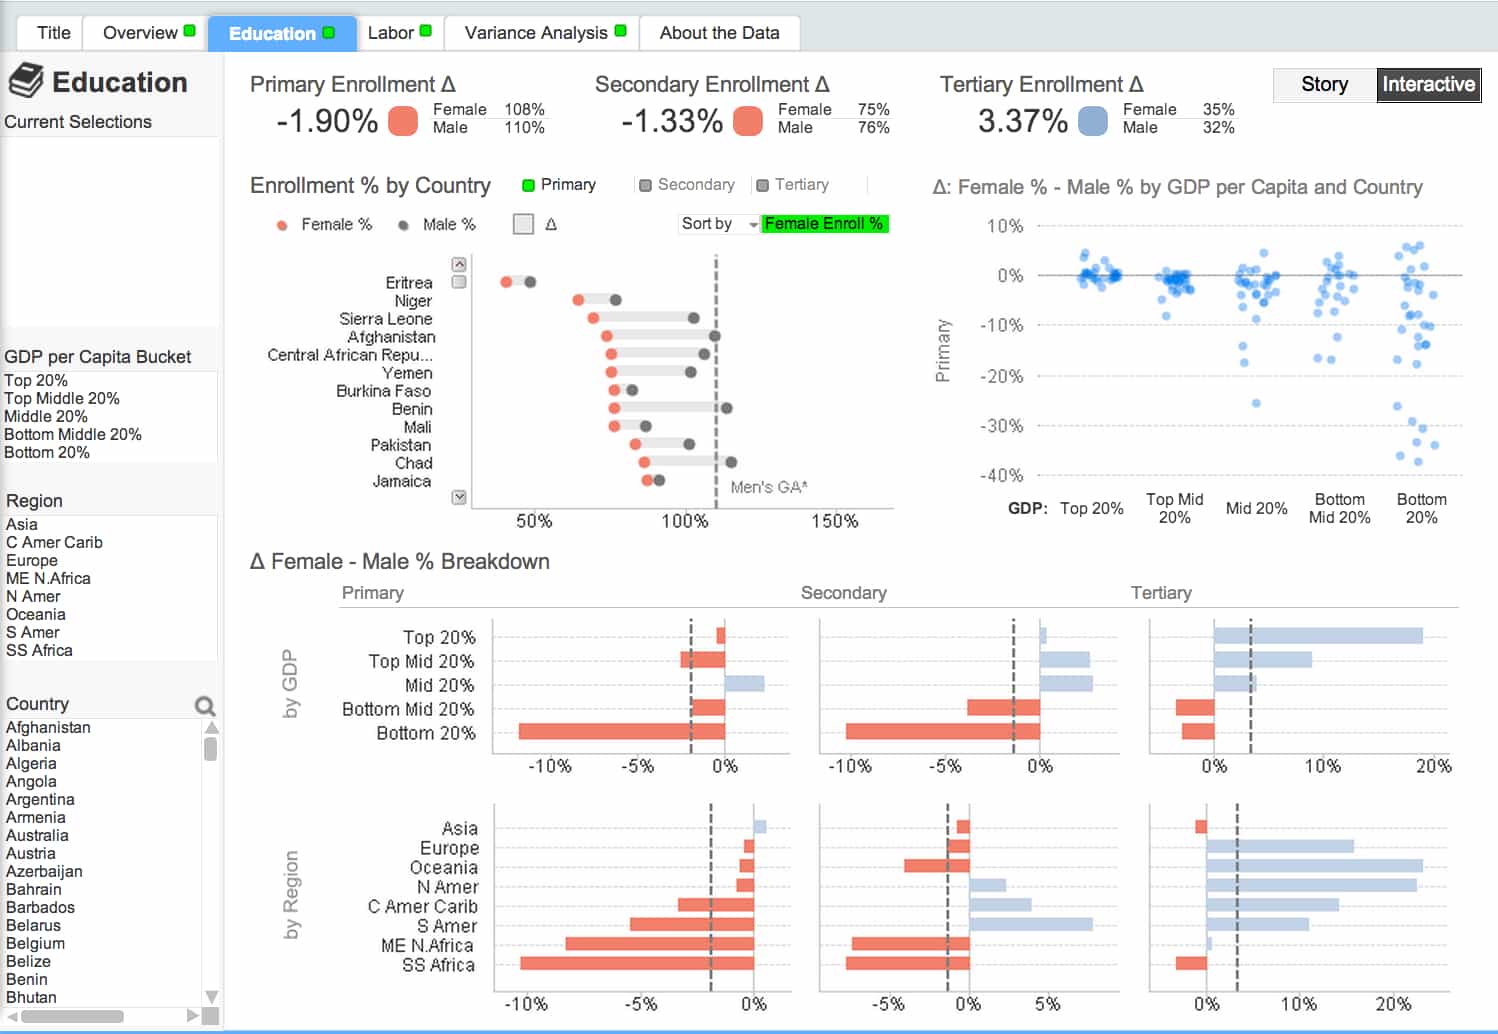
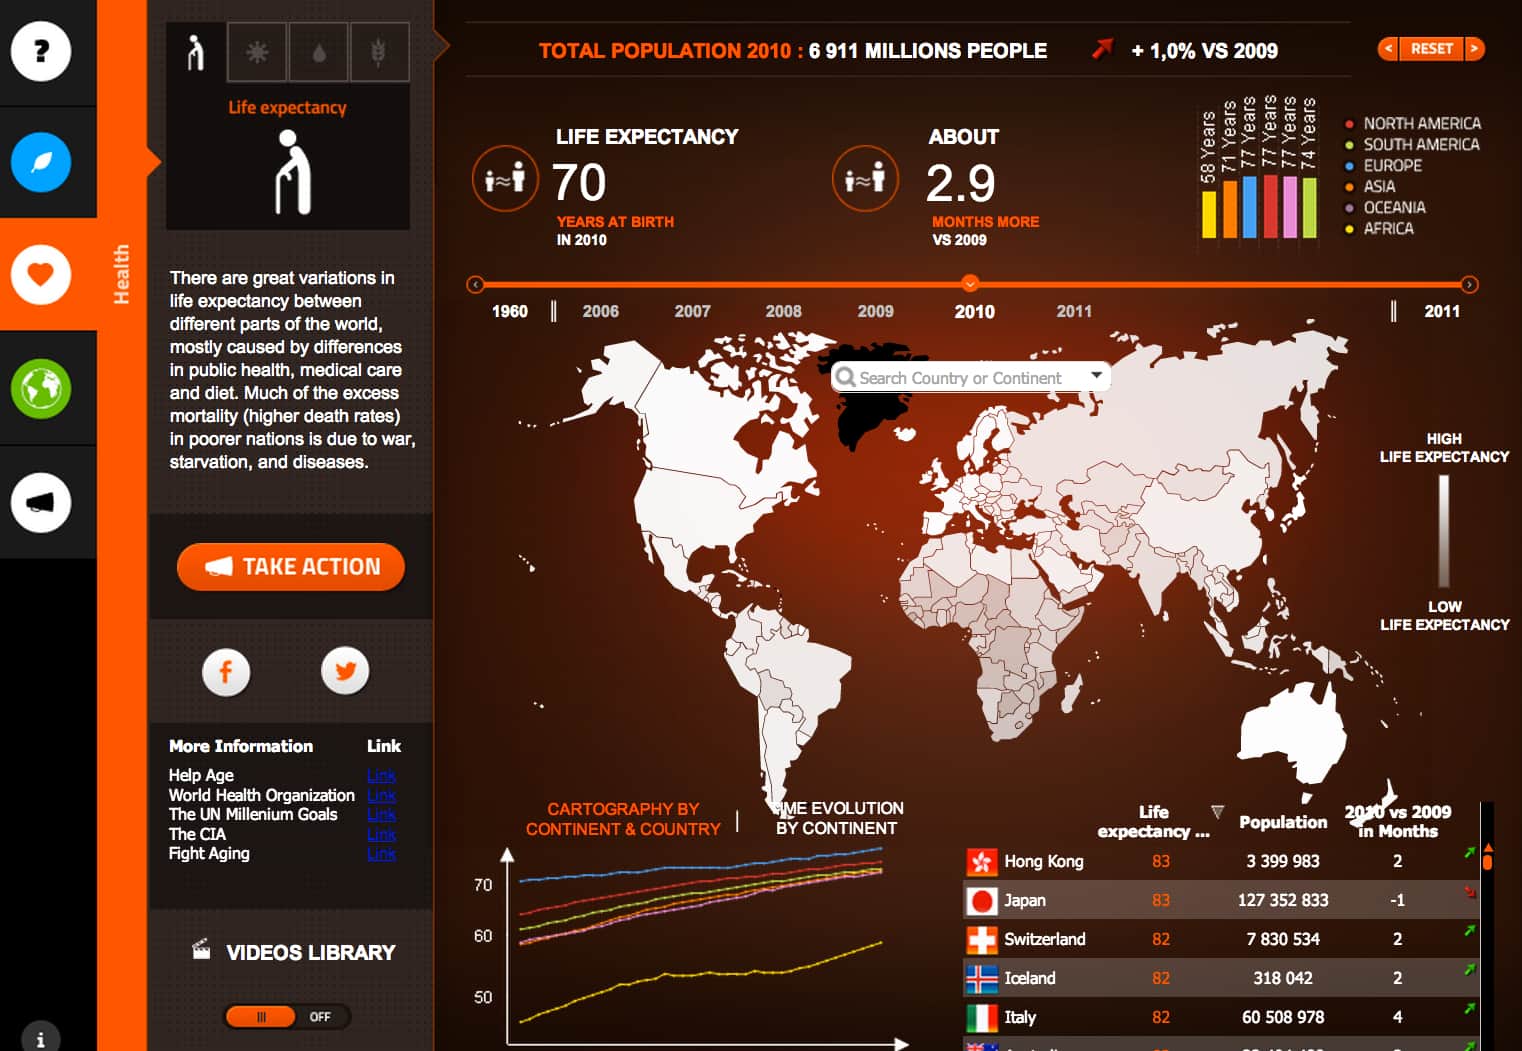
QlikView stands out for its highly detailed reports. Having many data elements is a hallmark of many QlikView reports.
This QlikView report beings by showing the overall view of all countries.
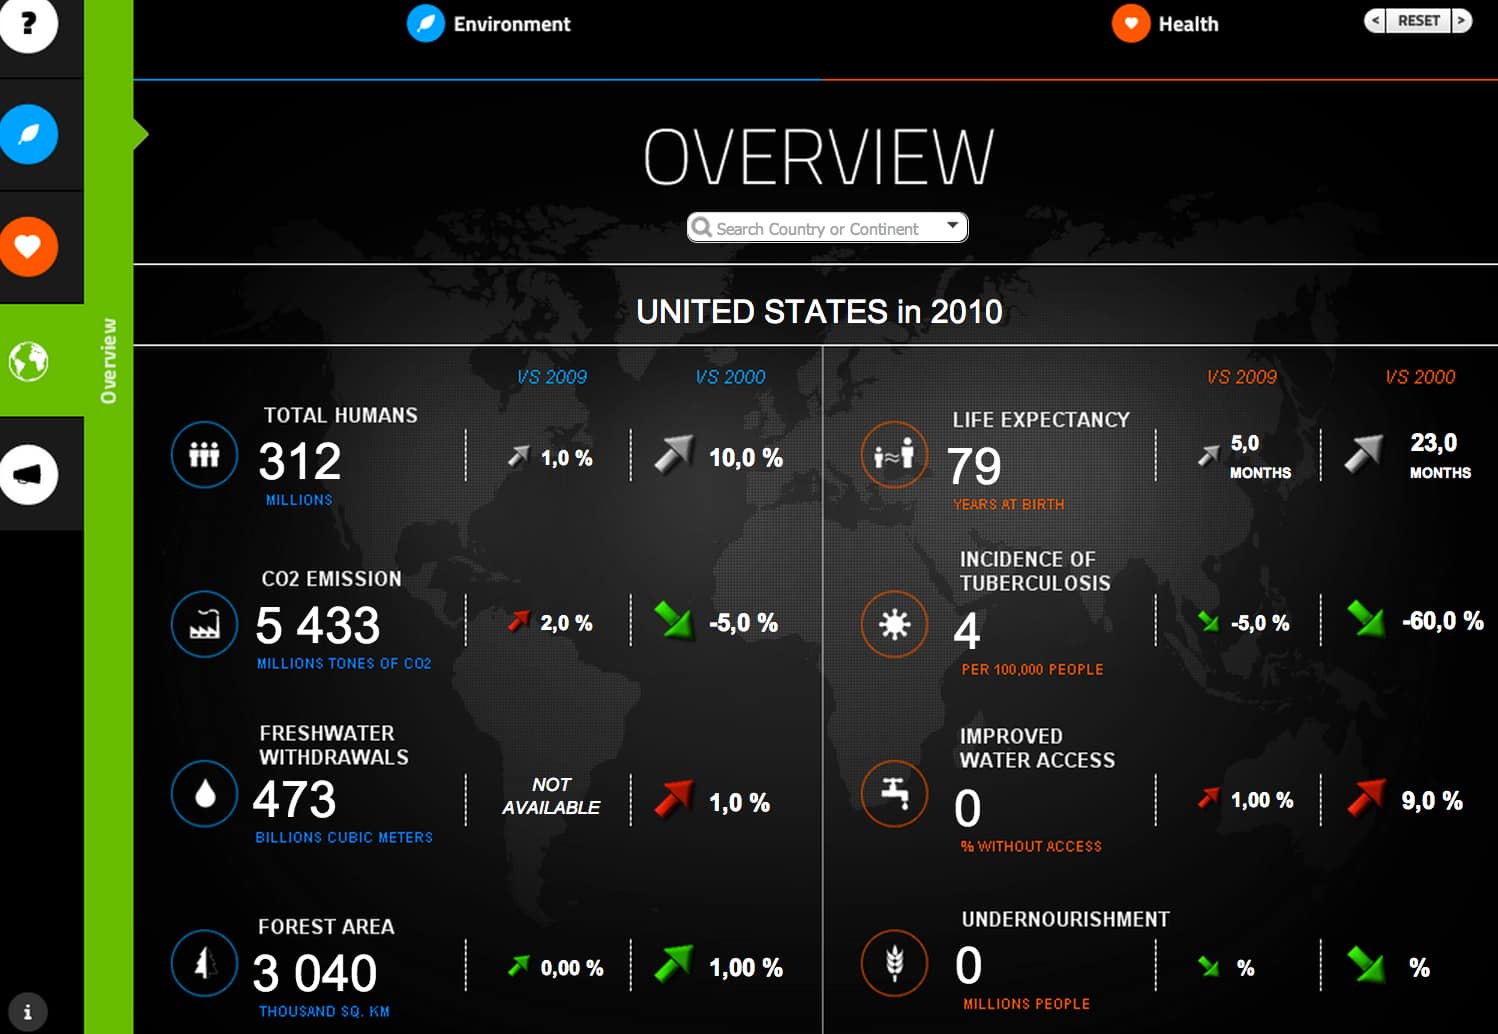
This type of detail is evident from this report as well. This is just one layer; to the left one can see multiple sections of the story, which bring up different data all related to the topic of population and statistics per country.
Many may want to restrict QlikView to only reporting on non-political topics such as sales per region. However, the analytical capabilities of QlikView can also be used for reports like the one above. Certain elite members of society would not want much of the population to see the report above. It would, of course, be unfortunate if analytics lead to any real social change. It may be necessary to make it illegal to use BI products for specific topics; the software is just becoming too good.
One feature about QlikView is that it does not use real-time data. It pulls from other data sources, and having data already in the application is how it is so fast. This is also why QlikView tends to have an expensive hardware setup and must be architected carefully. Another thing about QlikView that surprising people is that the application is not delivered via SaaS, although there are plans to move to this delivery method.
QlikView is a powerful application that most buyers should be looking very carefully at. Buyers can expect to bring up QlikView quickly, and attain one of the fastest ROIs of any application in the BI space.
MUFI Scores
All scores out of a possible 10.
MUFI Scores
- Ma. = Maintainability
- Us. = Usability
- Fu. = Functionality
- Im. = Implementability
| App | Ma. | Us. | Ft. | Im. | Cat. |
|---|---|---|---|---|---|
| Average Score for Big ERP | 5.1 | 4.8 | 5.2 | 5.4 | Big ERP |
| Average Score for CRM | 6.2 | 6.2 | 5.1 | 5.9 | CRM |
| Average Score for Small and Medium ERP | 8.3 | 8 | 6.7 | 8.5 | Small and Medium ERP |
| Average Score for Finance | 8.8 | 8.8 | 8 | 8.8 | Finance |
| Average Score for Demand Planning | 7.6 | 7.2 | 7 | 7.1 | Demand Planning |
| Average Score for Supply Planning | 6.7 | 6.9 | 7 | 6.8 | Supply Planning |
| Average Score for Production Planning | 6.8 | 6.9 | 7 | 6.9 | Production Planning |
| Average Score for BI Heavy | 5.5 | 5.3 | 6.9 | 5.3 | BI Heavy |
| Average Score for PLM | 7 | 7.2 | 6.8 | 7.3 | PLM |
| Average Score for BI Light | 7.7 | 8.7 | 9 | 8.3 | BI Light |
| Arena Solutions Arena PLM | 10 | 10 | 10 | 10 | PLM |
| AspenTech AspenOne | 4 | 8 | 10 | 7 | Production Planning |
| Birst | 8 | 8.5 | 10 | 8 | BI Light |
| ERPNext | 10 | 10 | 7.5 | 10 | Small and Medium ERP |
| Delfoi Planner | 8 | 6 | 6.5 | 7 | Production Planning |
| Demand Works Smoothie SP | 9 | 10 | 7 | 10 | Supply Planning |
| Hamilton Grant RM | 10 | 9 | 8.5 | 9 | PLM |
| IBM Cognos | 2.7 | 3 | 1.5 | 3 | BI Heavy |
| Infor Epiphany | 7 | 8 | 6 | 5 | CRM |
| Infor Lawson | 8 | 7 | 6 | 7 | Big ERP |
| Intuit QuickBooks Enterprise Solutions | 9 | 9 | 5 | 9 | Finance |
| JDA DM | 9 | 7.5 | 8 | 8 | Demand Planning |
| Microsoft Dynamics CRM | 2 | 3 | 2 | 2 | CRM |
| NetSuite CRM | 6 | 4 | 3 | 3 | CRM |
| Netsuite OneWorld | 7 | 7 | 8 | 8 | Big ERP |
| OpenERP | 7 | 8 | 8.5 | 8 | 7 |
| Oracle BI | 4 | 4 | 3 | 6 | BI Heavy |
| Oracle CRM On Demand | 4 | 5 | 3 | 5 | CRM |
| Oracle Demantra | 5 | 3 | 3.5 | 4.5 | Demand Planning |
| Oracle JD Edwards World | 4 | 1 | 3 | 6 | Big ERP |
| Oracle RightNow | 6 | 7 | 4 | 5 | CRM |
| PlanetTogether Galaxy APS | 10 | 10 | 10 | 10 | Production Planning |
| Preactor | 8 | 7 | 3 | 7 | Production Planning |
| QlikTech QlikView | 9 | 9 | 10 | 9 | BI Light |
| Rootstock | 9 | 8 | 9 | 9 | Small and Medium ERP |
| Sage X3 | 8 | 8 | 7 | 8 | Big ERP |
| Salesforce Enterprise | 8 | 8.5 | 9 | 7.5 | CRM |
| SAP APO DP | 3 | 4 | 3 | 2 | Demand Planning |
| SAP APO PP/DS | 2 | 2 | 4 | 3 | Production Planning |
| SAP APO SNP | 3 | 4 | 8 | 4 | Supply Planning |
| SAP BI/BW | 1.5 | 2 | 4 | 2 | BI Heavy |
| SAP Business Objects | 3 | 2.5 | 7 | 3 | BI Heavy |
| SAP CRM | 4 | 3 | 6 | 4 | CRM |
| SAP ECC | 3 | 3 | 6.5 | 3 | Big ERP |
| SAP PLM | 1 | 2.5 | 2 | 3 | PLM |
| SAP SmartOps | 4 | 4 | 7 | 5.5 | Supply Planning |
| SAS BI | 6.5 | 7 | 9 | 6 | BI Heavy |
| SAS Demand Driven Forecasting | 7 | 8 | 9 | 7 | Demand Planning |
| Tableau (BI) | 9 | 10 | 10 | 10 | BI Light |
| Tableau (Forecasting) | 10 | 8 | 5 | 9 | Demand Planning |
| Teradata | 8 | 6.3 | 9.7 | 6 | BI Heavy |
| ToolsGroup SO99 (Forecasting) | 7 | 8 | 9 | 7 | Demand Planning |
| ToolsGroup SO99 (Supply) | 5 | 6 | 10 | 7 | Supply Planning |
Vendor and Application Risk
QlikView is such an intriguing option because they offer one of the best front ends in reporting, but they have more backend than Tableau. Because of this, they have the potential to deliver one of the highest ROIs of any BI implementation. But because of their powerful front end, as with Tableau, it can be easy to underestimate how much work is required to develop their reports. QlikView does not have much in the way of partnerships with the major consulting companies, so the consulting is a much better value than software vendors that do have these partnerships. The advice offered by QlikView will also tend to better making for a more efficient implementation.
Likelihood of Implementation Success
This accounts for both the application and vendor-specific risk. In our formula, the total implementation risk is application + vendor + buyer risk. The buyer specific risk could increase or decrease this overall likelihood and adjust the values that you see below.
Likelihood of Application Implementation Success and Failure
Search for the application in this table using the search bar in the upper right of the table.
| Application | Prob of Implementation Success | Prob of Implementation Failure |
|---|---|---|
| Actuate | 0.77 | 0.23 |
| SAP Smartops | 0.39 | 0.61 |
| NetSuite CRM | 0.46 | 0.54 |
| Sugar CRM | 0.62 | 0.48 |
| Base CRM | 0.91 | 0.09 |
| SAP CRM | 0.35 | 0.65 |
| Salesforce Enterprise | 0.72 | 0.28 |
| QlikTech QlikView | 0.82 | 0.18 |
| Tableau (BI) | 0.98 | 0.02 |
| SAP Crystal Reports | 0.46 | 0.54 |
| Brist | 0.83 | 0.17 |
| MicroStrategy | 0.7 | 0.3 |
| SAS BI | 0.76 | 0.24 |
| Oracle BI | 0.35 | 0.65 |
| IBM Cognos | 0.23 | 0.77 |
| Infor Epiphany | 0.58 | 0.42 |
| Microsoft Dynamics CRM | 0.26 | 0.74 |
| Oracle RightNow CRM | 0.41 | 0.59 |
| Oracle CRM On Demand | 0.36 | 0.64 |
| Teradata | 0.76 | 0.24 |
| SAP Business Objects | 0.32 | 0.68 |
| SAP BI/BW | 0.25 | 0.75 |
| SAP PLM | 0.29 | 0.71 |
| Hamilton Grant RM | 0.89 | 0.11 |
| Arena Solutions | 0.96 | 0.04 |
| Delfoi Planner | 0.7 | 0.3 |
| Preactor | 0.64 | 0.36 |
| PlanetTogether Galaxy APS | 0.96 | 0.04 |
| AspenTech AspenOne | 0.55 | 0.45 |
| SAP APO PP/DS | 0.27 | 0.73 |
| Demand Works Smoothie SP | 0.93 | 0.07 |
| ToolsGroup SO99 (Supply) | 0.82 | 0.18 |
| Demand Works Smoothie | 0.96 | 0.04 |
| Tableau (Forecasting) | 0.9 | 0.1 |
| SAS Demand Driven Forecasting | 0.82 | 0.18 |
| ToolsGroup SO99 (Forecasting) | 0.86 | 0.14 |
| JDA DM | 0.57 | 0.43 |
| Oracle Demantra | 0.33 | 0.67 |
| SAP APO DP | 0.28 | 0.72 |
| FinancialForce | 0.92 | 0.08 |
| Intacct | 0.98 | 0.02 |
| Intuit QB Enterprise | 0.8 | 0.2 |
| ERPNext | 0.9 | 0.1 |
| OpenERP | 0.78 | 0.22 |
| Rootstock | 0.91 | 0.09 |
| ProcessPro | 0.93 | 0.07 |
| Microsoft Dynamics AX | 0.4 | 0.6 |
| SAP Business One | 0.49 | 0.51 |
| Sage X3 | 0.62 | 0.38 |
| Infor Lawson | 0.58 | 0.42 |
| Epicor ERP | 0.4 | 0.6 |
| Oracle JD Edwards World | 0.31 | 0.69 |
| Oracle JD Edwards EnterpriseOne | 0.36 | 0.64 |
| SAP ERP ECC/R/3 | 0.32 | 0.68 |
| NetSuite OneWorld | 0.65 | 0.35 |
Risk Definition
See this link for more on our categorizations of risk. We also offer a Buyer Specific Risk Estimation as a service for those that want a comprehensive analysis.
Risk Management Approach
Buyers are in a good position to have a successful implementation after a QlikView purchase. The implementation is low risk, and there are not unusual gotchas.
Finished With Your Analysis?
To go back to the Software Selection Package page for the BI Light software category. Or go to this link to see other analytical products for QlikTech QlikView.
References
Schlegel, Kurt. Sallam L. Rita. Yuen, Daniel. Tapadinhas, Joao. Gartner Magic Quadrant for Business Intelligence and Analytics Platforms. Gartner. 2013