
Productivity Benefits Not Shared With Normal Workers
Executive Summary
- Finding a Graph of the Problem
- Fake Work
- Comments by Michael Hudson
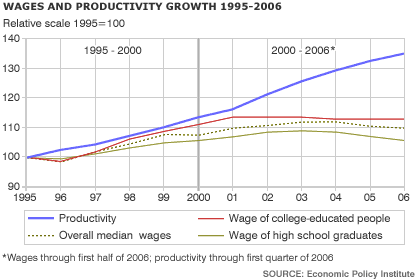
Finding a Graph of the Problem
Where is the chart showing the growth of productivity going back to 1950? Productivity has grown close to 4 times since 1950. However, wages have seriously lagged. The following quote is indicative of the issue. Here is one graph we found from the BBC, but it does not go back very far. Notice the extreme discrepancy between productivity growth and wage growth after 2001. However, other graphs we have seen make the problem seem even worse.
Fake Work
The book Fake Work provides an interesting quote; although its focus is not on macroeconomics, it is still interesting for this topic.
Productivity is difficult to measure, and official statistics measure it merely as the Gross Domestic Product adjusted for inflation divided by the total number of hours worked. But if this measure means anything at all, an average worker today needs to work a mere 11 hours per week to produce as much as one working 40 hours per week in 1950. (The data here is from the U.S., but productivity increases in Europe and Japan have been of the same magnitude.) The conclusion is inescapable: a worker should be able to earn the same standard of living as a 1950 worker in only 12 hours per week.

Fake Work, Brent Peterson, and Gayland Nielson, Simon Spotlight Entertainment, 2009.
Statistics from the U.S. Bureau of Labor Statistics.
For specific details, see (which we highly recommend, by the way, because it is quite interesting) https://groups.csail.mit.edu/mac/users/rauch/misc/worktime/
However, we are not so sure the statement in the book is this cut and dried because at least part of the productivity goes back into capital equipment. The Center for Policy and Research, which is a very reliable source for economics analysis, states the following.
A second major cause of the gap between wage growth and productivity growth is the fact that productivity is measured against gross output, while income must come from net output ― no one can eat depreciation. There has been a substantial increase in the gap between gross and net output in recent years, as the share of GDP going to replace worn out and obsolete equipment has increased. As a result, the rate of growth of “usable productivity” is considerably slower than the productivity growth numbers reported by the Labor Department. When these factors are taken into account, the missing wage growth is considerably less of a mystery.
The CEPR goes on to explain how the increased obsolescence of capital equipment reduces the possible payout to wages.
Typically, we expect wage growth to track productivity growth, assuming that the wage and capital shares of national income stay constant. However, this is not possible if an increasing share of national income is devoted to depreciation. No one can eat depreciation; this is output that must be set aside to replace worn out or obsolete capital. In the fifties and sixties, there was little change in the depreciation share of output, so that the rate of growth of gross output and net output was almost the same.
This has changed in the last quarter century as a larger share of investment has been in short-lived capital goods like computers and software that wear out or become obsolete quickly. Figure 1 shows the growth path of real gross and net output since 1959. As can be seen, the growth paths have begun to diverge noticeably in recent years. Over the course of the current business cycle, the gap between the growth rate of gross and net output has averaged 0.4 percentage points. Even if there were no changes in distribution, there would be a gap of this size between the growth rate of productivity and the growth of wages.
The short explanation is that while productivity is increasing, it requires more capital in order to attain this productivity. This is another way of saying that all industries are becoming more capital intensive. So more complex and expensive computers, manufacturing equipment and other capital inputs. This capital must be repaid, and also must earn a return, and this reduces the possible payout to labor. That is one part of the story. The other part is how much is being retained by capital owners.
CEPR goes on to explain the following with respect to the differences between the elite workers:
Finally, there has been redistribution among wage earners, from those at the middle and the bottom to those at the top. Wages for workers at the 90th and 95th percentile have risen at a healthy pace throughout this cycle and it is likely that wage growth has been even more rapid for workers higher in the wage distribution. The evidence suggests that it is not so much the owners of capital who are profiting at workers’ expense in this cycle (at least compared to the last one), but rather the workers at the top end of the wage distribution. Through luck or favorable policy, they have managed to be the big gainers in the current business cycle. See the link for the full article.
https://www.cepr.net/documents/publications/0702_productivity.pdf
We accept the analysis provided by CEPR. However, we would question whether people in the 90th percentile and above are really workers anymore. For instance, many may be partners in law or accounting firms. These people are very close to capital owners. If the 90th and particularly the 95th percentile and above are seeing their wages increase significantly, it’s important to recognize that while there are a few highly paid specialists and bond traders in this class, the majority of workers in this class are actually taking a chunk of the wages from a group of people below them.
Comments by Michael Hudson
Michael Hudson was also interviewed on this topic and has some interesting things to say about how housing is designed to consume the majority of people’s disposable income. This, at least partially, explains why there are so many people that make good salaries but can’t seem to get ahead and do not have much discretionary income.
MW: What is the relationship between stagnant wages for workers and the current credit crisis? If workers wages had kept up with the rate of production, isn’t it less likely that we would be in the jam we are today? And, if that is true, than shouldn’t we be more focused on re-unionizing the labor force instead looking for solutions from the pathetic Democratic Party?
Michael Hudson: The credit crisis derives from “the magic of compound interest,” that is, the tendency of debts to keep on doubling and redoubling. Every rate of interest is a doubling time. No “real” economy’s production and economic surplus can keep up with this tendency of debt to grow faster. So the financial crisis would have occurred regardless of wage levels.
Quite simply, the price of home ownership tends to absorb all the disposable personal income of the homebuyer. So if wages would have risen more rapidly, the price of housing would simply have risen faster as employees pledged more take-home pay to carry larger mortgages. Stagnant wages merely helped keep down the price of houses to merely stratospheric levels, not ionospheric ones.
As for labor unions, they haven’t been any help at all in solving the housing crisis. In Germany where I am right now, unions have sponsored co-ops, as they used to do in New York City, at low membership costs. So housing costs only absorb about 20 percent of German family budgets, compared to twice that for the United States. Imagine what could be done if pension funds had put their money into housing for their contributors, instead of into the stock market to buy and bid up prices for the stocks that CEOs and other insiders were selling. (see the full interview at the link below)
https://onlinejournal.com/artman/publish/article_3702.shtml
Conclusion
What we would very much like is an estimate as to what percentage of productivity gains is accruing the say, the bottom 85% of workers. This is because real wages on average have not gone up since 1973. In order to begin using this argument that common workers are really not sharing in the prosperity or even the technological progress of the nation (as producers, they do share in the benefits as consumers, but there seems to be no evidence “normal” workers benefit as producers or in wages from their employment). We do not know the answer to this question, and we have since emailed CEPR for their views on the topics.
References
Analyzing growth in labor and capital productivity, William Baumol he has calculated that innovation carried out since 1870 accounts for nearly 90 percent of today’s GDP, including even the “steam engine, the railroad, and many other inventions of an earlier era.”[3] But the Forbes lists of the world’s wealthiest people shows the degree to which most wealth today consists of rent-yielding property. The Federal Reserve’s reports on “Balance Sheet of the U.S. Economy” (Table Z of its quarterly flow-of-funds statistics) show that real estate remains the economy’s largest asset, and further analysis makes it clear that land accounts for most of the gains in real estate valuation. Most of the remaining U.S. wealth consists of other monopolies – fuels and minerals, the broadcasting spectrum, Microsoft and kindred intellectual property rights.
https://www.cooperativeindividualism.org/hudson-michael_the-rentier-economy.html
On Where the Productivity Improvements Went
Suppose someone at the end of World War II in 1945 had been informed of the remarkable technological breakthroughs that have occurred over the past 60 years – the advances in medicine and pharmaceuticals, genetics, air and even space travel, communications, computers and information processing, atomic power, and a better ecological understanding of how our planet works. The expectation would have been for a leisure economy in which citizens could devote themselves to better educational and cultural pursuits. At least, this was what futurists promised, decade after decade as they looked at the great potential of technological progress.
The question is, why haven’t these rosy pictures materialized? Why are employees working longer than ever before, with many couples holding three jobs between them?
George’s answer was that rent – and rising land prices – was diverting the economic surplus away from capital formation and consumption, exploiting both capital and labor. But the problem does not stem only from of land-rent. The most notable examples of prices and incomes without corresponding (necessary) costs of production are finance and insurance, whose interest, commission and policy charges are set independently of costs. And much of what passes for industrial profits actually consists of monopoly rent and “intellectual property rights.” These rents are highest in areas where productivity and technological breakthroughs since World War II have been largest and were expected to bring society the greatest benefits.
During 1992 this genteel academic discussion gave way to a public debate, carried out in the pages of the New York Times, the Wall Street Journal, and assorted popular magazines. This public debate was remarkable in two ways. First, the conservative side displayed great ferocity in presenting its case and attacking its opponents. Second, conservatives chose to take an odd, and ultimately indefensible, position. They could legitimately have challenged those who have called attention to the growing dispersion of income on the grounds that nothing can, or at any rate should, be done about it. But with only a few exceptions they chose instead to make their stand on the facts to deny that the massive increase in inequality had happened. Since the facts were not on their side, they were forced into an extraordinary series of attempts at statistical distortion.
The whole episode teaches us two lessons. At one level, it is a sort of textbook demonstration of the uses and abuses of statistics. This article reviews that lesson, tracing out how conservatives tried to distort the record and why they were wrong. But the combination of mendacity and sheer incompetence displayed by the Wall Street Journal, the U.S. Treasury Department, and a number of supposed economic experts demonstrates something else: the extent of the moral and intellectual decline of American conservatism.
More On the Same Topic
“Interestingly, as an article on labor history notes, shorter hours were assumed to be a natural consequence of increased productivity in the US until the 1930’s, appearing in the platforms of all major parties, and the above shows how the workweek would have evolved had the trend continued after World War II. In Europe, reduced work time has continued to be an issue, and the workweek has been declining in recent times, unlike in the US. However, even in Europe, the decline in work time has fallen far behind the increase in productivity.” An average worker needs to work a mere 11 hours per week to produce as much as one working 40 hours per week in 1950. (The data here is from the US, but productivity increases in Europe and Japan have been of the same magnitude.) The conclusion is inescapable: if productivity means anything at all, a worker should be able to earn the same standard of living as a 1950 worker in only 11 hours per week. The following shows the number of hours per week needed to produce as much as a 1950 worker, using data from the US Bureau of Labor Statistics, including both manufacturing and services: