
The Brightwork Research & Analysis TCO Method Not Methodology
Executive Summary
- Brightwork Research & Analysis uses a comprehensive TCO method.
- How our method is different from most TCO methods.

Introduction
Consulting firms often use the term “methodology” without knowing what the word means. In this article, we explain why we use a method for TCO calculation and not a methodology.
What is a Method Versus a Methodology?
The term “methodology” comes from the Latin word methodologia, which is a combination of methodus (a mode of proceeding, a way of teaching, or a road) and logia or logy (the study of). Therefore, a methodology is the study of a mode of proceeding. A methodology is not a method, and many people who prefer to use a more sophisticated word rather than the accurate word confuses these terms. For instance, in supply chain planning, optimization is a “method”; it is not a methodology. A study of the methods employed in supply planning would be a methodology. A methodology is a
“design process for carrying out research or the development of a procedure and is not in itself an instrument for doing those things.”
One of the criticisms from Alan MacCormak’s 2003 study is that many TCO studies simply include too few cost categories, as he explains in the quotation below:
“The main area in which studies differ is with respect to the number and type of costs that are included in a TCO calculation.
At one end of the spectrum are studies that consider only one or two ‘direct’ costs, focusing mainly on the up-front cost of the particular software platform that is being evaluated. At the other end are studies that use a much more sophisticated assessment, capturing not only the direct costs involved in purchasing and maintaining and supporting a particular platform, but also the ‘indirect’ costs associated with the use of the system, such as the cost of downtime. Importantly, the more comprehensive studies typically find that the cost of purchasing or leasing the software represents only a small proportion of the TCO for a software platform. This illustrates the danger of relying on studies that use only partial data on cost as the basis for making IT investment decisions…
It is interesting to note that evaluations of TCO are not always conducted in a consistent manner even within the same firm.”
What Are the Components of TCO?
TCO, or Total Cost of Ownership, is the overall output of the process and simply sums the costs of the four main TCO categories:
- Software Costs: Software associated costs, such as purchasing licenses or SaaS delivered software, their monthly/yearly charge.
- Hardware Costs: Cost for hardware on which the software is installed.
- Implementation Costs: Consulting resources, consulting travel, training.
- Maintenance Costs: Fully loaded internal resources and vendor support.
The TCO Cost Categories
What follows is all of the individual cost categories that make up the final TCO.
Component #1: Software/License Costs
The license cost is the vendor’s initial purchase price for an on-premises delivered solution or the ongoing monthly or yearly software cost if the software is purchased as a SaaS-delivered application, often called a subscription.
Here it is important to estimate the costs for the equivalent product between the different vendors. For instance, at the time of this book’s publishing, the software vendor Salesforce offers five different pricing levels, ranging from $5 per month per user all the way up to $250 per month per user. These pricing levels represent very different applications, even though they are all “Salesforce.” The software license costs used from each vendor must be consistent across the vendors that are compared. For example, the business requirements must be matched against each application to find the appropriate application expense level.
Secondly, other vendors do not simply charge for their software either at different levels of use or by the number of users, but through a combination of both. For instance, one of the software vendors analyzed at Brightwork Research & Analysis has two different user types and add-on modules. Therefore, the yearly license/subscription cost is a combination of these two types of users and the specific functionality to be activated. If a customer does not need multi-currency or project accounting, they do not pay for it. This is another advantage of SaaS software vendors: they can price their application for just what the customer needs because they can control the customer’s functionality.
Component #2: Hardware Costs
The hardware itself is a small component of the overall cost of enterprise software.
This was not always the case. In fact, computer hardware was so expensive at one-time that it was not bought outright but rather was leased. But the phenomenal improvement in computing technology in the last four decades has reduced the costs and increased hardware performance to a stark degree.
In the book, Inventory Optimization and Multi-Echelon Planning, the graphic on the following page was used to show this improvement:
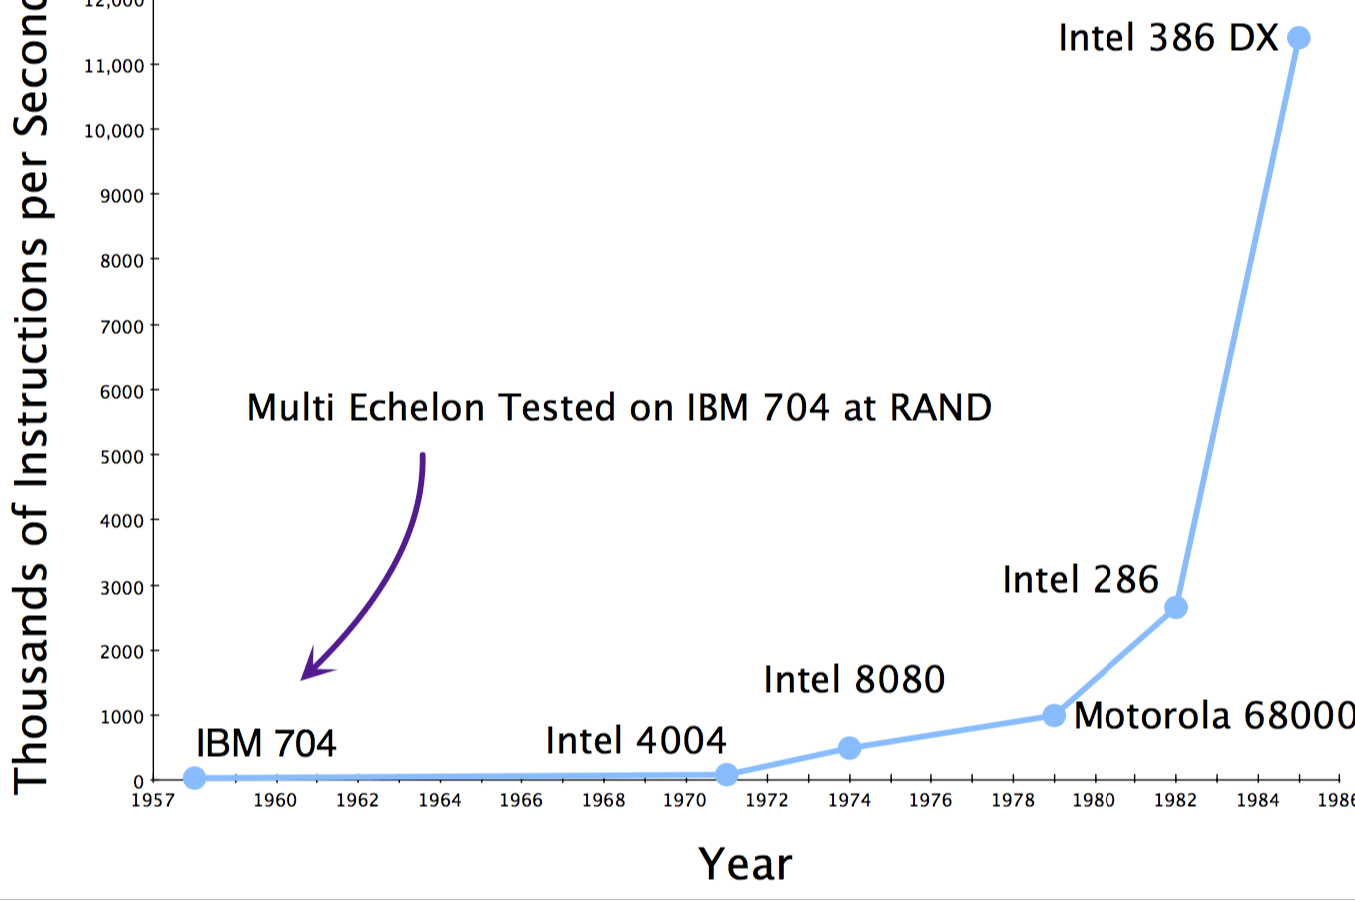
This graphic was cut off in 1986 because to continue the growth in speed until the present day would make the early increases imperceptible. However, the hardware contribution to TCO cannot be restricted to the costs of the actual hardware. Other costs relevant for hardware include support: the cost of IT professionals to keep the hardware running, upgrading the hardware, fixing it, etc. Many individuals who specialize in hardware cost estimation use a factor of twenty percent to estimate the ongoing maintenance costs of hardware.
However, the problem with this rule of thumb is that the maintenance costs for hardware are not proportional to the hardware costs.
Hardware and Consumption
When more hardware than is strictly necessary for the predicted consumption of the application is purchased, this is called oversizing. When too little hardware has been purchased, this is referred to as under-sizing. For instance, hardware that is oversized and more expensive versus the need often requires less care and feeding than undersized hardware. Oversized hardware does not run into the constant limitations that under sizing requires. This entire topic is tricky because it intersects with the methods used in the software, the configuration of that software, and the timings of other related systems. For instance, while working with a previous client, I was shocked to find that the frequent problems we had experienced with processing time were because we were running the software on a virtual server. This means that the hardware was not dedicated to the software. Sometimes, when other applications were doing intensive processing, our processing times would be long because less of the processor was allocated to our application.
Undersized Hardware
Undersized hardware not only increases the maintenance costs but increases the software costs as well, as successive adjustments are made to things like processing times and batch schedules to make up for hardware limitations. And these two costs far exceed the costs of adding more hardware. The expense hierarchy basically is the following from highest to lowest.
- Costs Incurred Through Software Adjustments
- Costs Incurred Through Hardware Maintenance
- Costs Incurred Through Adding Hardware
The process of sizing is the determination of the size of hardware, which must be purchased. It is quite common for companies to attempt to spend too much time sizing and being concerned with making adjustments that reduce the size of the hardware and the money spent on hardware that ends up costing more money in other ways. I have seen companies literally spend more money on performing hardware sizing than my client spent on the cost of the software itself. Spending a disproportionate amount on hardware sizing is easy to do if consultants are used to performing the hardware sizing (as their billing rate adds up quickly) or if the consultants’ work is delayed because they are awaiting a decision, hardware can move forward. Today, and likely in the future, the easiest answer to managing hardware limitations is to “throw hardware” at the problem. When I discuss IT’s types of errors, I am not talking about inexperienced IT departments from small companies. I am talking about IT departments with a lot of experience from the largest companies, and I am quite surprised by how few real hardware experts exist in IT departments who can size hardware across various applications.
Learning Curves for New Applications
One of the major issues is that IT departments are not experts in each application, so there is a learning curve for each new application. As a result, software vendors are in the best position to perform hardware sizing as they have the greatest number of data points and, of course, developed the software. When SaaS software becomes more prevalent, one of the great benefits will be to take IT departments out of the business of buying and maintaining hardware. For instance, best-of-breed vendors such as Arena Solutions and Birst follow a multi-tenant model, where customers share one application. Still, each customer uses a division of the database. The application is the same, but the data is not mixed up between the customers. Under the SaaS delivery model, the hardware is far better utilized, as is explained by a quotation from the business intelligence software vendor Birst.
“This extremely variable computing load requires provisioning of greater computing power and generally results in lower hardware use than in conventional computing systems. It is not uncommon to have CPU and disk use at 1–4% in order to handle infrequent peaks of 60–80%. These low use levels result in particularly expensive hardware requirements. Cloud-based hardware virtualization does not address this as these systems must remain on and using CPU at all times, as user load is unpredictable. This is compounded if any degree of service level is required. To maintain uptime service levels, redundant hardware must be made available for clustering and failover, often doubling hardware infrastructure costs.”
SaaS Software Delivery and Scalability
SaaS software delivery has proven to be the most scalable and lowest cost approach to managing hardware and software. Therefore, software vendors are in the best position to perform sizing. Still, under the SaaS and multi-tenant model, the vendor gets to spread its hardware over many customers, meaning the hardware is more efficiently utilized. For instance, when Arena Solutions or Birst are asked to host a new customer, they can spread their hardware over many customers. Software and hardware update decisions will become invisible to the purchasing company. It will be the SaaS software vendor’s job to simply maintain the performance outlined in the service level agreement with their customer.
Component #3: Implementation Costs
Direct Estimation of Implementation Costs
Implementation costs are segmented into external costs and internal costs.
- External implementation costs are the consulting costs, which can come from the software vendor or a consulting company.
- Internal implementation costs are the costs that the company incurs during the implementation of using its internal resources. These are primarily the IT and business resources departments that are assigned to the project.
Both external and internal implementation costs can be determined in several ways. Calculating various implementation durations and the allocation percentage, and the cost of each resource (the billable rate for external resources and the fully-loaded costs for the internal resources) is the most accurate method of determining implementation cost has first-hand experience implementing the software in question. However, as no one person has implemented all the software for which a TCO would be desired, it is necessary to use multiple estimates on many occasions. The most common multiple estimations are based upon the license cost. Therefore, if the software cost is $1,000,000, and the consulting to license cost multiple is two, the estimated consulting cost would be $2,000,000. Implementation multiples generally range from one to four. Some applications that are not implemented by large consulting companies from efficient software vendors actually have a multiple that is less than one; however, true on-premises enterprise software will have a multiple higher than one. The only way to lower the multiple is to use SaaS solutions.
Top-Down Versus Bottom-Up Estimation
At Brightwork Research & Analysis, the various TCO estimations are multiple-based rather than estimated from “the bottom up” change depending upon the application and the software vendor. Multiple estimations from software vendors cannot be simply accepted but must be blended with experience in implementation.
Many software vendors quote a 1:1 ratio between software costs and consulting costs. However, this is not the extent of implementation costs. Software vendors only consider their consulting costs (although sometimes they add in training) and do not include internal resource costs for the implementing company. Generally, consultants from the software vendor provide the best consulting value. As soon as an outside consulting company is involved, the costs of the implementation go up. A major reason SAP and Oracle implementations are so expensive than other implementations are that these applications are typically implemented by the major consulting companies with the highest implementation costs. As soon as a major consulting company is involved in the project, costs dramatically increase. The quid pro quo is very simple. The consulting company tells the software vendor.
“We will recommend you, but only if you give us nearly all of the consulting business—if you don’t do this we will not recommend you.”
Where the Billings Go
The consulting billings partially go to the consultants, but much of it is simply going to the management—that have very little to do with implementing the software. A partner at a large consulting company, out of the IT practice, will make roughly $500,000 per year without ever touching the application being implemented. In addition to the partner’s compensation, the major consulting companies also have large overheads in offices (these often have to be prestigious to impress visiting clients), marketing (advertising and attending conferences), expense accounts, etc. Again, none of these things have anything to do with project work. At the end of the day, we estimate that roughly 1/3 of the major consulting companies’ billing rate actually goes to project work. But before we close the book on this topic, it’s important to consider that the value is actually far worse than this. Aside from higher billing rates, major consulting companies tend to steer clients to the most expensive applications. They also stretch out the length of the implementations, which greatly increases costs. Therefore the implementation costs are entirely different if a major consulting company is involved. Therefore, to account for all of this, Brightwork Research & Analysis uses higher multiples if a client states that they are using a major consulting company. Companies performing TCO analysis themselves should do the same. In the following paragraphs, we will review how to estimate implementation costs. This method is based on detailed first-hand knowledge.
External Implementation Costs
Sometimes implementation costs are best determined by using the following formula:
(Hourly Rate per Implementation Consultant × The Percent of Time Assigned to the Project × The Implementation Duration) + Travel Costs Module Implementation
Consultant This is the module implementation consultant’s hourly rate, who is the more junior resource on the project from the consulting company or the vendor. The cost of this resource is calculated with the following formula:
(Hourly Rate × Percentage of Time on the Project) × Average of (Implementation Duration Low, Implementation Duration High) × 4.3 (weeks per year) × 40 (hrs)20 Senior Module Implementation Consultant
This is the more senior module implementation consultant’s hourly rate, the more senior resource on the project from the consulting company or the vendor. The cost of this resource is calculated using the following formula:
(Hourly Rate × Percentage of Time on the Project) × Average of (Implementation Duration Low, Implementation Duration High) × 4.3 (weeks per year) × 40 (hrs) Senior Manager/Partner
This is the hourly rate for the more senior manager/partner, the most senior resource on the project from the consulting company or the vendor. This resource will deal with project management issues, perform account management, acquire resources as needed, etc. These are not full-time resources but tend to manage multiple projects (if they are from the vendor) or manage the overall program (of which the module being calculated here is just one part). There is a separate line item for the percentage that each of these resources is on the project. Changing either the hourly rate or the percentage of time they are on the project adjusts the consulting costs. I won’t list the explanations for each of the consulting line items’ duration, as they should be self-explanatory. The cost of this resource is calculated with the following formula:
(Hourly Rate × Percentage of Time on the Project) × Average of (Implementation Duration Low, Implementation Duration High) × 4.3 (weeks per month) × 40 (hrs) Travel Cost Assumption
This is for a project in the US. A Manhattan or San Francisco project would be more expensive, and a project in Omaha, Nebraska, would be less. If a company can get them, local resources would cost less—but of course, it is not likely that the company would find local resources, and most often, the local resources are not the best resources for the project. The travel cost is estimated at $45 per hour and is then multiplied by the number of hours the consultants are predicted to be on the project. This per hour estimate can be adjusted per the project’s location. I developed the following expense estimate spreadsheet for a project in Seattle, for which I bid an all-inclusive rate (that is, I would pick up my expenses). Because I sometimes stay over weekends, I want to include my cost of staying and the cost if I fly in and out of the city.
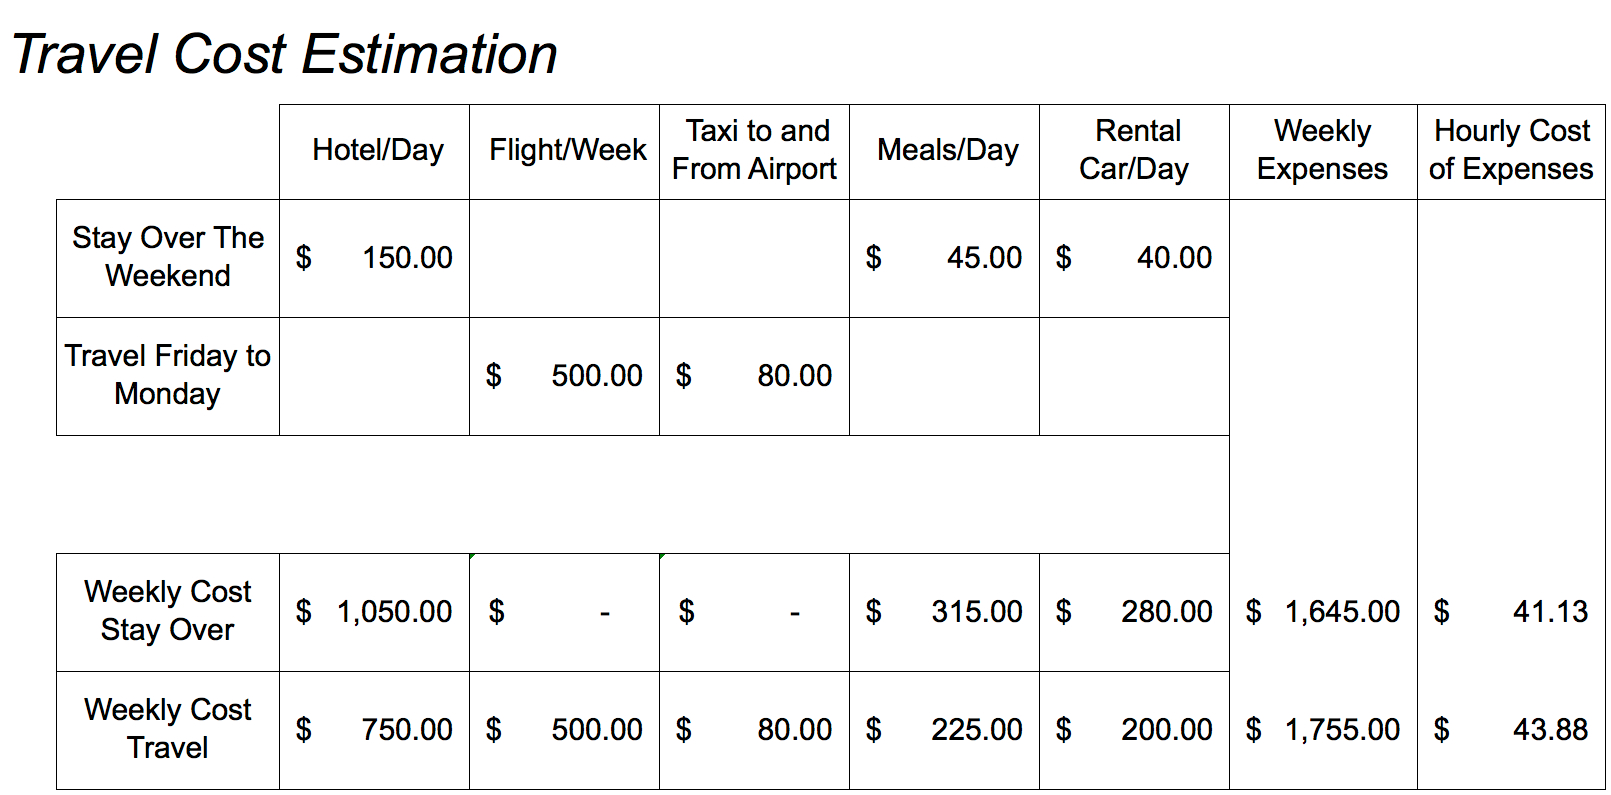
As you can see, the estimates for staying over or flying out are about the same—just a few dollars more per hour for flying out. But, of course, the cost depends upon how far the flight is and how far in advance the flight is booked. Furthermore, the consultant’s efficiency and on-site time are lower if they fly in, as they do not appear at the client site until late Monday morning and have to leave by Friday (in some cases Thursday) in the early afternoon to catch their flight.
Internal Implementation Costs
The next area to estimate is the internal implementation costs.
Total Client Resource Costs for the Implementation
This is the total cost of staffing the client resources for the project. The formula we use for the total client resource costs is as follows:
The Total Client Resource Costs = (Implementation Duration in Weeks × The Opportunity Cost Per Week) × The Percent of the Average Week the Employee is assigned to the Project
The formula makes the following assumptions:
- The Implementation Duration in Weeks = (Average of the Duration in Months × 4.3)
- The Opportunity Cost Per Week = (The Number of Employees on the Project × The Hours Per Week × The Number of Weeks × The Fully Loaded
Hourly Rate the Employee Costs the Company) - The Percent of the Average Week the Employee is Assigned to the Project
The Percent Each Resource is Assigned to the Project
Often, client resources assign part of their time to the project while retaining most of their other duties. The greater the number of applications included in the implementation, the more likely internal resources will be one hundred percent allocated to the project. However, we are calculating the TCO for the implementation of one application only.
Implementation Duration
Implementation duration is measured from the beginning to the end of the implementation. The duration of a project cannot be predicted reliably to the month. Companies that attempt to meet deadlines that were predicted before the start of the project often end up with faux go-lives where the software is not really ready, and they must continue to work intensively after the go-live date. Many factors must be taken into consideration when estimating the implementation duration. Different clients have different levels of complexity and are in different areas of the application’s functionality. Some clients may leverage older and more proven functionality, while others may choose to activate newer and less proven functionality. Some companies choose consulting companies that don’t know the software very well or can’t document the solution.
We cover this topic in more detail in the article How to Estimate The Duration of Consulting for Software TCO.
The Cost Implications of Implementation Duration
Implementation duration affects TCO in several important ways. The longer the project’s duration, the more the expenses of the implementation add up because
the consultants are on the project longer, and the longer it is until the company can begin seeing payback from its efforts (however, this is an ROI issue, not a TCO issue).
Multiple-Based Estimation of Implementation Costs
The second way of estimating implementation costs is by using multiple software/subscription costs. It’s an easy way of estimating the implementation costs because the external or internal costs are not estimated separately. However, which multiple is chosen is, of course, of primary importance. If this information is not determined from projects, it must be triangulated from multiple independent sources, and of course, finding independent sources that will share this type of information is tricky. Brightwork Research & Analysis conducts interviews with a number of individuals with expertise, but people generally do not like going on the record when they report their implementation experiences.
How Various TCO Implementation Estimates Versus Brightwork Research & Analysis Estimates
In one example, the study What Managers Should Know About ERP/ERP II estimates ERP software license costs to be between ten and twenty percent of the overall TCO. That is significantly higher than the estimates at Brightwork Research & Analysis for ERP software, which show that the average cost across multiple software categories is approximately ten percent. We think this is because our TCO model is more comprehensive, and therefore, we have a higher “TCO” than the “TCO” produced by other entities. The book, Control Your ERP Destiny: Reduce Project Costs, Mitigate Risks, and Design Better Business Solutions considers a reasonable estimate of the ERP software costs to be twenty percent of the total project budget but states that software vendors tell their potential customers (as do consulting companies) that consulting costs will be roughly twice the cost of the software. However, these are only the external implementation costs and not the internal implementation costs. It seems strange that so many sources limit implementation costs to the consulting costs. It is well recognized that internal team members must always be assigned to enterprise software implementation projects for some percentage of their weekly hours.
Sometimes internal resources are pulled off their normal duties entirely, and one hundred percent of their time is assigned to the implementation project—this is very common on ERP implementations. However, on many other types of enterprise software implementations, internal resources share duties. One independent source, 180systems, estimates that consulting costs average sixty-five percent of the license costs (seventy-one percent for larger customers and fifty-nine percent for mid-sized customers). A meta-analysis and comparison of my individual TCO analyses are provided below.
The software vendors’ estimate of consulting costs being roughly twice the software cost holds for my sample (although you can also see considerable variability). However, this does not correlate with our estimations because other TCO estimations we have reviewed consistently underestimate the TCO applications. License costs are explicit costs and, therefore, the easiest to estimate, but they are also the easiest to overestimate concerning other costs. One source that does check out is E2BEnterprise. They provide an estimate, which is consistent with the independent estimation produced by Brightwork Research & Analysis. E2BEnterprise recommends a ratio of anywhere from 1:3 to 1:4 between software and consulting costs for ERP implementations. According to James Mallory of E2BEnterprise, SMB ERP implementations can be as low as 1:1 or 1:2 but only implement the bare minimum core system. This is common for companies that have a short window for implementation or tight budgets. But costs for a streamlined implementation provide for streamlined capabilities. Companies must continue to implement new modules and other areas of the system to gain significant efficiencies, and the result for a proper implementation will result in a total investment closer to 1:3 or 1:4 in the end—it just depends on when you make that investment—up-front or over the course of several years. Here are some important aspects to consider when evaluating TCO studies:
Item #1: Implementation Expenditures
The implementation expenditures for some software categories (for instance, ERP implementation projects) are consistently and significantly overbudget; however, ERP software vendors simply do not include going over-budget in their TCO estimates or, of course, in their project timelines. If the project goes over-budget, no estimate provided by a software vendor applies.
Item #2: The TCO for Failed or Delayed Implementations
What is the TCO for software that is never implemented or severely delayed? This is a confusing question to answer. I have interviewed for several projects that were re-implementations and have worked on a few. A re-implementation may occur if the software failed to go live—that failure may have taken place over the course of a year and a half. The company focuses on other things, and then two and a half years after it began the first implementation, it decides to re-implement the software. If the software is taken live the second time, this project will most likely have a negative ROI. No software vendor or implementing company wants to talk about these projects, but the historical (not hypothetical) implementation timelines must be incorporated into future projections. Anything less than this and the TCO calculation is being fudged to meet a predetermined outcome. If, depending upon the study used, between fifty percent (Barker and Frolick) and ninety percent (Scott and Vessey) of ERP implementations fail, and if the vast majority of ERP implementations miss their deadlines by significant durations, why are TCO estimates still based upon assumptions that do not include these very critical factors?
Item #3: Customizations
The study used between eighty-seven percent and ninety-six percent of ERP implementations includes moderate to extensive customizations. Customization results in high implementation costs, high continuous improvement costs, and high maintenance costs. Other software categories have various degrees of customization—almost always less than ERP—so ERP should receive the highest bump for coding-related implementation costs.
Training Costs
Training costs fall into several categories. Most software vendors either send the training out to the implementing company (if there is a sufficient number of company resources in the class). The implementing company sends its resources to the software vendor’s training facility. But this is not the end of the training costs. The salary costs of the people being trained must be included, as these people cannot do their regular work during the training. The formula that we use for this standard training model is the following.
Total Training Costs = The Training Cost Per Week + The Opportunity Cost Per Week
- The Training Cost Per Week = (Number of Employees Sent to Training × Vendor Charge Per Employee Per Week × The Number of Weeks)
- The Opportunity Cost Per Week = (The Number of Employees Sent to Training × The Hours Per Week × The Number of Weeks × The Fully
Loaded Hourly Rate the Employee Costs the Company)
Not all resources from the implementing company spend the same amount of time in training. Some resources are assigned to become resources, which means they take on some internal training and long-term support for the application. These “superuser” resources must be estimated at a higher level than normal users.
Integration Costs
Integration costs are simply included in the overall implementation costs because breaking out the integration effort is unnecessarily complicated—it is far simpler to estimate the overall implementation costs. Furthermore, many companies— SAP and Oracle come to mind—lead executives to believe that they will incur minimal integration overhead if they purchase one of their non-ERP applications to connect to the implementing company’s ERP applications; this is untrue. All SAP and Oracle’s applications sit on different hardware, and while they may have adapters, they are not actually integrated—they have different databases. (The term “integrated” is used colloquially to mean any connected systems, but most accurately, it means that the systems use the same database. When systems have adapters between them, they are not technically integrated.) Often the quality and ease-of-use of these adapters are inferior to the adapters written to connect best-of-breed applications to the ERP system.
Component #4: Maintenance Costs
Maintenance costs are the costs of keeping the application up and running after the go-live and are some of the most underestimated enterprise software costs.
These costs are comprised of both the yearly support fee and the internal labor costs of providing support.
Internal Maintenance Costs
Internal maintenance costs represent the allocation of internal resources to maintaining the application for its lifetime and are calculated with the following formula.
Internal Maintenance Cost = The Fully Loaded Resource Cost Per Year × The Average Allocation of Time to Support the Application × The Number of Years the Application is Used
The number of years an application is used is an estimate based upon the software category. Different software categories have different average durations of use in
companies. This is addressed shortly.
Vendor Yearly Support Costs
The vendor’s yearly support costs change depending upon whether the software is delivered as on-premises or SaaS. Support fees tended to be lower in the past. As software vendors learned that companies overemphasize their software purchase price versus other costs and have no idea how to perform TCO estimations, the vendors reduced the up-front costs and increased their support costs. For example, vendors have reduced their initial license fees and increased their support fees. Large ERP vendors have set twenty percent as the standard service fee, but a reduced rate can sometimes be negotiated for this service fee depending upon the vendor. With SaaS-delivered applications, the service fee is bundled into the yearly subscription, so there is no separate fee to calculate. Overall, this is one of the easier numbers to obtain from software vendors.
Total Years the Application Is Used By the Company
How many years the company will use the application is difficult to estimate. The following quotation, which was obtained from interviews on this topic (this source prefers to be anonymous), explains why:
“If the software works well—meaning good configuration and good training, along with a group of super users—an advanced planning application can be kept in use for seven to ten years. However, if a new CIO comes by, an application’s life can be only three to five years.”
There is really no perfect way to estimate this value, and it is difficult to know how long the application will be in use in the company. Furthermore, an application that does not work very well can be kept too long—often for political reasons— while an application that is working well can be replaced due to issues related to what happens to be popular at the time. We cover this in more detail in the article How to Estimate The Duration of Use for Software TCO.
Internal-Support Costs and Outsourcing
When reviewing Brightwork Research & Analysis TCO analyses, software vendors will typically respond that the internal support amount should be lower. Often they only estimate their own support costs, and when they do acknowledge the internal support costs, they will only estimate the internal IT resources required to support their application. While that approach was never accurate, it is even less accurate because companies are responsible for more “self-support” today than ever before. And this is, in part, due to the IT outsourcing trend. Outsourcing makes CIOs look great from the perspective of costs. However, in the vast majority of cases, we have reviewed, outsourced IT support means a reduced IT support level. Applications are utilized at a lower level, and problems take longer to fix. The major consulting companies produce most articles on this topic; as they have significant outsourcing businesses themselves, the information they provide is unreliable.
Furthermore, none of the major consulting companies have demonstrated that they are competent at performing IT support versus selling IT support. As clients, I have worked with the outsourced support mismanaged and the business unhappy with the support they receive.25 Essentially, outsourcing has made IT less efficient. While outsourcing may have resulted in fewer IT resources within companies, it has also meant negative externalities in the form of lower support that must be performed by the business. Therefore, the lowered costs (although at very high margins with little money paid to the workers providing the support—mostly in India) have not maintained quality levels. It is possible to imagine high-quality outsourcing, but while that may exist hypothetically, the reality of outsourcing is a movement to reducing costs while ignoring reduced quality. Therefore, the total cost of supporting applications is far greater than simply the costs of IT resources assigned to support the application.
Conclusion
As this article covers, there is a lot to understand when performing TCO calculations. Our TCO calculations are based on regression formulas that use many data points from implementations to drive the TCO calculation.