
How to Best Use the Product View, Planning Book and the Stock Requirements List
Executive Summary
- The Product View, the Stock Requirements List, and the Planning Book are the primary interfaces used to access APO.
- We cover the ECC Stock Overview and the Relationship between Product View and Stock Requirements List.
Introduction: The Primary Supply Chain SAP Interfaces
SAP has a minimal number of commonly used supply chain user interfaces. You will learn these user interfaces and how they compare to one another.
Our References for This Article
If you want to see our references for this article and other related Brightwork articles, see this link.
Notice of Lack of Financial Bias: We have no financial ties to SAP or any other entity mentioned in this article.
- This is published by a research entity, not some lowbrow entity that is part of the SAP ecosystem.
- Second, no one paid for this article to be written, and it is not pretending to inform you while being rigged to sell you software or consulting services. Unlike nearly every other article you will find from Google on this topic, it has had no input from any company's marketing or sales department. As you are reading this article, consider how rare this is. The vast majority of information on the Internet on SAP is provided by SAP, which is filled with false claims and sleazy consulting companies and SAP consultants who will tell any lie for personal benefit. Furthermore, SAP pays off all IT analysts -- who have the same concern for accuracy as SAP. Not one of these entities will disclose their pro-SAP financial bias to their readers.
The Comparable Views in SAP APO and ECC
SAP ERP and APS have similar views on the material status of locations, but they have different names.
- Product View for APO
- Stock Requirements List for SAP ERP
The Product View allows you to see what is due in and out of locations and to alter it, which is perfect for modeling. SAP always behaves as if it is a production system, however often you want to perform modeling.
Two Interfaces Into Similar Information
This is explained in the quote from the book Production Planning in APO.
“The product view is the central tool for requirements planning. It provides you with a complete overview of the requirements and stock situation for a location product and is therefore the APO equivalent to the stock requirements list in ECC…it contains most of the functionality of the receipts view, the requirements view, order processing and the pegging overview.
The product view shows the MRP elements of a location product in a table in a chronological sequence…you can read the entries for the quantity and date simulation like an accounting statement. Goods receipt and issues are identified by date, and you can see the expected stock quantity for ever date.
The SNP production horizon or the PP/DS horizon is displayed only in make-to-stock segments, because that is the only place where they are effective.
In the product view, planning is completed with the conversion of the planned orders or purchase requisitions into production orders and purchase orders. You can also perform this step manually from the product view for each planned order. For mass application, you can use a mass conversion.”
Goto transaction /SAPAPO/RRP3
 Each of the tabs has a wealth of information about the product and the location. The pegging tab shows the relationship between supply and demand or issues and receipts.
 The product master tab is a view of the product master the same as if you went to the product master itself.
 We can also create an order in the Product View, that is, you do not have to CIF orders over from ECC; they can be generated in APO and CIFed back over to APO. Orders can be entered as either negative or positive values.
Purchase Requisitions Created
A positive value results in purchase requisitions being created. (that is what we will show below). However, a negative value can be entered in the order as well, and this becomes a forecast quantity.
 However, we could will also later enter a negative value as an “order.”

 You can see how the negative and positive values show in the Product View. (hint we entered two positive orders for a quantity of 4).
 Here you can see the single negative order, which is a Forecast Requirement, and the two orders for four, which become purchase requisitions. There are negative and positive values in this Product View. However, the early values were initiated by ECC. The later ones from within APO (through the create order function on the product view).
Thus the positive values are Purchase Orders when initiated by ECC, but Purchase Reqs when initiated by APO. The negative values are Sales Orders when initiated by ECC, but Forecast Requirements when initiated by APO.
This makes sense because the orders need to be solidified by migrating back to ECC. When initiated from within APO, they have planned orders, and a Forecast Requirement and Purchase Requisition is a planned order.
Setting the Propagation Range
We can also review the requirements strategy from the product view by selecting the strategy button to the upper left.
 We can change the propagation range.


There are many options and places to branch from within the Product View as these menu options show.
Review SNP Heuristics

One of the most important things you can do is run the plan from the Product View. You can review the Heuristics by selecting Heuristic settings off of the Settings menu.
 By navigating to Change under “Interactive Planning” on the menu, we receive some new options.
 We will select the Product Heuristic button.
 This will take you to the heuristic selection screen. We will choose the lot for lot.

You can also select the Variable Heuristic button where you will be taken to this screen. (see our post on Heuristics to learn about the different types)
 There are some options in the Basic Settings tab then can be selected. This includes planning with shelf life, considering shortages outside of the PPDS horizon, among many others.

We execute the heuristic (in this case, the Planning with Standard Lots heuristic) by selecting the Heuristic button. (not by choosing the green check button). After we receive the message that it is complete, we can hit the save button to save the planning results. We can then go and select the back button to see the results of the mini planning run.
 ECC Stock Overview
The ECC Stock Overview is similar to the Product View.
 The most applicable transaction to the SCM Product View in SAP ERP is the Stock Requirements List. (MD04)

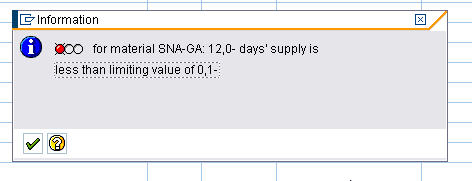
The Stock Requirements List (STL) has an interesting feature. It allows you to show the status of the location. This is brought up by selecting the Overview Tree button.
As you can see below, we have a red traffic light at this location. This is helpful because the order we created on the SCM side did not come over.

We find that this is a specific error. The location lacks a sufficient number of days supply.

The Relationship between Product View and Stock Requirements List
These two transactions are primarily the same view onto a location/plant. Therefore, one basic test is if they show the same values.
The Enhanced User Interface Capabilities of APO
External planning systems will always have better user interfaces than the ERP system. Planning is only one aspect of what an ERP system does, while planning is the only thing an external planning system does. Therefore, a divided strategy will result in planners spending more time using the system with a weaker user interface. Compare the Stock Requirements List (which is a view in SAP ERP) with the Product View, which resides in SAP APO. I have inserted screenshots of both views below and on the following page:
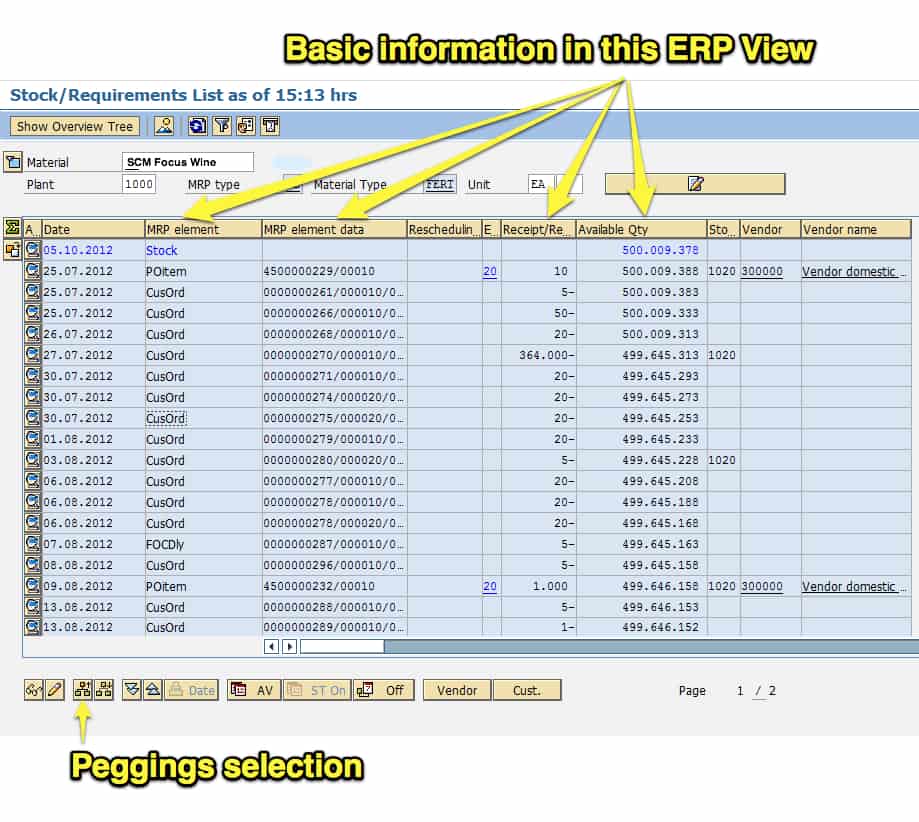
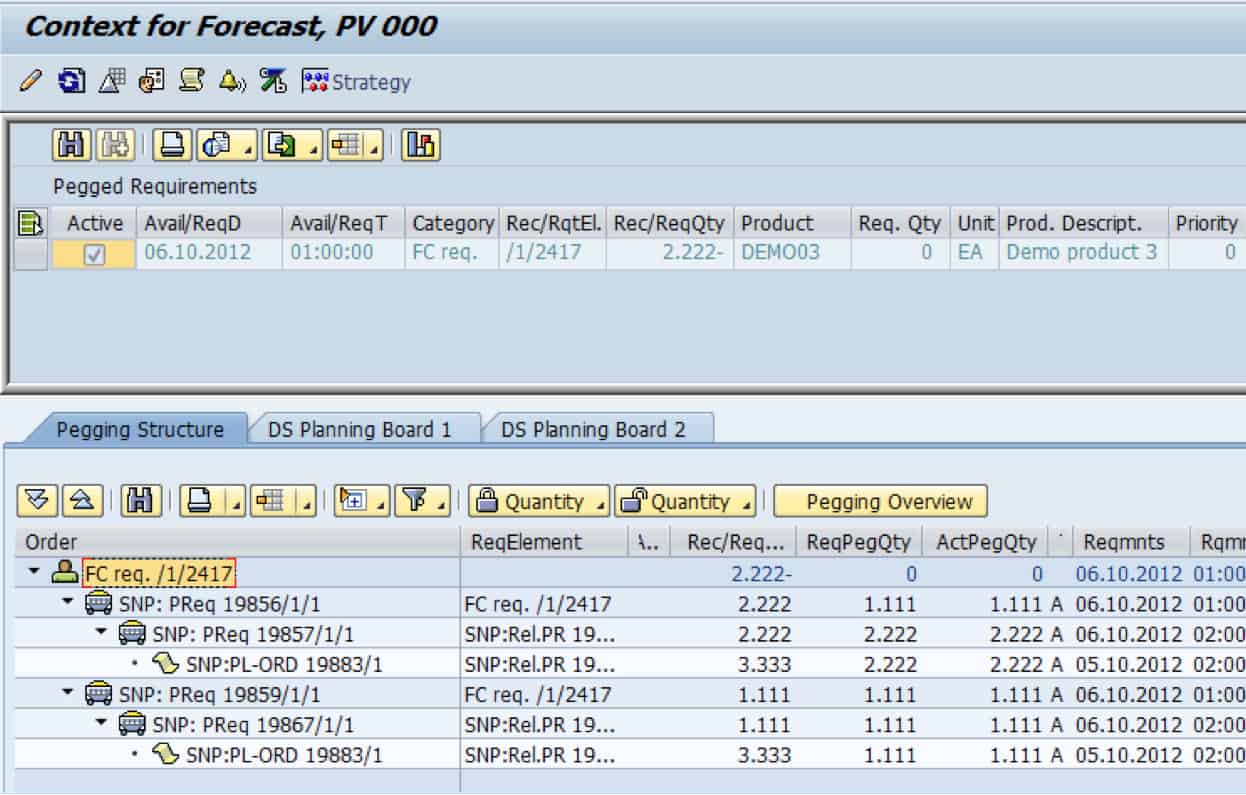
Both of these views provide similar information, but the Product View is much more powerful and multifaceted. (Although it’s not an elite user interface design, it is simply much better than the similar view in SAP ERP). SAP APO has something that SAP ERP does not have: the Product View can show more detail on peggings. A “pegging” is a connection between a supply element and a demand element. While pegging is a single connection between demand and supply, a chain of peggings can show the link between a purchase requisition at the end of the supply network and a sales order or forecast at the very top of the supply network.
Reporting Implications
Very simply, it is more expensive and more complicated for a company to pull extracts from two systems rather than one. Also, fewer reports are necessary for one system. With two systems, the number of reports required to provide the organization with an overall picture of the plan is higher, as data must be extracted and reported on from both systems. With one system, some of the reporting requirements can be met by only using the user interface of the external planning system.
For instance, when I want to view total system inventory in SNP, I can create a selection profile for all products at all locations in the planning book (easily done with a wildcard). And I can view the overall system inventory by planning bucket for the entire planning horizon.
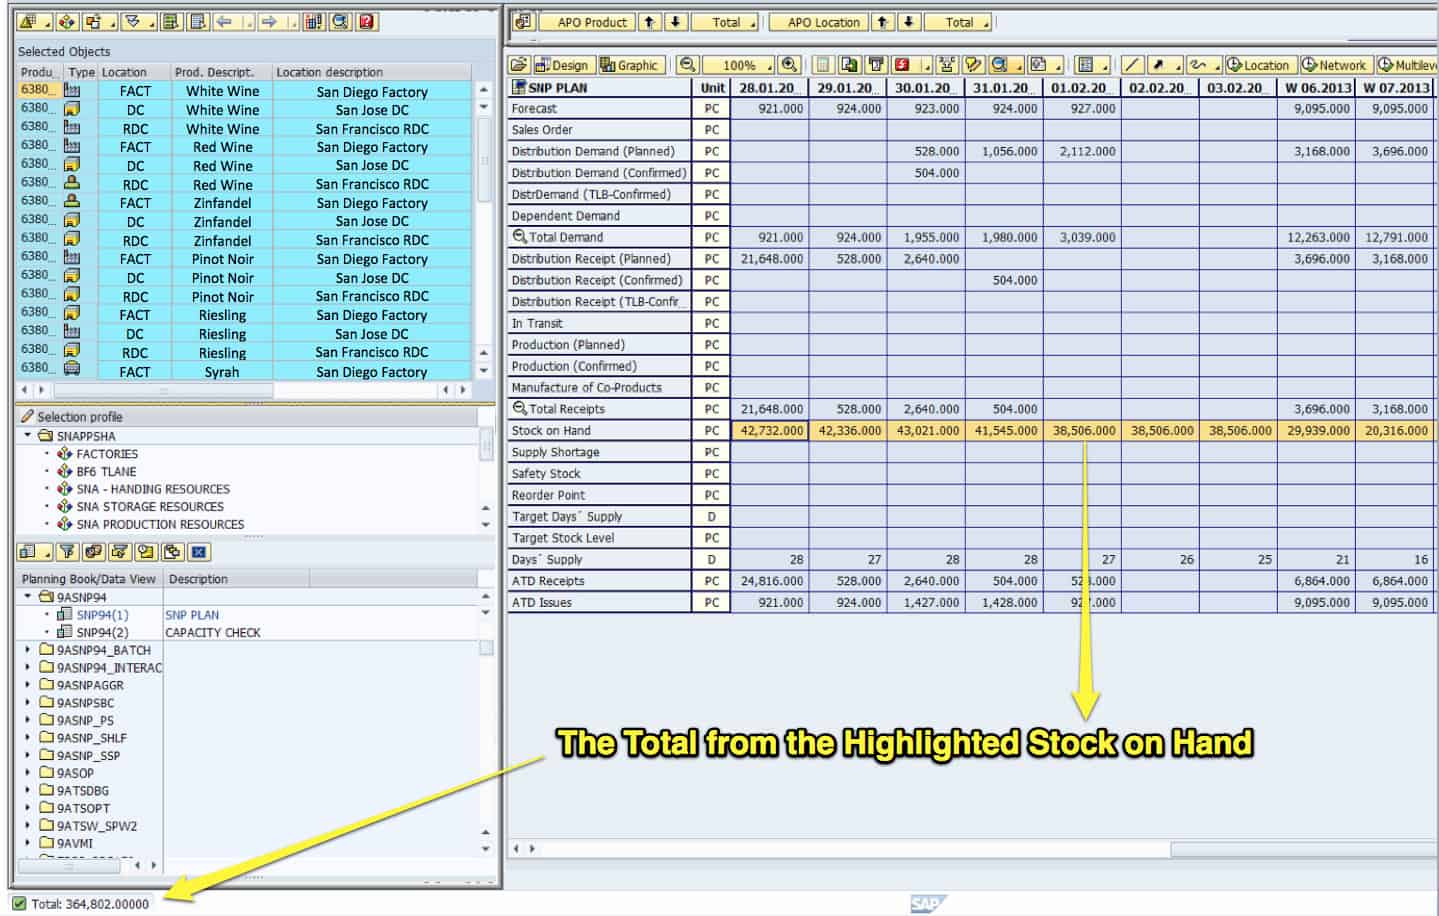
As you can see, by selecting all product-location combinations in the selected objects in the upper left pane, you can see the aggregation of key figures to the spreadsheet at the right. This aggregation is for the entire supply network; however, I can show any aggregation subset that I wish by adjusting the selection profile. I can also select one key figure, as I have with the Stock on Hand key figure, and with a right mouse click, I can choose to sum all of the values that I have selected. On the bottom left of the screen, the value will be summed.
When doing this, the options are:
- Total
- Mean Value
- Maximum
- Minimum
- User-Specified Function
- Number of Filled Cells

With one key figure selected, a graphic can be shown by right mouse clicking and selecting graphic. SAP creates a rudimentary graphic, which can be used to find issues more quickly than looking at a row of values.
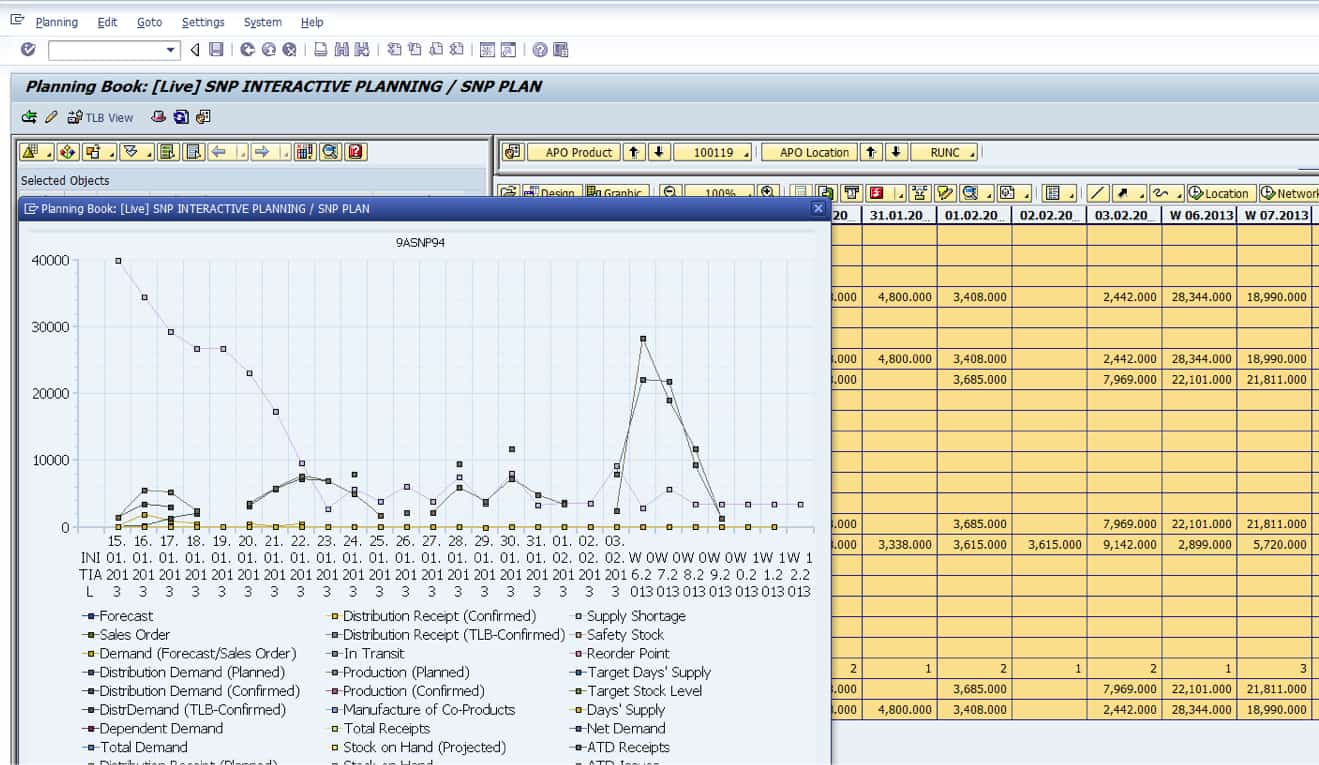
Here multiple key figures are selected for the entire planning horizon.
A split approach will only give me the inventory for products planned in SAP APO. I then have to figure out how to do an inventory report in ERP, and then add up the two values to arrive at the total system inventory. I would then need to do it for the exact planning bucket for which I wanted to find inventory information. Even this simple example means more work. A split strategy will require that more reports be written. An additional problem for many companies is that they use SAP Business Warehouse (BW) as their reporting system, and BW reports have a habit of showing up late. I have yet to see BW reports that appear within six months of the APO go-live, and they typically trail the APO implementation by over a year.