
What is a Forecasting Method?
Executive Summary
- Understanding a what is a forecasting method is critical to understanding statistical forecasting.
- We cover how to differentiate a forecasting method from a model.
Introduction
The question of what is a forecasting method is a relatively common question around forecasting. For this article, we will limit our topic of statistical forecasts.
See our references for this article and related articles at this link.
Most statistical forecasts, in developed countries at least, are generated by systems. Forecasting methods is the broader term that is used to describe the statistical approach that is used to produce the forecast.
Let us review several methods.
The Question of What is a Forecasting Method?
The answer the question of what is a forecasting method it is important to know what is the term forecast method can be used very generally to mean any way of creating a forecast. However in most cases, when the term forecast method is used, it means the different ways of creating a statistical forecast.
Some Foundational Statistical Forecasting Methods
To answer the question of Let us review some foundational statistical forecast methods.
- A two or three-period moving average.
- A level (a many periods moving average).
- A trend, with a specific percentage increase month year.
- A seasonal, with a repeating factor.
Notice, the method tells you how the forecast will be generated (based on taking sampled parts of the univariate sales history — where the term statistical comes from).
But it does not tell you the specifics. That is if we use a level method, which, as can be seen means using many periods, it does not say how many periods. When the specifics or the parameters of the forecast method are set, then that is called a forecast model. A single method, say a level forecast, can have an unlimited number of forecast models, based upon changes to the parameters. Even with a straightforward method, which has only one parameter, using two periods is one model, three periods a second model, four periods a third model, and so on.
Declaring Forecast Models
Let us look again at several forecasting methods, and then show how they are converted into forecasting models.
- A Level Forecast
- A Moving Average Forecast
- A Level Trend Forecast
- A Seasonal Level Forecast
- A Level Trend Seasonal Forecast
The following table is taken from an actual client and notice the high number of parameters, that provide for variations within each method.
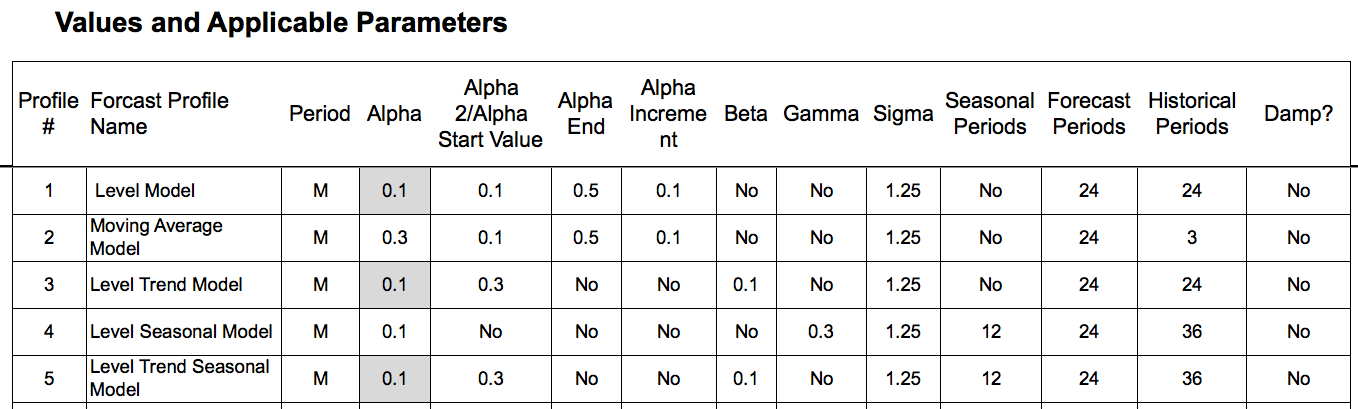
If we were to copy any of these forecast models and change one parameter, we would have a second model, but they would use the same method. We cover parameters in great detail in the book Setting Forecast Parameters in Software: Alpha, Beta, and Gamma.
To see the full screen just select the lower right-hand corner and expand. Trust us, expanding makes the experience a whole lot more fun
Conclusion
Eventually, a forecast model must be applied to a product location combination because the parameters must be selected for the forecast method to be functional. Different product location combinations may go out on the same method, but with more models.
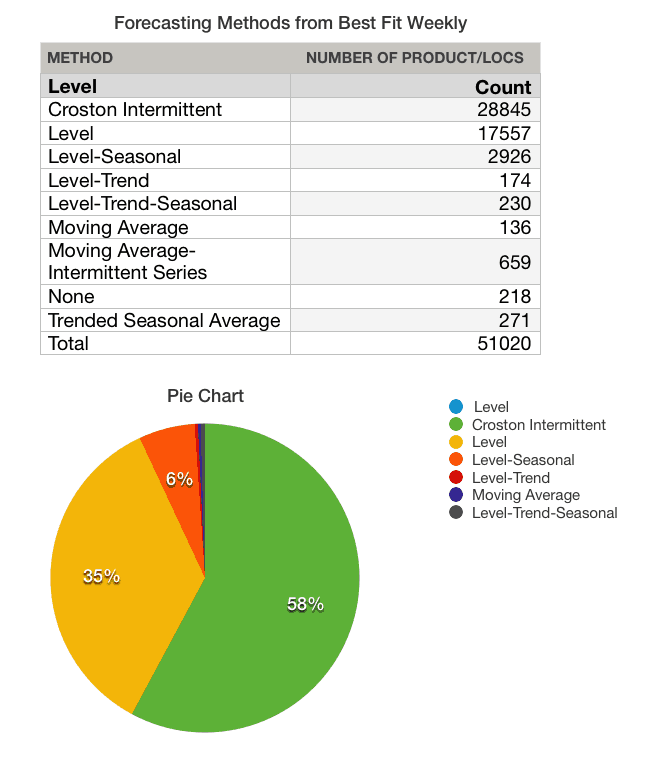
Observe the assignment between the product location combinations and the forecast methods. This graphic and table show the assignment of methods, even though the specific models within each method are not the same as one another.
The way to determine the right model to assign to the product location combinations is by comparing the historical forecast accuracy. In some cases, models that have a higher forecast accuracy are more appropriate to apply to a product location, as merely using the lowest forecast error in all circumstances is called “overfitting.”
It is the position of Brightwork Research & Analysis that the number one factor holding back the better assignment of forecast models to product locations is the lower ability of companies to perform effective forecast error measurement and analysis.
A More Straightforward Approach to Forecast Error Calculation
Observing ineffective and non-comparative forecast error measurements at so many companies, we developed the Brightwork Explorer to in part, have a purpose-built application that can measure any forecast and to compare this one forecast versus another.
The application has a very straightforward file format where your company’s data can be entered, and the forecast error calculation is exceptionally straightforward. Any forecast can be measured against the baseline statistical forecast — and then the product location combinations can be sorted to show which product locations lost or gain forecast accuracy from other forecasts.
This is the fastest and most accurate way of measuring multiple forecasts that we have seen.