
How to Understand What is an Outlier in Forecasting
Executive Summary
- Outliers are easily identified in applications, but the question is how to deal with them.
- The questions to ask regarding when outliers should be removed.

Introduction
The question of what an outlier is and what outlier removal is always a topic of keen interest in forecasting projects, which is why having a specific outlier definition is helpful. In this article, you will learn what an outlier is and what standard approaches are for dealing with them.
Our References
See our references for this article and related articles at this link.
What is an Outlier?
An outlier is a data point in history that diverges from the other data points. An outlier can either be overly high or overly low compared to the other data points in the time series.
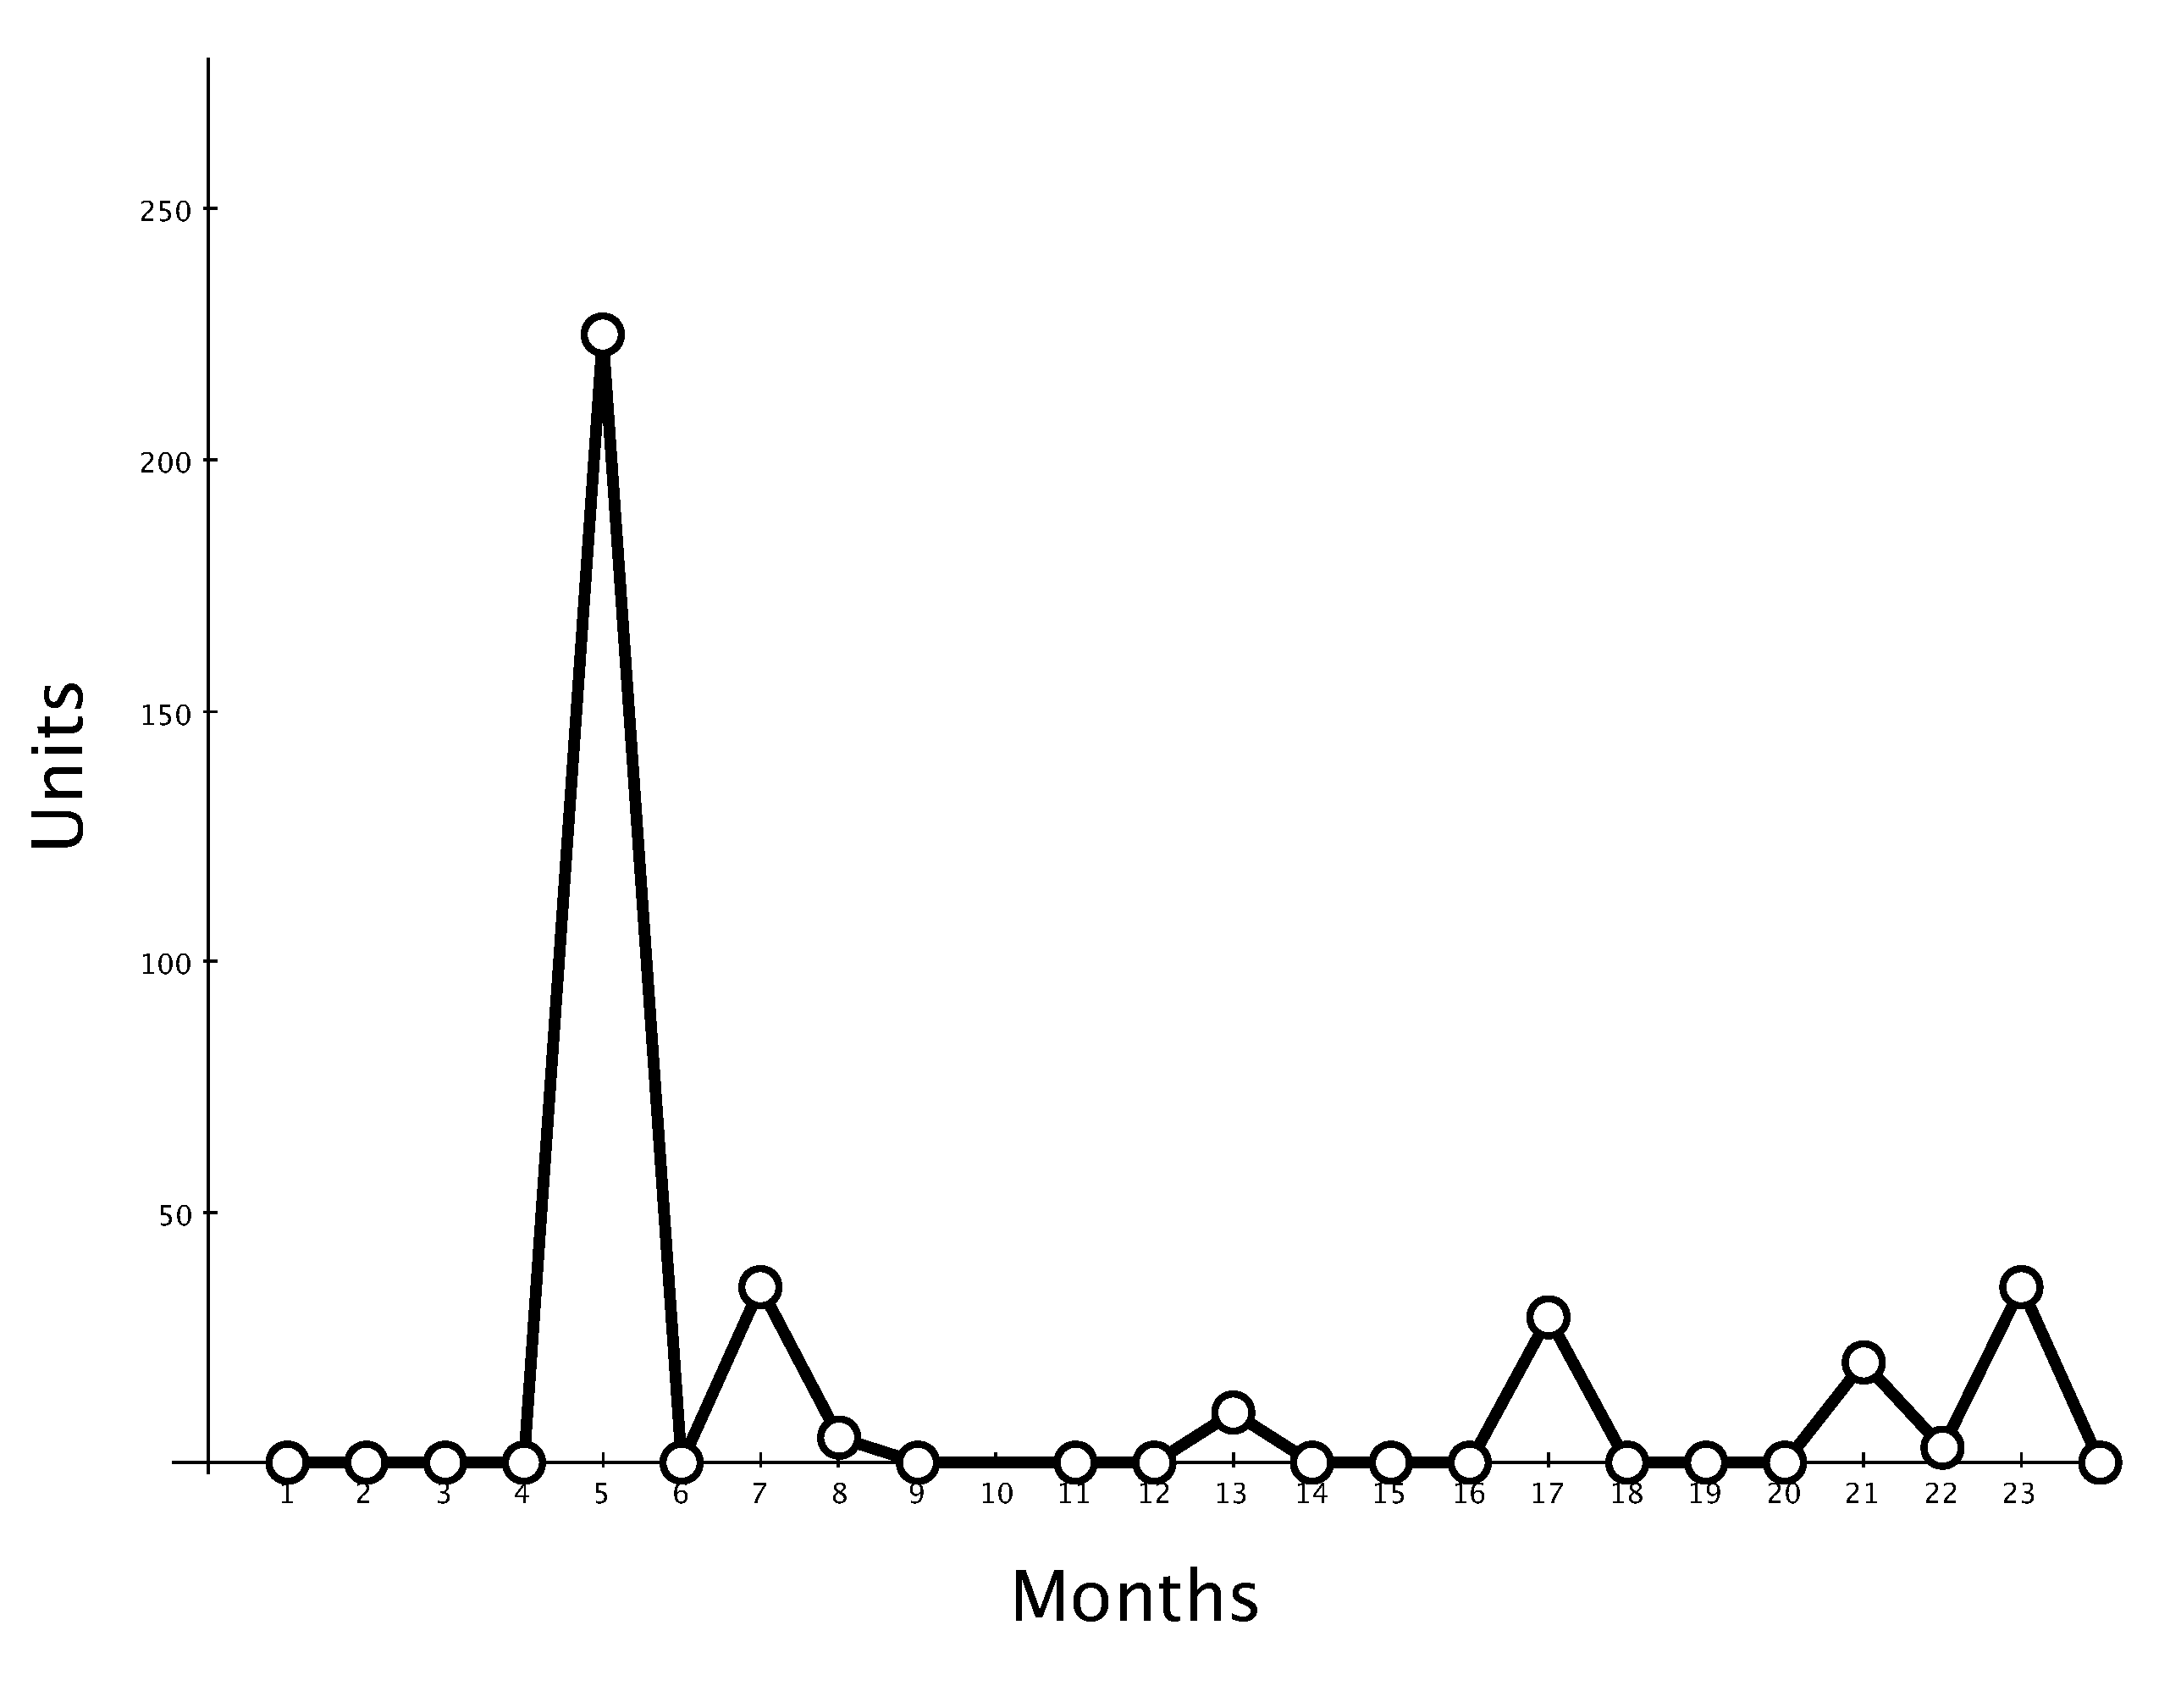 In this time series, the apparent outlier would be for period 7. Outliers are easy to identify either graphically or through calculation.
What is an Outlier in Forecasting Software?
Almost all supply chain forecasting applications have a way of setting the outlier detection.
- The outliner notification is usually set by the number of standard deviations away from the mean to say what is an outlier.
- Some forecasting applications auto-remove the outlier above the defined number of standard deviations.
- Other forecasting applications will only identify the outlier for the user but not remove it when creating the forecast.
Outlier Remedy
Outlier Removal: Outlier removal is a fascinating and controversial topic that should be even more controversial than it is. This is particularly true considering that it is a superior technique for falsifying forecasts. Outlier removal is the removal of historical data points that are at variance with the other historical data points.
Most statistical demand planning applications have a field for outlier identification or removal.
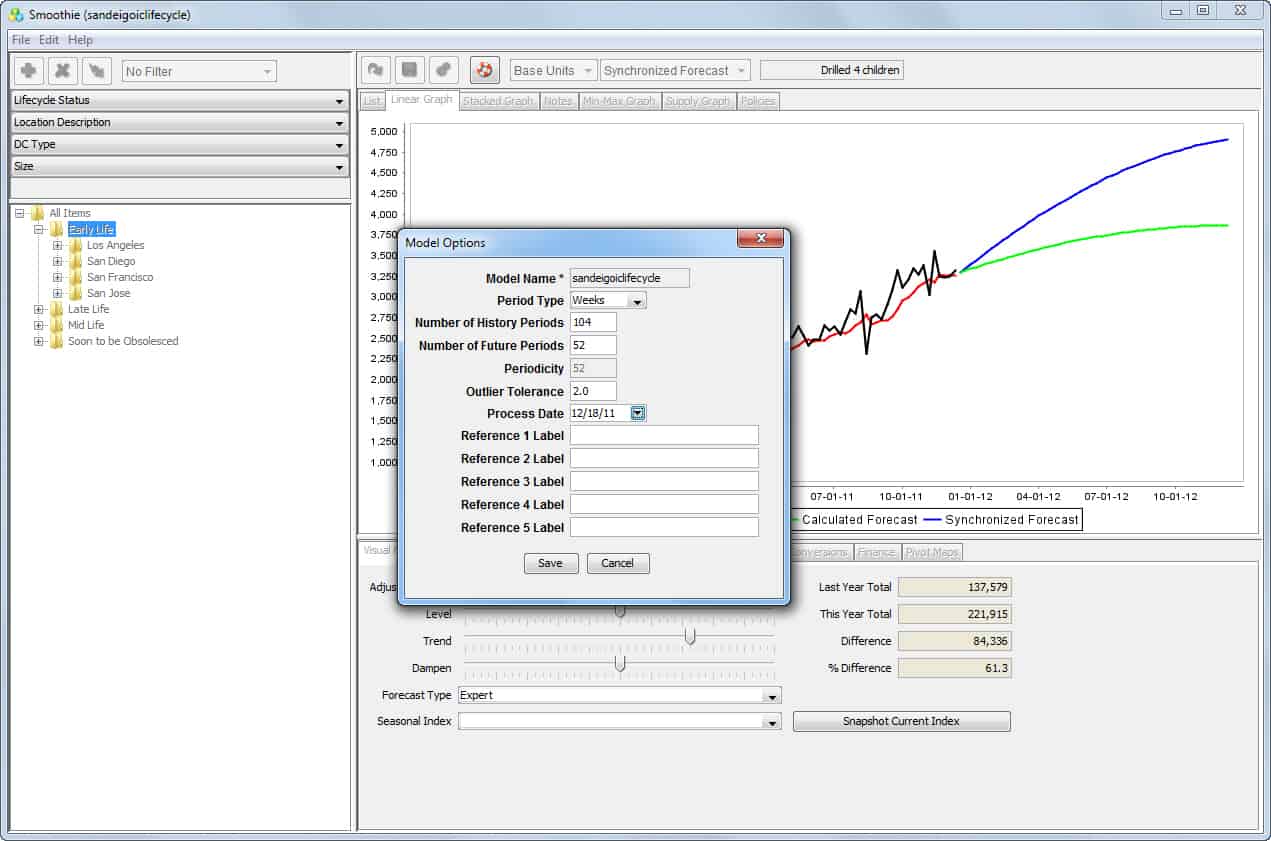
One example can be seen on Smoothie’s Model Options screen.
- Typically, people on the project will recommend the removal of outliers from the previous demand history.
- This is often an issue that confuses many people. The rule on outlier removal is relatively simple. If the outlier in question has a high probability of repeating in the future, the outlier should not be removed.
- Automating outlier removal is more complicated than is often initially guesstimated. This can be performed by using the TRIMMEAN function in Excel. This removes outliers in a controllable fashion by testing the forecast accuracy before and after the function is used.
The Issues with Outlier Removal by the Army Corp of Engineers Before Hurricane Katrina
Outlier removal was a primary reason for the results of Hurricane Katrina. This is because the Army Corp of Engineers removed storms of a much worse level than Katrina when they performed the initial planning. This was done deliberately to develop a standard of levee construction. It was interested in building (and then added further incompetence by not building to that standard).
Removing outliers contains considerably less intrigue in supply chain forecasting than in finance, medicine, and food additive testing. However, this is only because the supply chain organization only uses the forecast internally.
- Forecasts consumed internally tend to have less bias than those produced for external consumption. This is because there is less incentive to provide a forecast that the forecast’s customers will positively receive.
- It is a general rule that internally used forecasts tend to be more accurate than forecasts produced for external consumption or sold.
- However, while internally consumed forecasts are “better” and more reliable than externally consumed forecasts, there are still many problems with the internally reported accuracy measurements of forecasts that the forecasting department reports to the rest of the company.
Outlier Management in Demand Planning Systems
The system can easily tag outliers and can be removed in a way that does not alter the actual demand history loaded into the model. Instead, it is stored in a separate row along with another measure—the adjusted history. The forecasting system then forecasts using the adjusted history, and in that way, the actual history and adjusted history are kept separate.
Outlier Management in Demand Works Smoothie
In Demand Works Smoothie, outliers can be identified based on the number of standard deviations away from the mean. The higher the standard deviation, the higher the tolerance is set for outliers. However, the application Demand Works Smoothie does not remove outliers based on this selection; instead, it merely identifies them for the planner.
Outlier Management in JDA DM
JDA DM will also identify outliers in the interface. Exactly how this appears is shown on the following page:
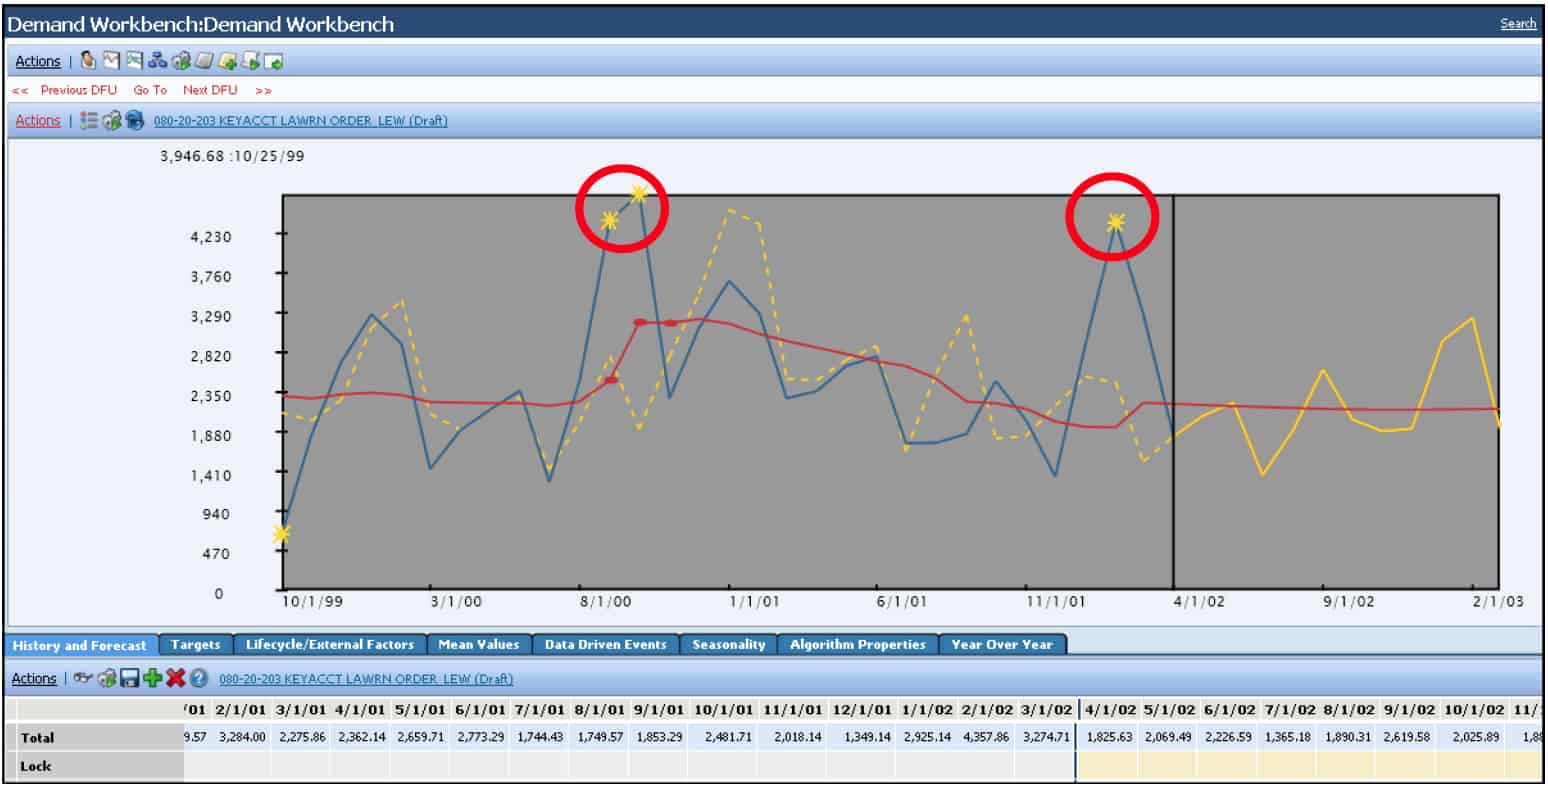
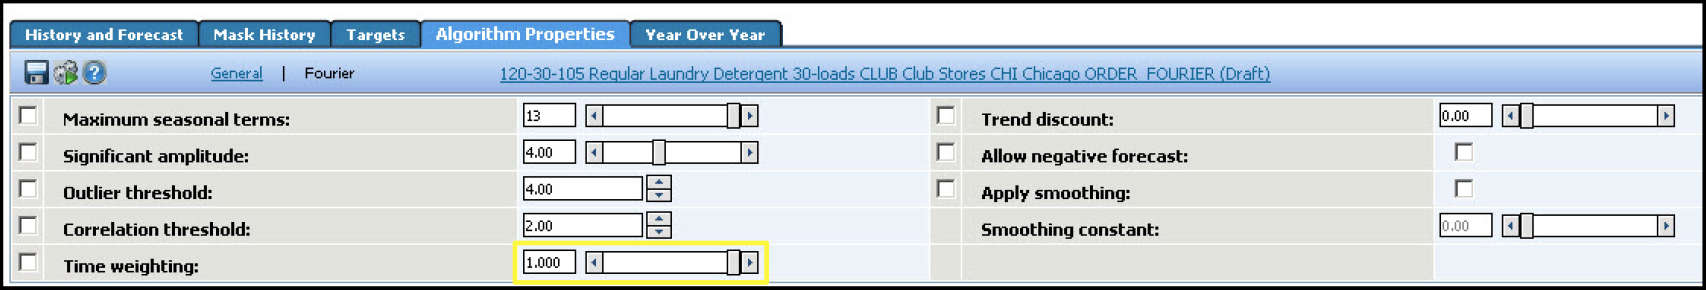
In JDA DM, the yellow stars in the interface identify the outliers. Outliers can be observed as high or low points, but the identification with a graphical element (a star in JDA’s case) is a good practice so that the planner can see when their outlier threshold is exceeded. The outlier threshold is set below:
Determining Whether Outliers Should be Removed
Outlier identification is easy; outlier removal is where the real work begins. Outlier removal requires planners with domain expertise to decide whether the outlier should or should not be included in the demand history for forecasting. This requirement for judgment based on domain expertise is one reason why automatically removing outliers based on their distance from a mean value is not a good practice. Historical data periods can be far from the mean and still be valid data points for creating a forecast.
The Problem with Forecasting Outlier Removal and Outlier Analysis
Typically, people on the project will recommend the removal of outliers of the previous demand history. This is often an issue that confuses many people. The rule on outlier removal is relatively simple. If the outlier in question has a high probability of repeating in the future, the outlier should not be removed.
In this article, we will cover outlier analysis and outlier removal.
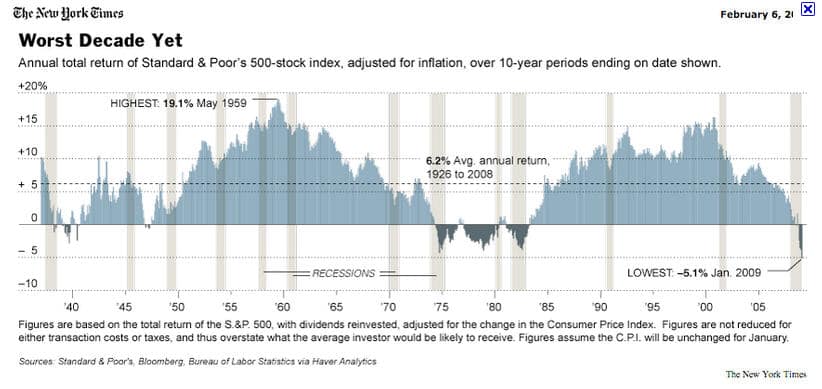
A finance firm that wants to provide an overestimate of the stock market return would remove the period from roughly 1975 to 1983 and begin counting from 1983.
Outlier Meaning
Outlier removal is always a topic of keen interest in forecasting projects, which is why having a specific outlier definition is helpful.
An outlier is a data point in history that diverges from the other data points. It can either be overly high or overly low compared to the other data points in the time series.
In this time series, the apparent outlier would be for period 7. Outliers are easy to identify either graphically or through calculation.
Outlier Meaning in Forecasting Software
Almost all supply chain forecasting applications have a way of setting the outlier detection, which is set by the number of standard deviations away from the mean. Some forecasting applications auto-remove the outlier above the defined number of standard deviations. Other forecasting applications will only identify the outlier for the user but not remove it when creating the forecast.
Outlier Remedy
- Typically, people on the project will recommend removing outliers from the previous demand history.
- This is often an issue that confuses many people. The rule on outlier removal is relatively simple. If the outlier in question has a high probability of repeating in the future, the outlier should not be removed.
Financial Recommendations, Scientific Testing, and Disaster Preparation
Outlier analysis is often used by those who are interested in telling a different story than what is derived from the data.
The financial industry frequently performs misleading outlier removal to mislead investors into placing their bets on things that are far less stable than they think they are.
A perfect example is a return on the stock market.
- To drum up interest in the stock market, investment “professionals” will often list the stock market return beginning from a particular point in time. They do not mention that the stock market went through a significant correction just before that point in time.
- When pressed on this point, the investment professional, surprised anyone saw fit to perform independent research, will state that the time in question is an “outlier” or “one-time” event. Therefore, he will propose removing it from the overall calculation.
Outlier Analysis and Remove in Research
If investors had been invested at that time, they would have suffered a decline. Outlier removal has also been used to falsify research results. For instance, Aspartame (more conventionally known under the brand name NutraSweet) was only able to make it through FDA approval because rats who were given NutraSweet and were observed to have large tumors were removed from the sample.
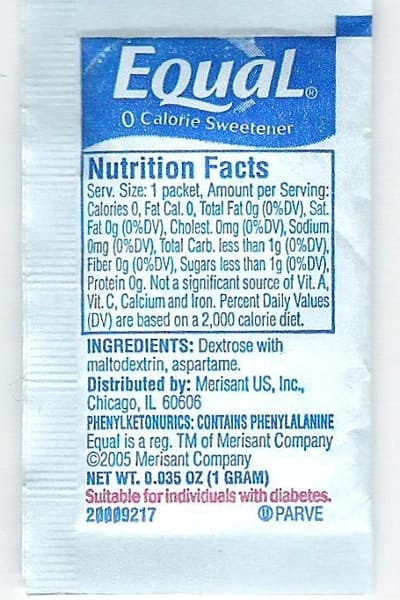
Aspartame could not have been approved without the removal of “outliers.”
NutraSweet is just the tip of the iceberg in misleading outlier removal submitted to the FDA. Pharmaceutical trials remove patients with such adverse reactions that they drop out of the study. Uncounted, they adversely impacted do not show in the study. The list of biased outlier removal goes on in pharmaceutical clinical trials. It is simply too easy to remove outliers to manipulate the data to the desired results. This is one reason one must be so careful with outlier removal.
Outlier Removal and The Disaster that Followed Katrina
The official story often provided by the government at the time and by the Corps of Engineers regarding Katrina in 2005 is that the storm was an “un-forecastable” event. This is a common statement made by politicians seeking to dissipate criticism of incompetence. Katrina was easily forecastable. However, the following quotation describes how the Corps of Engineers removed “outliers” in storm history and cherry-picked storm history to develop a lower standard for storm defense than was necessary.
“The flood protection system was first authorized by Congress after Hurricane Betsy flooded the city in 1965, and it was supposed to protect the area from the kind of storm that would come only once in two centuries. It was expected to take about 13 years to complete and cost about $85 million, according to a history by the Government Accountability Office.
When Hurricane Katrina hit New Orleans 40 years later, the system was still not finished, and it had already cost $738 million. In the eight months since the storm, the Corps of Engineers has spent some $800 million in direct costs to repair the system — $62 million more than it had cost in the first place.
The main tool used to design the system was a fiction — a hypothetical storm called the “standard project hurricane.” The corps began developing the model with the Weather Bureau in 1959. The idea, as the corps has put it , was that the model would represent “the most severe storm that is considered reasonably characteristic of a region.”
The report by Professor Seed’s group found that the creators of the standard project hurricane, in an attempt to find a representative storm, actually excluded the fiercest storms from the database.
Storms like Hurricane Camille in 1969 were taken out of the data set as lying too far out of the norm; the Berkeley researchers noted that “excluding outlier data is not appropriate in the context of dealing with extreme hazards.” Also, the calculations of the cost-benefit ratio did not take into account the costs of failure, both economic and social, far greater in an urban area like New Orleans than a rural one.”
Forecasts Created by the Corps of Engineers
The forecast created by the Corps of Engineers radically differs from the country considered the world leader in water management, the Netherlands.
“The Netherlands has built flood protection to withstand surges that might be expected every 10,000 years.”
Removing storms that seem “too large” is a very strange decision.
Why would a storm of this level not repeat itself? This is a simple example of outlier removal that is massaged to meet an already existing conclusion. This is consistent with human nature, which is to develop the conclusion and then arrange the data around it. The Corps of Engineers’ forecasts were severely mistaken, as was their work. Their decades of waterworks projects in New Orleans they have left the city unable to withstand a Category 3 hurricane that hit landfall in Mississippi, not even Louisiana. The Corps of Engineers has proven itself incompetent, a feature of institutions that fake forecasts. False forecasts underlie institutions that cannot tolerate reality internally; therefore, they fake information to create the reality they like.
How One Leading Forecasting Vendor Describes Outlier Analysis and Removal
Those who have read this blog previously will know that I frequently discuss a very easy-to-use and powerful forecasting application called Demand Works Smoothie. The Smoothie user manual has the following to say about outlier removal.
“History Adjustments: Check for outliers using the filter selection above the navigation tree. Some outliers will be repeatable, unknown events. It’s not worth making adjustments for these items since doing so will falsify and minimize real demand variation. Another excellent practice is to borrow history from similar items for new products. History adjustments do not carry upwards as you work with aggregations, since aggregations sum actual history, so you do not need to worry about double-counting demand.” – Demand Works User Guide
Model Effectiveness For Outlier Analysis
Aside from abuse, Michael Gilliland points out that outlier removal overestimates any forecast model’s predictability.
“An outlier is an observation that is well outside the range of expected values, such as extremely high or extremely low sales in a given week. While it is convenient to ignore outliers in the model construction process, this can lead to unwarranted overconfidence in the model’s ability to forecast. Outliers tell us something that shouldn’t be ignored — that behavior we are trying to forecast is more erratic than we would like it to be. These kinds of extreme data points have happened in the past, and we are foolish to think extreme data points won’t happen again in the future.”
This leads into much of the work of Nassim Nicholas Taleb, author of the book The Black Swan, where he describes that strong natural human tendency to ignore (or remove as outliers) the impact of highly improbable events. He states that companies that perform financial forecasting remove unlikely events from their forecast models, and this reduces the forecastability of the model but also makes the financial system much less robust. Taleb’s approach is the opposite, which this Amazon reviewer describes.
“In one of the many humorous anecdotes that seem to comprise this entire book, Taleb recounts how he learned his extreme skepticism from his first boss, a French gentleman trader who insisted that he should not worry about the fluctuating values of economic indicators. (Indeed, Taleb proudly declares that, to this day, he remains blissfully ignorant of supposedly crucial “indicators” like housing starts and consumer spending. This is a shocking statement from a guy whose day job is managing a hedge fund.) Even if these “common knowledge” indicators are predictive of anything (dubious – see above), they are useless to you because everyone else is already accounting for them. They are “white swans,” or common sense. Regardless of their magnitude, white swans are basically irrelevant to the trader – they have already been impounded into the market. In this environment, one can only profitably concern oneself with those bets which others are systematically ignoring – bets on those highly unlikely, but highly consequential events that utterly defy the conventional wisdom. What Taleb ought to worry about, the Frenchman warned, was not the prospect of a quarter-percent rise in interest rates, but a plane hitting the World Trade Center!”
Of course, supply chain forecasting is not attempting to compete with other groups fighting to make a profit, so the intent of the forecast is different. However, it is interesting that while the most standard approach is to remove outliers, Taleb’s approach is to keep them in and to build a trading strategy that focuses on them.
Taleb goes on to say the following in this area:
“First, it is an outlier, as it lies outside the realm of regular expectations, because nothing in the past can convincingly point to its possibility. Second, it carries an extreme impact. Third in spite of its outliers status, human nature makes us concoct explanations for its occurrence after the fact, making it explainable and predictable.”
Here, he describes that it is a natural human inclination to remove outliers from our historical record.
Outlier Identification
Demand Works, as with other forecasting applications, can identify outliers through a simple parameter set high or low (as measured by the number of standard deviations from the series mean). However, this is only for reporting; the outliers are still counted for the actual forecast. The outlier can then be reported upon and receive attention from the planner.
Conclusion
The central premise of outlier removal is that one-time events should be removed from the demand history to prevent them from being used to produce a forecast biased by events that will not be repeated. One should be very careful when removing outliers from forecasts, particularly when evaluating research where outliers have been eliminated, as this is a telltale sign that the research has been manipulated.
The determination of what is and what is not a one-time event is often a sea of disagreement, even among different individuals with the same amount of domain expertise.