How Do You Calculate a Forecast?
Executive Summary
- Calculating a statistical forecast is far more straightforward to create than is often thought in practice.
- We cover the calculation of the forecast and what it means.
Introduction
How do you calculate a forecast is a common question that we receive. Because statistical forecasts, in developed countries at least, are generated by systems, it is easy to get away with not knowing how do you calculate a forecast yourself. This means its easy to lose touch with how do you calculate a forecast.
See our references for this article and related articles at this link.
Having spent a great deal of time recreating the various forecast methods, it is curious how must the forecast methods tend to be overstated. That they are often explained in ways that tend to overstate the complexity of the outcome.
Issue #1: Overemphasis on Complexity
We have identified the overemphasis on complexity as one of the significant factors limiting the potential of forecast improvement in the article How Can Forecast Error Be Reduced?
Companies that try to improve their forecasting will often get taken advantage of by either a vendor or a consulting company. What typically happens is the consulting company or vendor makes promises around the complexity that are overstated. This is very much based upon what is called asynchronous knowledge. It means taking advantage of the fact you know something someone else does not know. And this is why the technique is used so often with things that are complex. Forecasting has a bunch of items that are made more complicated than they need to be, one example we cover in the article How to Make Sense of the Natural Confusion with Alpha, Beta, and Gamma.
Currently, the most significant exaggerated claims tend to be around AI/machine learning, which at this point has become farcical. We have been tracking some of these claims, as we cover in the article The AI, Big Data and Data Science Bubble and the Madness of Crowds. Much of what companies like IBM or CapGemini are promising related to AI is not new. And many of these companies have little in the way of AI/machine learning success themselves. IBM famously failed with Watson, as we cover in the article How IBM is Distracting from the Watson Failure to Sell More AI.
It is evident to us that most of the claims will not come true, and clients that believed these claims would be forced to cover up their flawed investments as we cover in the article The Next Big Thing in AI is to Excuse AI Failures.
When so much has been invested, with so little output, the results must be hidden.
How Do You Calculating a Forecast
While little discussed, effective good forecasts can be created using elementary methods.
Four of the most common forecasts include the very recent history, a long term average, a trend (either rising or declining), and a seasonal, which is a repeating pattern.
See the examples.
- A two or three-period moving average.
- A level (a many periods moving average).
- A trend, with a specific percentage increase month year.
- A seasonal, with a repeating factor.
All of these are easy to create in Excel, or in R (which allows for automation).
And while they are not as sophisticated as ARIMA or other models, they usually work pretty well. And the long term evidence is that sophisticated forecasting methods tend to have little incremental benefit over more simple methods.
Additionally, with many of the statistical forecasting methods, parameters are adjusted to allow for customization of the forecast for the demand history.
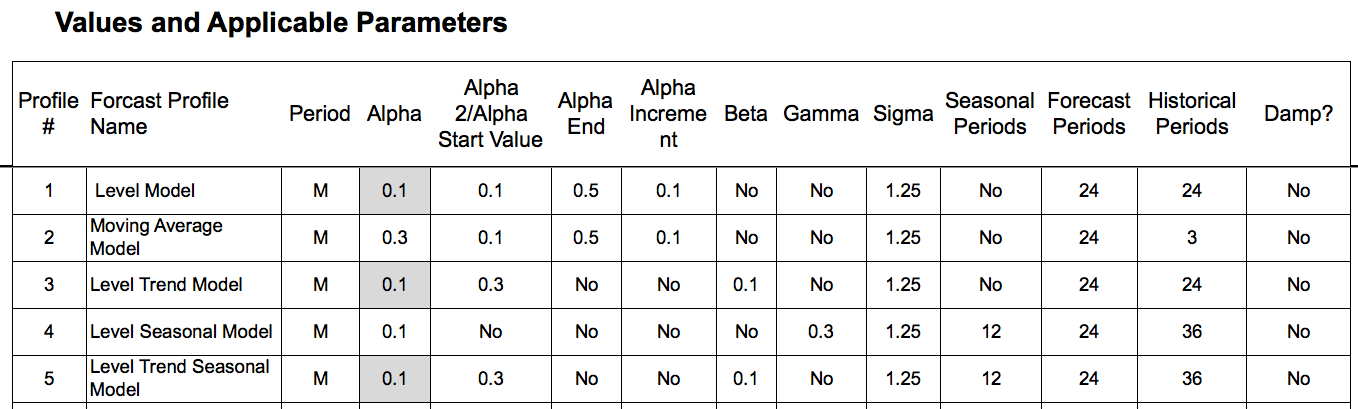
Here are some examples of parameter combinations for several custom models (the forecast is a model when the parameters are complete). We cover parameters in great detail in the book Setting Forecast Parameters in Software: Alpha, Beta, and Gamma.
Providing Advice In Opposite to the Research Conclusions
Even though the research is conclusive in this area, vendors and consulting firms not only continue to promote the use of sophisticated statistical models, they promote things like machine learning, which are not only even more complex, but they require more data streams that most companies possess. (statistical forecasting uses univariate data, while machine learning algorithms use multivariate). Strategies by firms like IBM (and many others) has been to sell machine learning, knowing companies don’t have and probably won’t be able to get the data, and then turning around and blaming the company for starting the project without having the necessary data as we cover in the article How Many AI Projects Will Fail Due to a Lack of Data?
The percentage of complex forecasting methods that are applied to the product databases of companies tend to be greatly exaggerated.
See our analysis of one client where we performed our The Brightwork Forecast Model Assignment and Profiling Project.
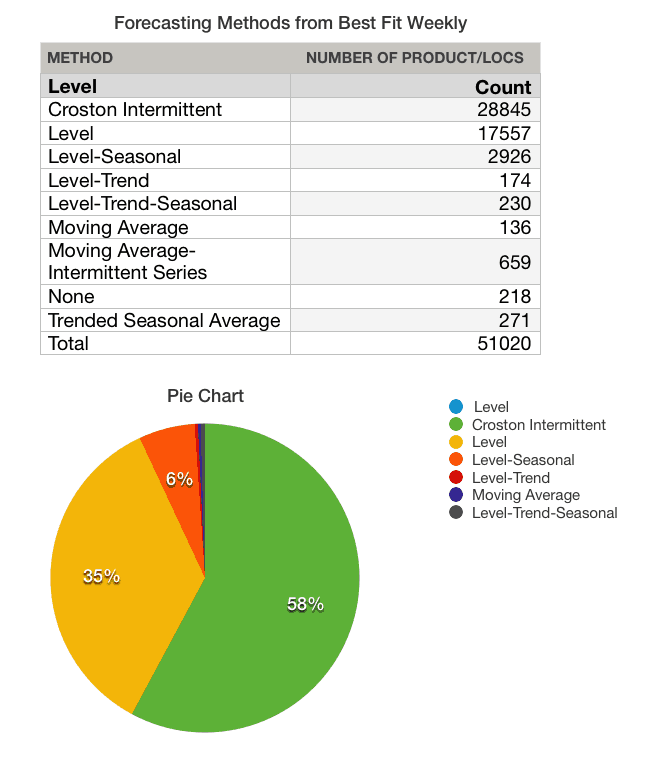
Notice the distribution of the forecast methods over the data set. This was performed with a forecasting system that had many complex methods, but in most cases, the forecasting system applied simple methods. The reason is that more complex forecasting methods require a strong pattern. However, these strong patterns are rarer and rarer in modern product datasets.
*Crostons’ Intermittent is a complex method, but when supply planning is accounted for, it is often the case that Crostons’ adds little value over a level forecast.
The broader focus in our view should be on forecast error measurement. Yet, this is the weakest area of more forecasting departments. We think a significant reason for this is a misunderstanding (which is communicated by consulting firms, vendors, and nearly all the literature on forecasting) about how to use forecast error to drive forecast accuracy improvement.
How Do You Calculate A Forecast Versus Measuring the Forecast Error
Of the two steps in forecasting, how do you calculate a forecast versus measuring forecast error, measuring forecast error is far more challenging.
However, in the field of forecasting, calculating the forecast tends to get far more emphasis.
This is a misallocation of forecasting effort. The focus should be on forecast error measurement first, and forecast calculation second.
Secondly, without being able to measure forecast accuracy effectively, it is difficult to deploy the different forecast calculations effectively, or that is the different forecast methods.
To see the full screen just select the lower right-hand corner and expand. Trust us, expanding makes the experience a whole lot more fun
A More Straightforward Approach to Forecast Error Calculation
Observing ineffective and non-comparative forecast error measurements at so many companies, we developed the Brightwork Explorer to in part, have a purpose-built application that can measure any forecast and to compare this one forecast versus another.
The application has a very straightforward file format where your company’s data can be entered, and the forecast error calculation is exceptionally straightforward. Any forecast can be measured against the baseline statistical forecast — and then the product location combinations can be sorted to show which product locations lost or gain forecast accuracy from other forecasts.
This is the fastest and most accurate way of measuring multiple forecasts that we have seen.