
The 2021 Financial Bubble and Investing Options
Executive Summary
- In June of 2021, there are multiple financial bubbles that require analysis in the US.

Introduction
This article covers the 2021 multiple asset bubbles in the US and provides some investment strategies.
Background on the Multiple Asset Bubbles of 2021
The overriding feature of these multiple bubbles has been the Coronavirus stimulating money creation by the Fed and the low-interest rates produced by the Fed.
https://seekingalpha.com/article/4433148-federal-reserve-watch-fed-must-begin-to-reduce-its-stimulus
The Fed can only keep stimulus going for so long before it brings up inflation, which then causes them to back off of further stimulus. It is shown in Michael Burry’s 13F filing that he shorted US Treasuries, under the assumption that the massive stimulus of 2020-2021 will lead to inflation.
The bubble is described as follows.
It’s time for a reckoning in bubble assets. Not since 1999 have I seen so much garbage trading at such crazy prices. That’s when the Nasdaq reached 5048 before declining 80%.
The Fed’s zero-interest rate policy—absolutely necessary to prevent a depression during the Covid crisis (and it did)—has unfortunately led to bubbles everywhere: shell companies, non-fungible tokens (NFTs), a gaggle of competing cryptocurrencies, etc…. Today’s speculators (and many hedge fund managers) are no different than the hapless day traders who lost their shirts in 2000. – Forbes
How the Fed Has Enriched the Oligarchy
The world’s major central bank has indicated it will do nothing that could be construed as withdrawing support from the mountain of debt and fictitious capital its policies have created in the US and worldwide and will continue the flow of ultra-cheap money that has enabled the enrichment of a financial oligarchy to levels never before seen in history.
Second, they have created a mountain of debt. Some indication of the extent of this process was outlined in an article in the Wall Street Journal this week. It noted that after issuing $1.7 trillion in bonds last year, nearly $600 million above the previous high, the total debt of US corporations at the end of March was $11.2 trillion, equivalent to around half of US gross domestic product.
The same situation exists in Europe, where thousands of companies are being sustained only by the zero interest rate policy of the European Central Bank and its financial asset purchases, as well as direct government support.
The creation of a debt mountain is only one consequence of the Fed’s policies. The flood of ultra-cheap money into the global financial system has promoted a wave of speculation, ranging from commodities to housing, shares of stock and cryptocurrencies, to name some examples.
The yield on corporate junk bonds—those rated below investment-grade status—has fallen to all-time lows. This week, Bloomberg reported on a company that had floated a $500 million offering of junk bonds to purchase bitcoin and received a favourable rating from Moody’s because it has a “very low cost of borrowing.”
https://www.wsws.org/en/articles/2021/06/17/pers-j17.html
Margin Debt
Margin debt in 2021 is at an all-time high.
The figure represents a 71% year-over-year jump in margin debt usage.
https://www.investors.com/how-to-invest/investors-corner/what-is-margin-debt/
Let us review previous increases in margin debt.
May 5, 1972: Margin debt up 55.8% year over year.
Dec. 3, 1999: Margin debt up 58.9%.
June 1, 2007: Margin debt up 67.5% (1).
How long has the decline or crisis been from previous record margin debt levels? See the following quote
After debt vaulted in May of 1972, the S&P 500 peaked seven months later in January 1973. The December 1999 figure came just three months before the end of the March 2000 dot-com bubble in the Nasdaq. The composite topped at 5132, then plunged 79% over the next 2-1/2 years. The June 2007 figure came four months ahead of the S&P 500’s then all-time high of 1576 in October that year.
https://www.investors.com/how-to-invest/investors-corner/what-is-margin-debt/
The average is 7 months + 3 months + 4 months) / 3 = 4.5 months from the peak to the decline.

The peak was hit in March 2021. Today is close to 3 months from that day.
The Fed Chairman Denies Knowledge of Margin Debt
Here the Fed chairman denies his knowledge of margin debt.
The interviewer, Scott Pelley, noted there had been a 49 percent increase in margin debt so far this year and asked: “At what point does the Federal Reserve start to rein in this speculative bidding up of stock prices based on borrowed money?”
Powell replied: “That sounds like margin debt. I don’t know that statistic. I really can’t react to that statistic.”
The assertion by the Fed chief that he is completely ignorant of the level of margin debt, given its significance for the stability of the financial system, simply beggars belief.
Extensive Speculation in Bitcoin and SPACs and Delis?
Another broad indicator is the increase in the money raised by special purpose acquisition companies (SPACs). The firms, sometimes described as blank cheque companies, raise money and obtain a stock market listing with the aim of taking over another company which wants to go public and join the share market boom without having to through the often-complex procedure of making an initial public offering. In the first three months of this year SPACs raised almost $88 billion, more than for the whole of 2020.
There are numerous individual phenomena which express the extent of the speculation. Chief among these is bitcoin, which earlier this month rose to a high of $64,000 before pulling back somewhat.
Possibly the most egregious expression of the market mania is the case of Hometown International which owns a small deli in Paulsboro, New Jersey. The deli had sales of just $21,772 in 2019 and only $13,976 in 2020 when it was closed for six months due to the COVID-19 pandemic. But recently its share market valuation topped $100 million. As one hedge fund manager commented “the pastrami must be amazing.”
The Rise of Amateur Investors
But embracing social could leverage some of its strongest assets: the youthfulness of its user base and the depth of connection to its users. The median age of a Robinhood customer is 30, and half say they’re first-time investors. Being able to turn to friends or experts within the app might convince them to pull the trigger on trades.
Robinhood earn more from its customers despite their small total account balances. While Robinhood might have more than 10 million accounts versus E-Trade’s 5.2 million and Morgan Stanley’s 3 million, E-Trade’s average account size is $69,230 and Morgan Stanley’s is $900,000, while a survey found most of Robinhood’s held $1,000 to $5,000.
*https://techcrunch.com/2020/02/20/robinhood-profiles-morgan-stanley-etrade/
There are many investors who have not seen significant declines in assets.
The Fed’s Massive Intervention
It should be recalled that the origins of the present maniacal phase of the stock market boom lie in the massive intervention by the Fed beginning in March 2020 when markets collapsed and the $21 trillion market for US Treasury bonds, the basis of the global financial system, froze.
The Fed’s intervention, amounting to trillions of dollars and supporting all financial markets, including the purchase of stocks for the first time, was an extension and qualitative development of the policies it has pursued ever since the stock market crash of October 1987 when it initiated the program of supplying ever cheaper money to the markets in response to a crisis.
All the conditions are now developing for another crisis, going far beyond the scale of the crash of 2008, in which the working class will be directly confronted with the necessary task of taking political power in its own hands in order to begin the reconstruction of the US and global economy on socialist foundations.
https://www.wsws.org/en/articles/2021/05/01/mark-m01.html
Scion Holdings
https://whalewisdom.com/filer/scion-asset-management-llc#tabholdings_tab_link
- 40% Short on Tesla
- A short against US Treasury Bonds.
- Long on Google and Facebook
Conclusion
The signs of multiple bubbles are found in the following evidence.
- Since Mar 2020 in particular, there has been a record increase in margin debt.
- The record Fed stimulus in response to the economic decline of the Coronavirus shutdowns.
- The Case Schilling Index is very close to a record high and matches the peak to trough from 2006.
- Non-bank or shadow bank lenders are becoming much more prevalent even replacing many banks, and using bank loans to support their loaning activity.
- On a specific note, Tesla was run up by a factor of 8x in 2020, in great part due to being included in the S&P 500 and hence being a required purchase for index funds. Tesla now sells for a PE of 1000.
- Bitcoin was driven to $58,000 in part due to being accepted as payment by Tesla (which was promptly retracted by Elon Musk) (as of July 20 it is now down to around $30,000). However, overall Bitcoin is the sign of an enormous speculative bubble.
- Micheal Burry considers this the greatest speculative bubble of all time, as can be seen in the following quote.
“People always ask me what is going on in the markets. It is simple. Greatest Speculative Bubble of All Time in All Things. By two orders of magnitude. #FlyingPigs360,” – Michael Burry
So the following investments, from other analyses, are currently considered the methods of shorting these three bubbles.
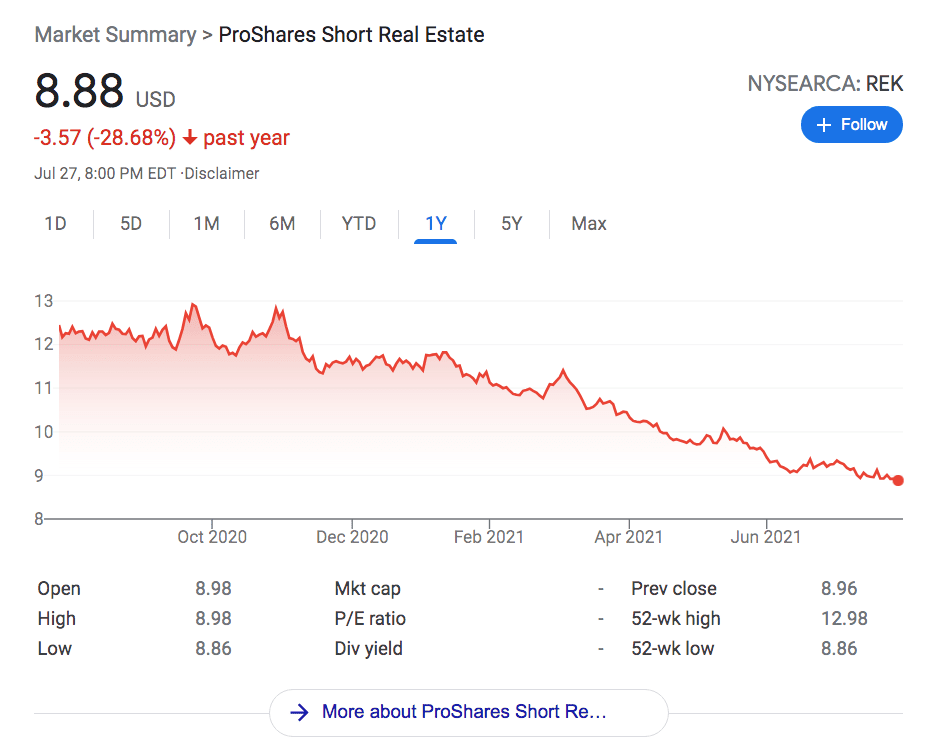
- Real Estate: Proshare Inverse Real Estate ETF
- Overall S&P 500: The Inverse (-1x) S&P 500 ETF and the Ultra Inverse (-3x) S&P 500 ETF
- Tesla: Granite Shares Reverse Tesla ETF
- Blink: This would have to be a direct short.
- Zillow: This would have to be a direct short.
- Bitcoin: Horizons Inverse Bitcoin ETF
ETF History
Proshares Inverse Short S&P 500
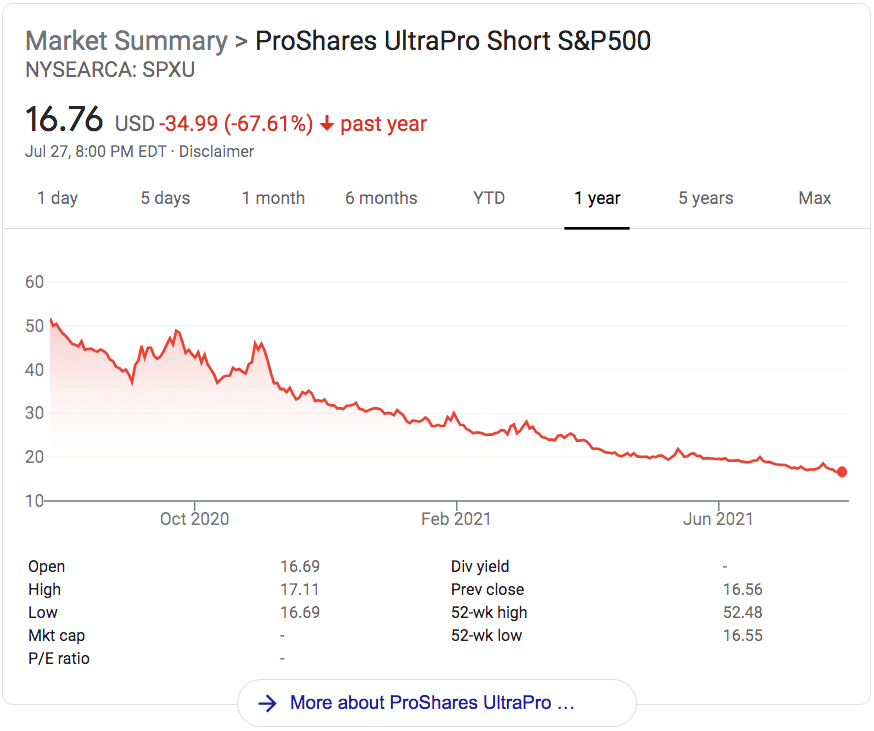
Proshares Inverse Ultra Short S&P 500

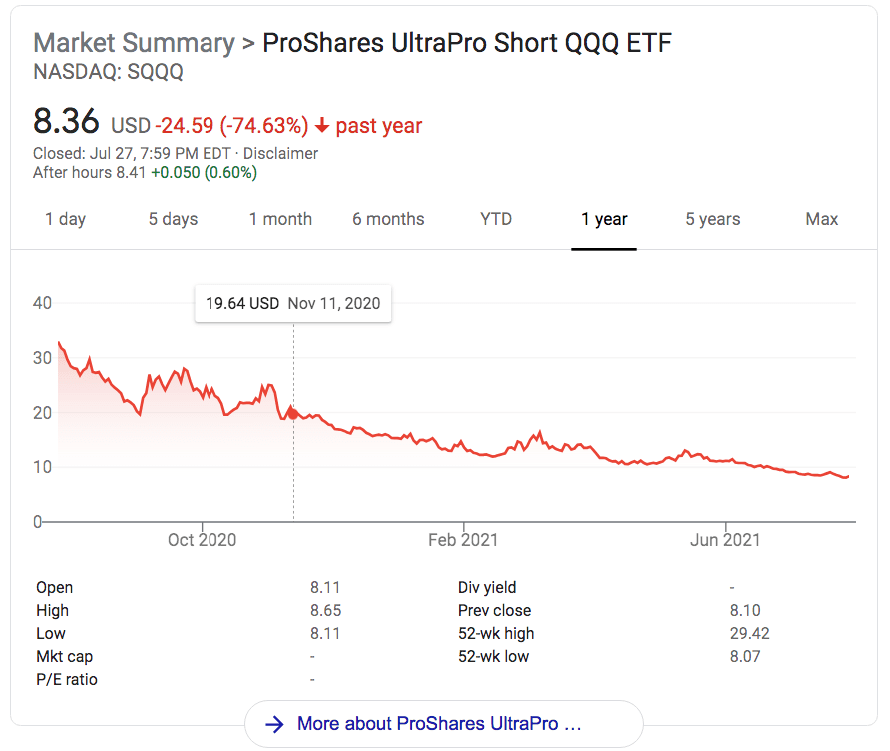
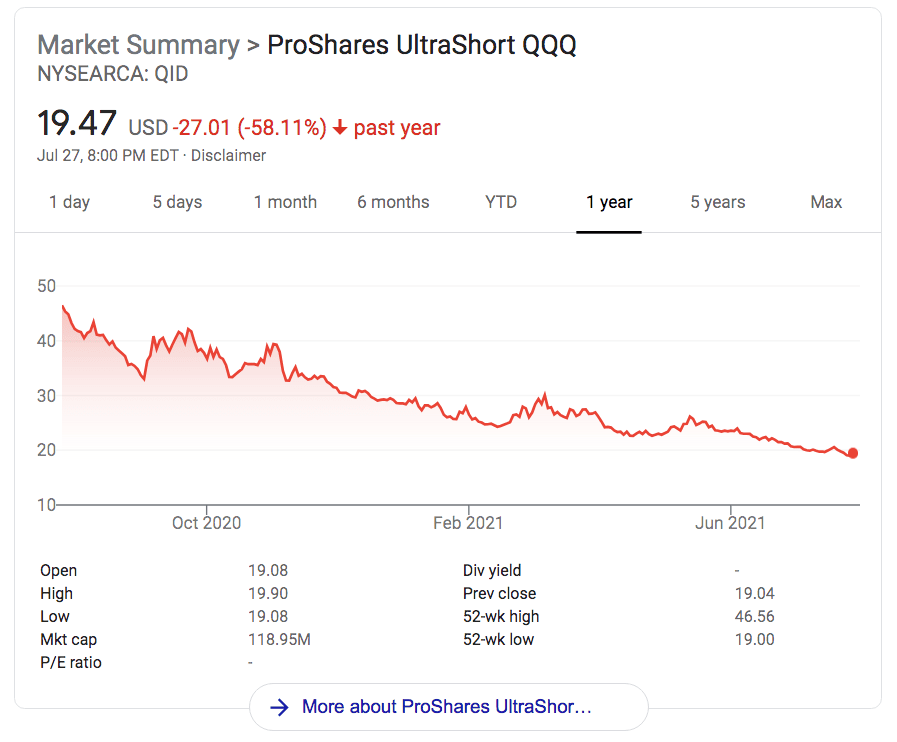
Proshares Inverse Ultra Short NASDAQ
Proshares Inverse Real Estate Ultra Short

Proshares Inverse Real Estate Ultra Short
Proshares Inverse Nasdaq
Proshares Inverse Ultra Short Industrials

Proshares Inverse Ultra Short Technology

Proshares Inverse Big Banks

The next question is one of asset or investment allocation.
All of these areas are bubbles. The overall real estate and S&P 500 investments are the lower risks as they are a bet against the overall trend, the Tesla and Bitcoin shorts are the highest risk. Both are held up by a near-religious belief by the proponents of each. These contain large percentages of people that do not understand EVs or money (that is what makes money “money”), and they are buying the hype of the EV industry and the cryptocurrency industry.
The time of investment should be soon because there is no telling when these bubbles will decline. Each of these areas is obviously bubbles.
More Detailed Articles for Bubbles in Each Area
The 2021 US Real Estate Bubble